


F1F2 project data analysis Hawaii 2023
This post details respirometry data analysis of the Montipora capitata F1F2 project at the Hawaii Institute of Marine Biology (HIMB) in June 2023.
Overview
We collaborated with the Coral Resilience Lab at HIMB to measure metabolic rates in an ongoing project to examine the effects of selective breeding on coral thermal tolerance. In this project (“F1F2”) we examined metabolic rates of coral larvae from F1 and F2 generations of wildtype corals (fertilized from gametes from the wild population in Kaneohe Bay) and selectively bred corals with non-bleaching history (fertilized from parents that did not bleach in previous bleaching events). This post details the respirometry data collection, analysis, and findings from these groups of corals.
See the Coral Resilience Lab website for more information on coral selective breeding and resilience research.
Respirometry Protocol
We examined metabolic rates using respirometry protocols used in our examination of larvae with different symbiont species in June 2023. The full notebook post from our work in this project can be found on my notebook website here and at the GitHub repository for our project here.
This protocol is adapted from the Putnam Lab SDR equipment and respirometry protocol.
The Coral Resilience lab successfully collected larvae from parent colonies (F1 WT) of non-bleached corals and wildtype adults (F1 WT) as well as larvae spawned from 5-year-old WT (F2 WT) and NB offspring (F2 NB).
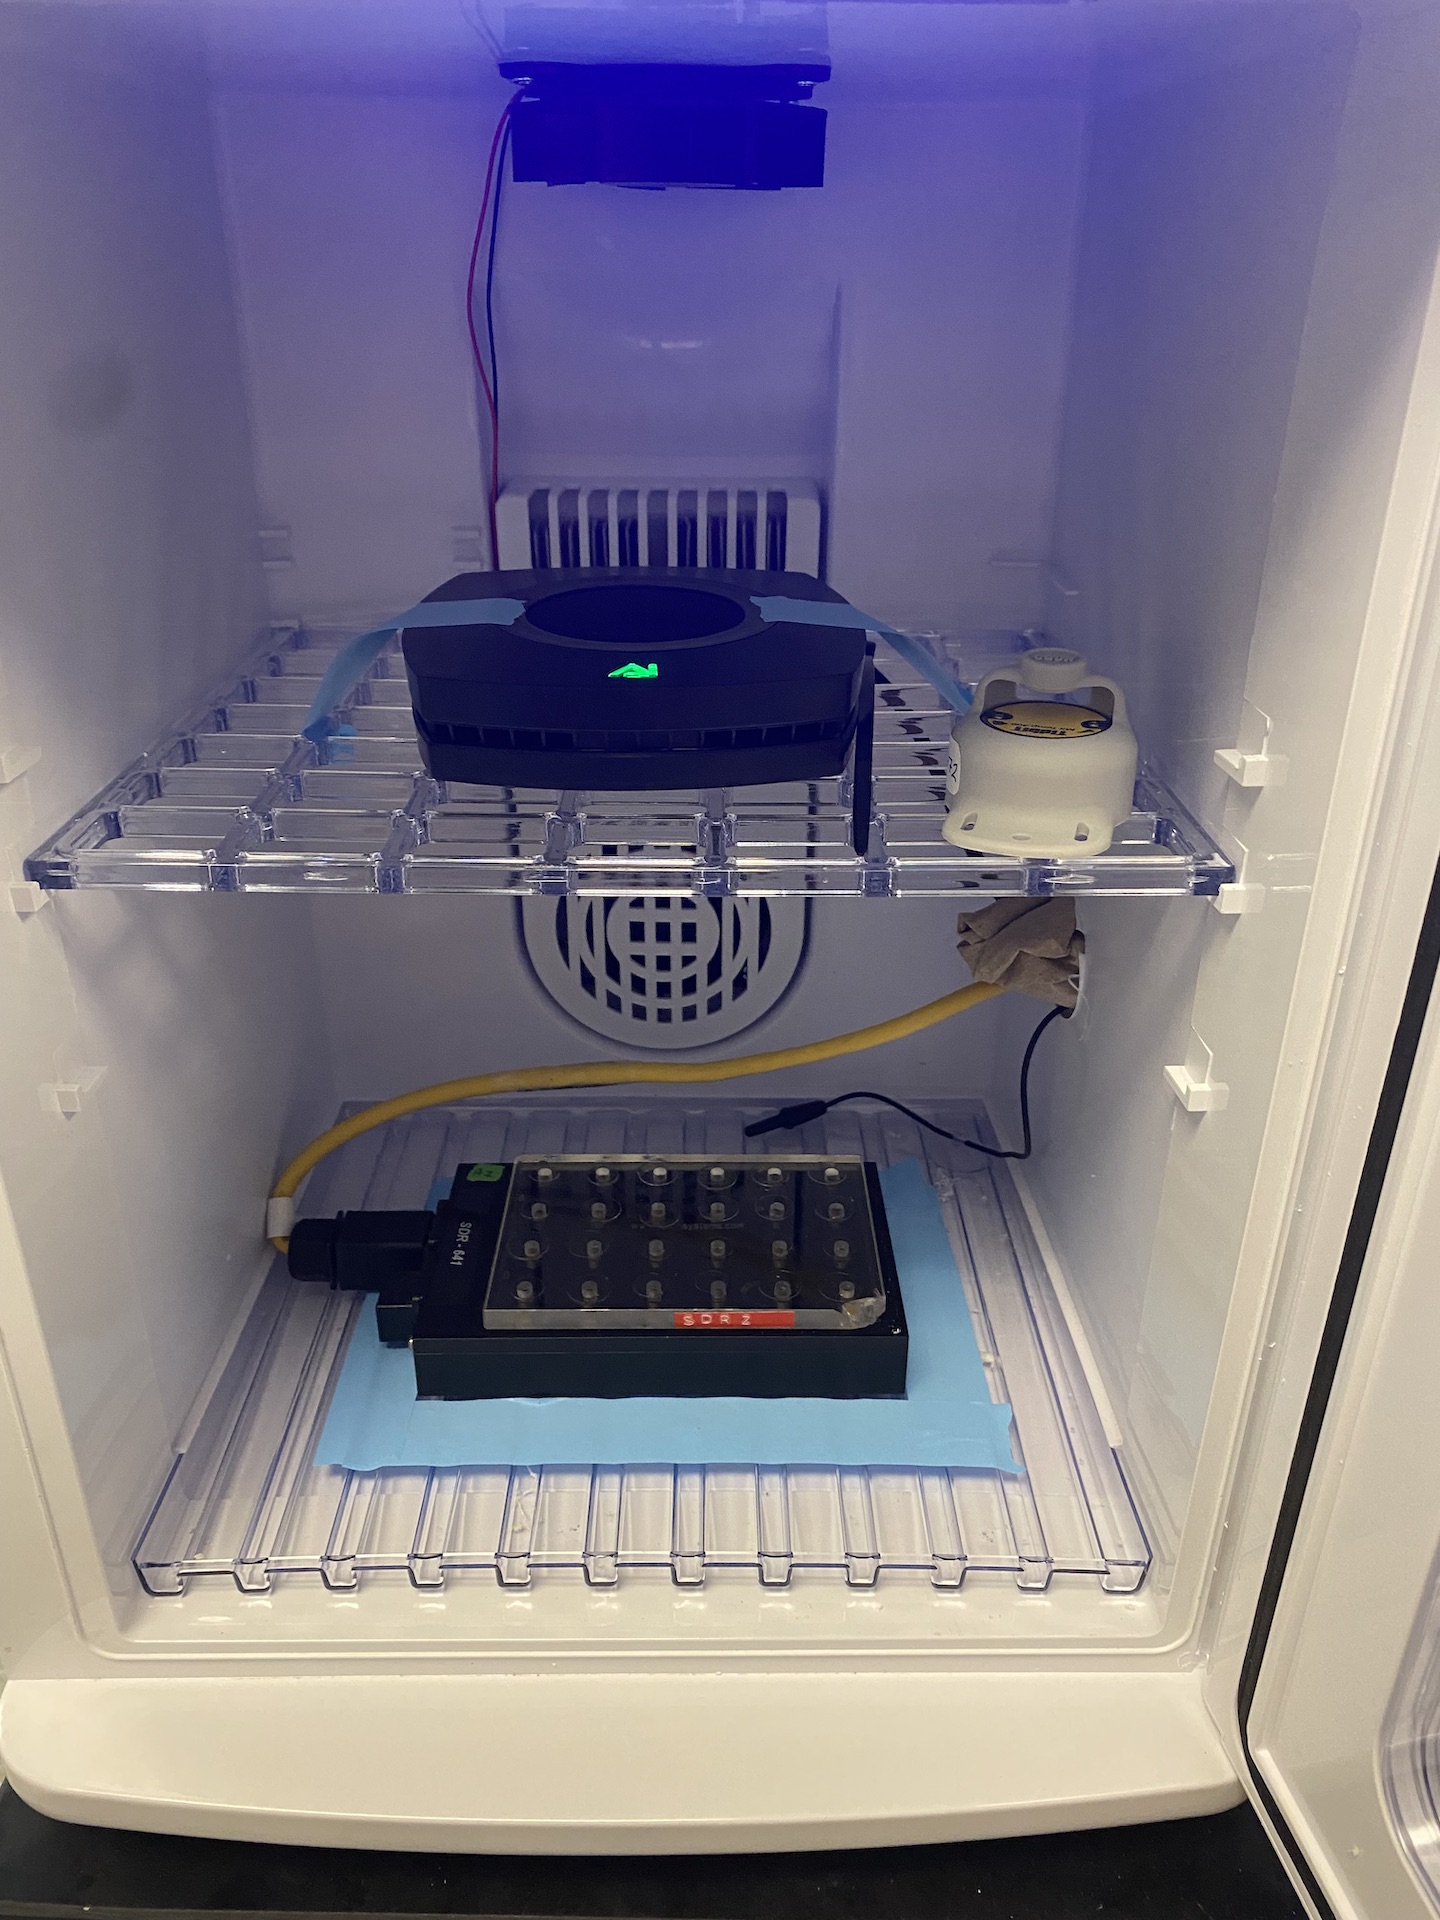
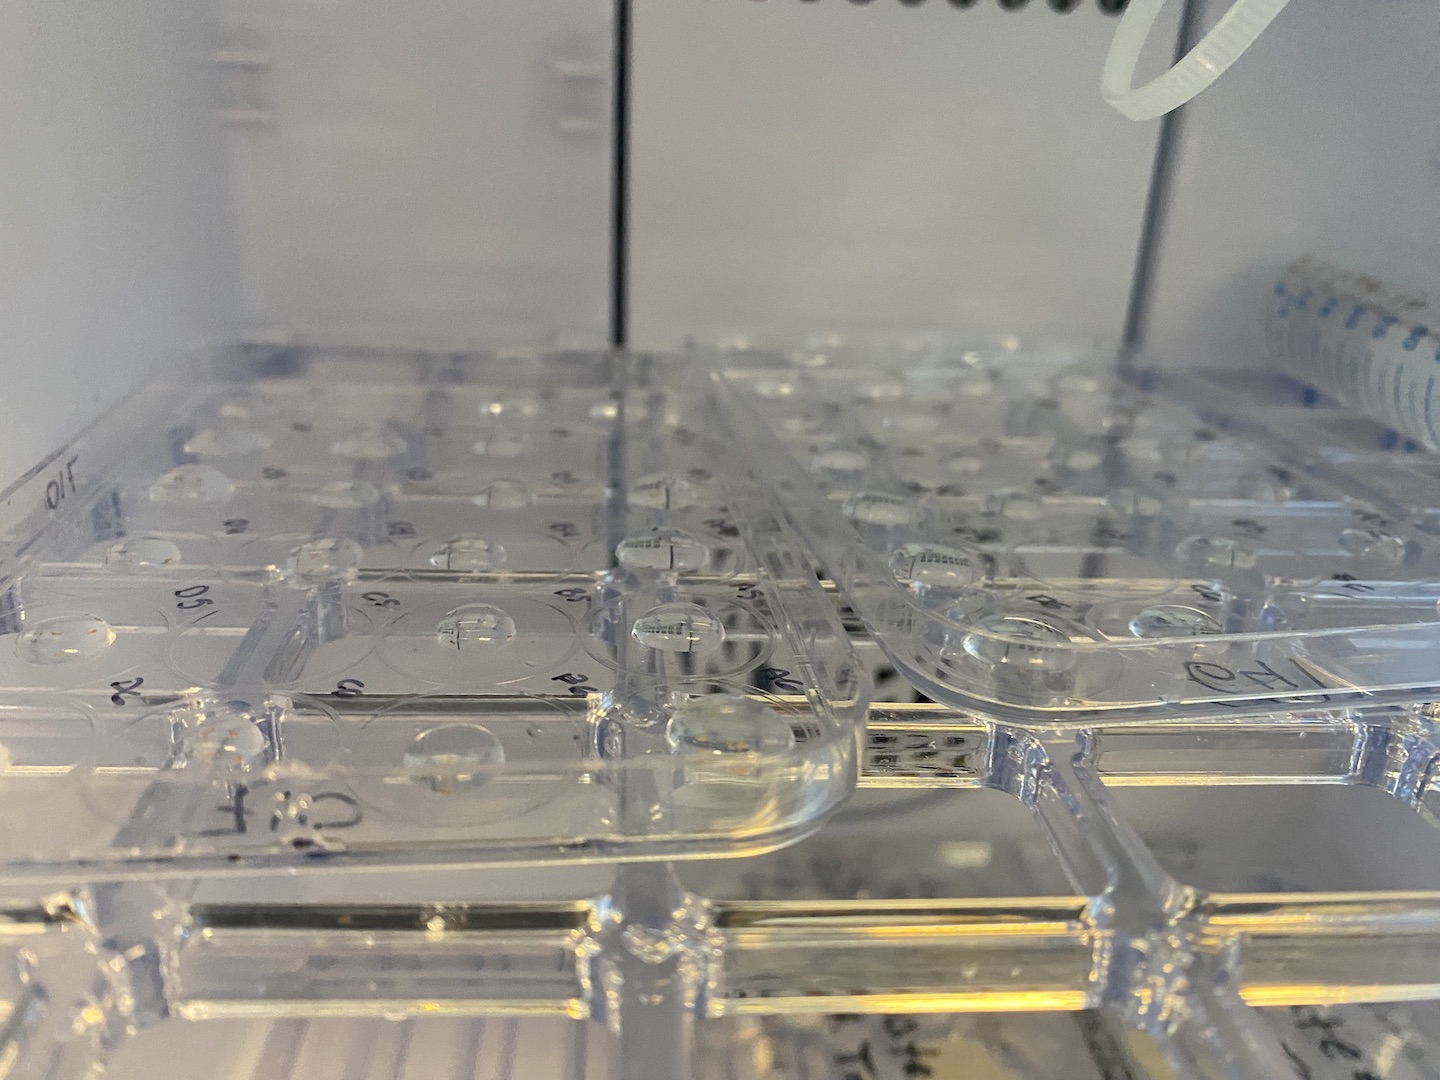
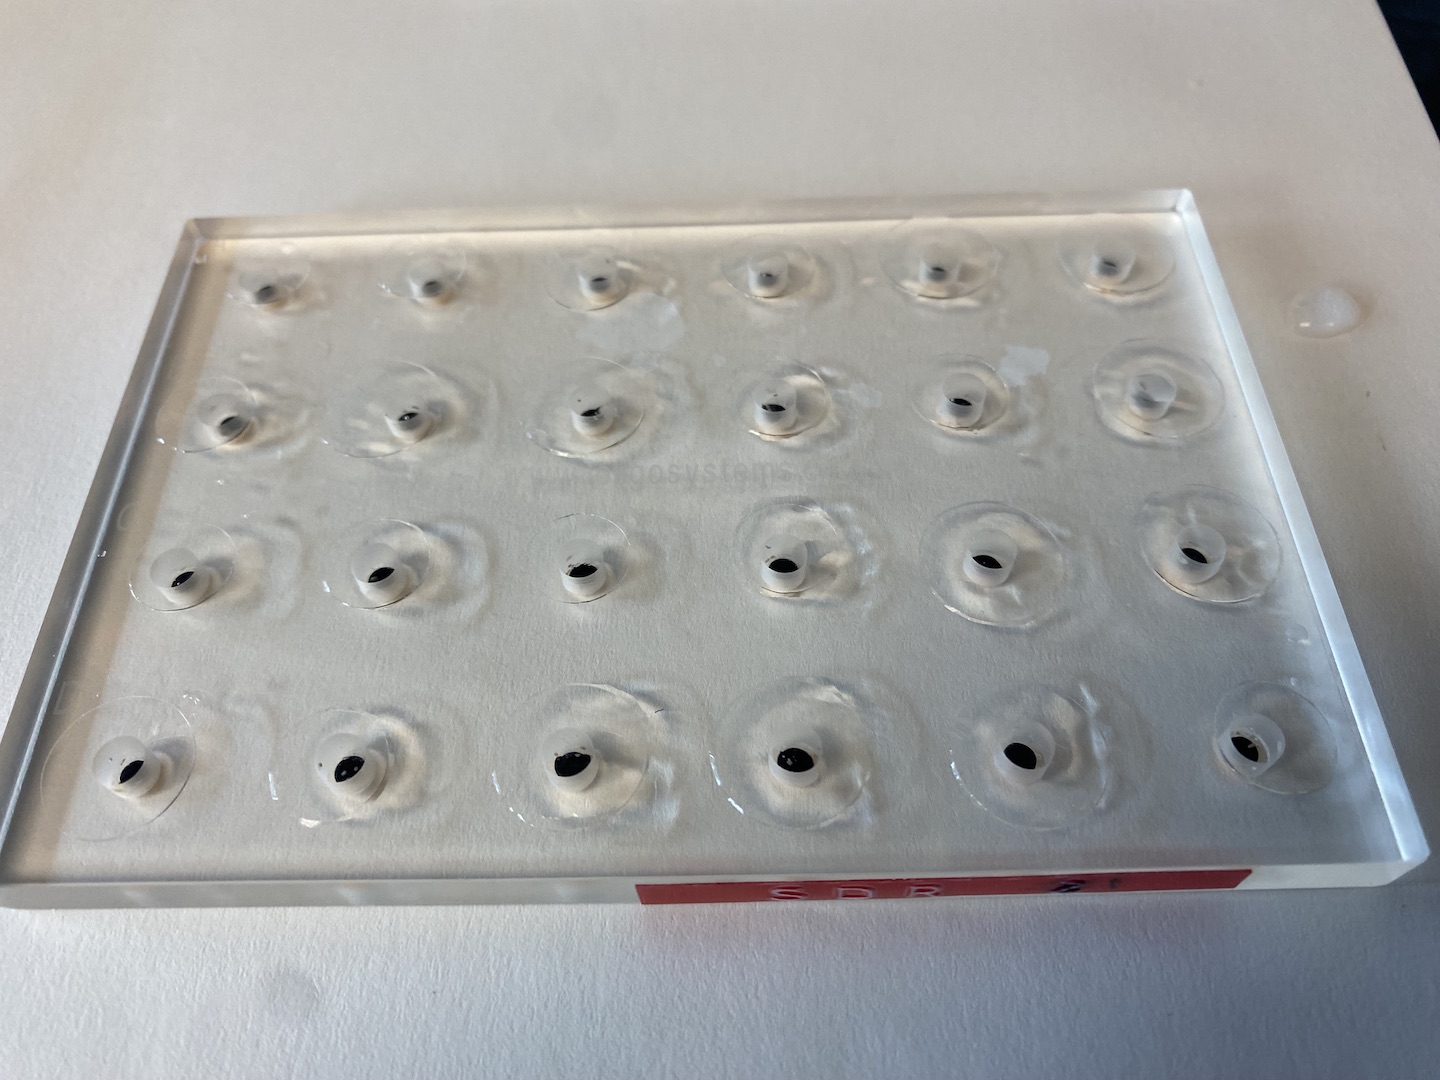
Respirometry measurements were conducted with a dual Sensor Dish Reader (SDR, PreSens) in combination with a glass 24-well microplate (80 µL wells) in incubators with an AquaIllumination Prime 16HD light source. Oxygen concentration (µmol per litre) is read every 15 seconds in each well. Pools of 5 larvae of each type (F1/F2 WT/NB) are loaded into each well. Each plate contained 5 wells of each larval group along with 4 blanks. All runs were run on duplicate plates (n=10 per larval group per temperature). Blanks and larval wells were loaded with 1 µm filtered seawater.
We ran photosynthesis (P) and respiration (R) measurements across a temperature x light profile. We first dark adapted larvae in incubators and then exposed them to 0 PAR (dark respiration), 50 PAR (low light photosynthesis), 100 PAR (medium light photosynthesis), and 500 PAR (high light photosynthesis), followed by another measurement at 0 PAR for light-enhanced respiration. These light values were chosen based on a PI curve we conducted in M. capitata larvae that can be found on GitHub here. Notice saturation of the curve at approximately 100-200 PAR. We therefore selected a light value that was lower, at, and above this saturating value.
We did one set of measurements at ambient (27°C), high (33°C), and extreme temperature (36°C). All plates were calibrated with 100% air saturated FSW before each run at the respective temperature. This provided us with the ability to calculate dark respiration (Rd), light enhanced respiration (LER), and photosynthesis across light levels. From these measurements, we can calculate gross photosynthesis, net photosynthesis, Rd, LER, and P:R ratio at low, medium, and high light across temperatures.
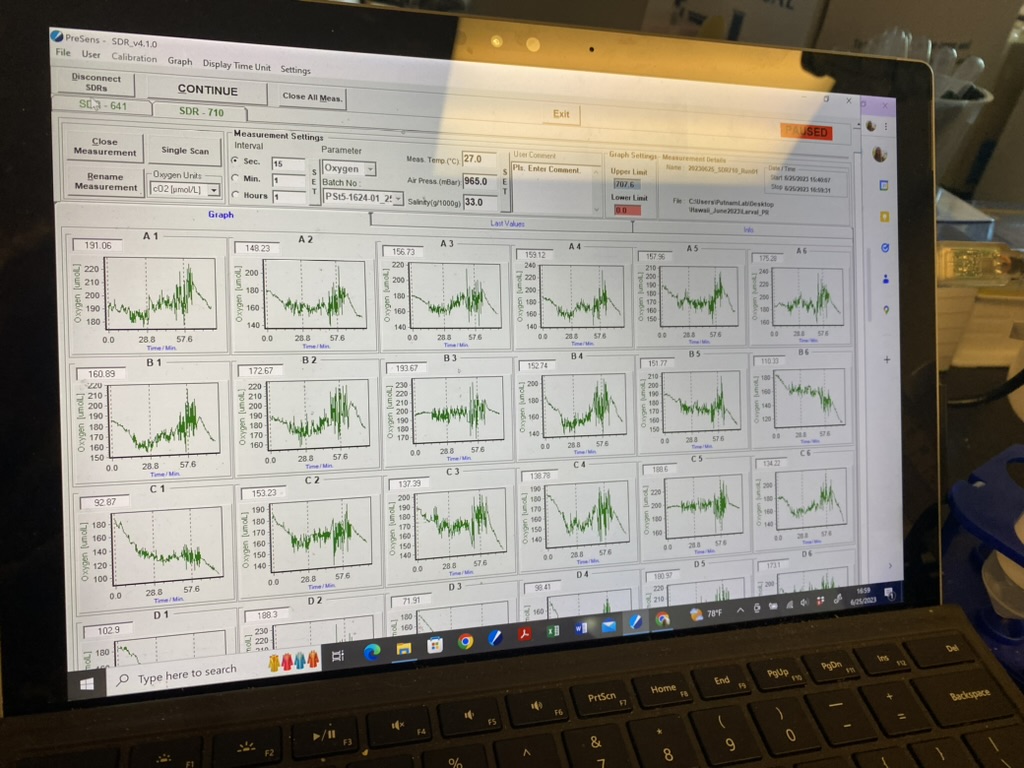
Here is an example of the oxygen data from this temp x light protocol. You can clearly see the respiration and light phases in the order of dark - low light - medium light - high light - and dark.
Data and metadata can be found on GitHub here.
Data analysis and figures can be found on GitHub here and scripts can be found here for rate extraction and rate analysis here.
Steps in data analysis are described below.
Data Analysis
Oxygen concentration during each light phase of each run was extracted using the LoLinR package in R using the percentile rank method and alpha set to 0.4. Metabolic rates were corrected by subtracting blank values averaged for each replicate plate and then normalized to well volume and the number of larvae to express rates as nmol O2 per larva per min.
Here is an example of the code loop used to extract rates from each replicate in each run. This code reads in the oxygen data from the data file, splits the data into each light phase by a time stamp data frame, and then extracts a slope that is calculated as the metabolic rate.
The script for slope extraction can be found on GitHub here.
for(file in 1:length(file.names)) { # for every file in list start at the first and run this following function

  for (i in Light_Values) { #in every file, for each light value

  Photo.Data <-read.table(file.path(path.p,file.names[file]), skip = 56, header=T, sep=",", na.string="NA", fill = TRUE, as.is=TRUE, fileEncoding="latin1") #reads in the data files
  Photo.Data$Temp <- Photo.Data[,31] #assigns temp column
  Photo.Data$Time.Min <- seq.int(from=0, to=((nrow(Photo.Data)*0.25)-0.25), by = 0.25) #set time in min

  # extract start and end times for the respective plate

  starttime<-Run.Info%>%
    select(Plate, Light_Level, IntervalStart)%>%
    filter(Plate==plate[file])%>%
    filter(Light_Level==i)%>%
    select(IntervalStart)%>%
    as.data.frame()

   starttime<-starttime[1,1]

   endtime<-Run.Info%>%
    select(Plate, Light_Level, IntervalStop)%>%
    filter(Plate==plate[file])%>%
    filter(Light_Level==i)%>%
    select(IntervalStop)%>%
    as.data.frame()

   endtime<-endtime[1,1]

  #filter by light interval
  Photo.Data <- Photo.Data %>% #filters data by interval for light
     filter(Time.Min > starttime)%>%
     filter(Time.Min < endtime)

  Photo.Data.N <- Photo.Data[,3:26] #subset desired columns

  #add column names back in
  Photo.Data.N<-as.data.frame(Photo.Data.N)

  for(j in 1:(ncol(Photo.Data.N))){
    model <- rankLocReg(
      xall=Photo.Data$Time.Min, yall=as.numeric(Photo.Data.N[, j]),
      alpha=0.4, method="pc", verbose=TRUE) #extract slopes, percentile rank method with minimum window size of 0.4. This means that in order to fit a slope, it has to encompass at least 40% of available datapoints.

    pdf(paste0("output/F1F2_sdr/PhotosynthesisPlots/",date[file], "_Plate",plate[file],"_",rename[j],"_light", Light_Values[i],"_regression_trunc.pdf")) #generate output file names
    plot(model)
    dev.off()

    Photo.Rb[j,1] <- as.character(date[file]) #stores the date
    Photo.Rb[j,2] <- as.character(plate[file]) #stores the run number
    Photo.Rb[j,3] <- as.character(samp[j+(i-1)*ncol(Photo.Data.N)]) #stores the sample ID
    Photo.Rb[j,4] <- as.character(rename[j]) #stores the chamber ID
    Photo.Rb[j,5] <- as.character(i) #stores the chamber ID
    Photo.Rb[j,6:7] <- model$allRegs[i,c(4,5)] #inserts slope and intercept in the dataframe

  }

  Photo.R <- rbind(Photo.R, Photo.Rb) #bind final data frame
  }

}
This script produces a PDF file that shows the statistics and slope extraction. Here is an example of respiration measurements in the dark:
And here is an example of measurements from a light phase (photosynthesis):
You can see the negative slope in the respiration data indicating oxygen consumption and a positive slope in the photosynthesis data indicating oxygen production.
After slope extraction, we then correct the values by substracting blank values and accounting for volume and number of larvae.
Finally, we convert oxygen consuption values to the inverse such that data is expressed on a positive scale for respiration. In cases where respiration oxygen consumption values were <0 (indicating net oxygen production), value was set to 0 (indicating no respiration). In cases where photosynthesis oxygen production values were <0 (indicating net oxygen consumption), value was set to 0 (indicating no photosynthesis).
We are now ready for data analysis!
Findings
The script for data analysis can be found on GitHub here.
Metabolic rates across light and temperature
I first plotted metabolic rates across the light curve for each temperature. The plot below shows oxygen values across light levels. Note that the values below 0 are oxygen consumption (respiration) and values above 0 are oxygen production (photosynthesis).
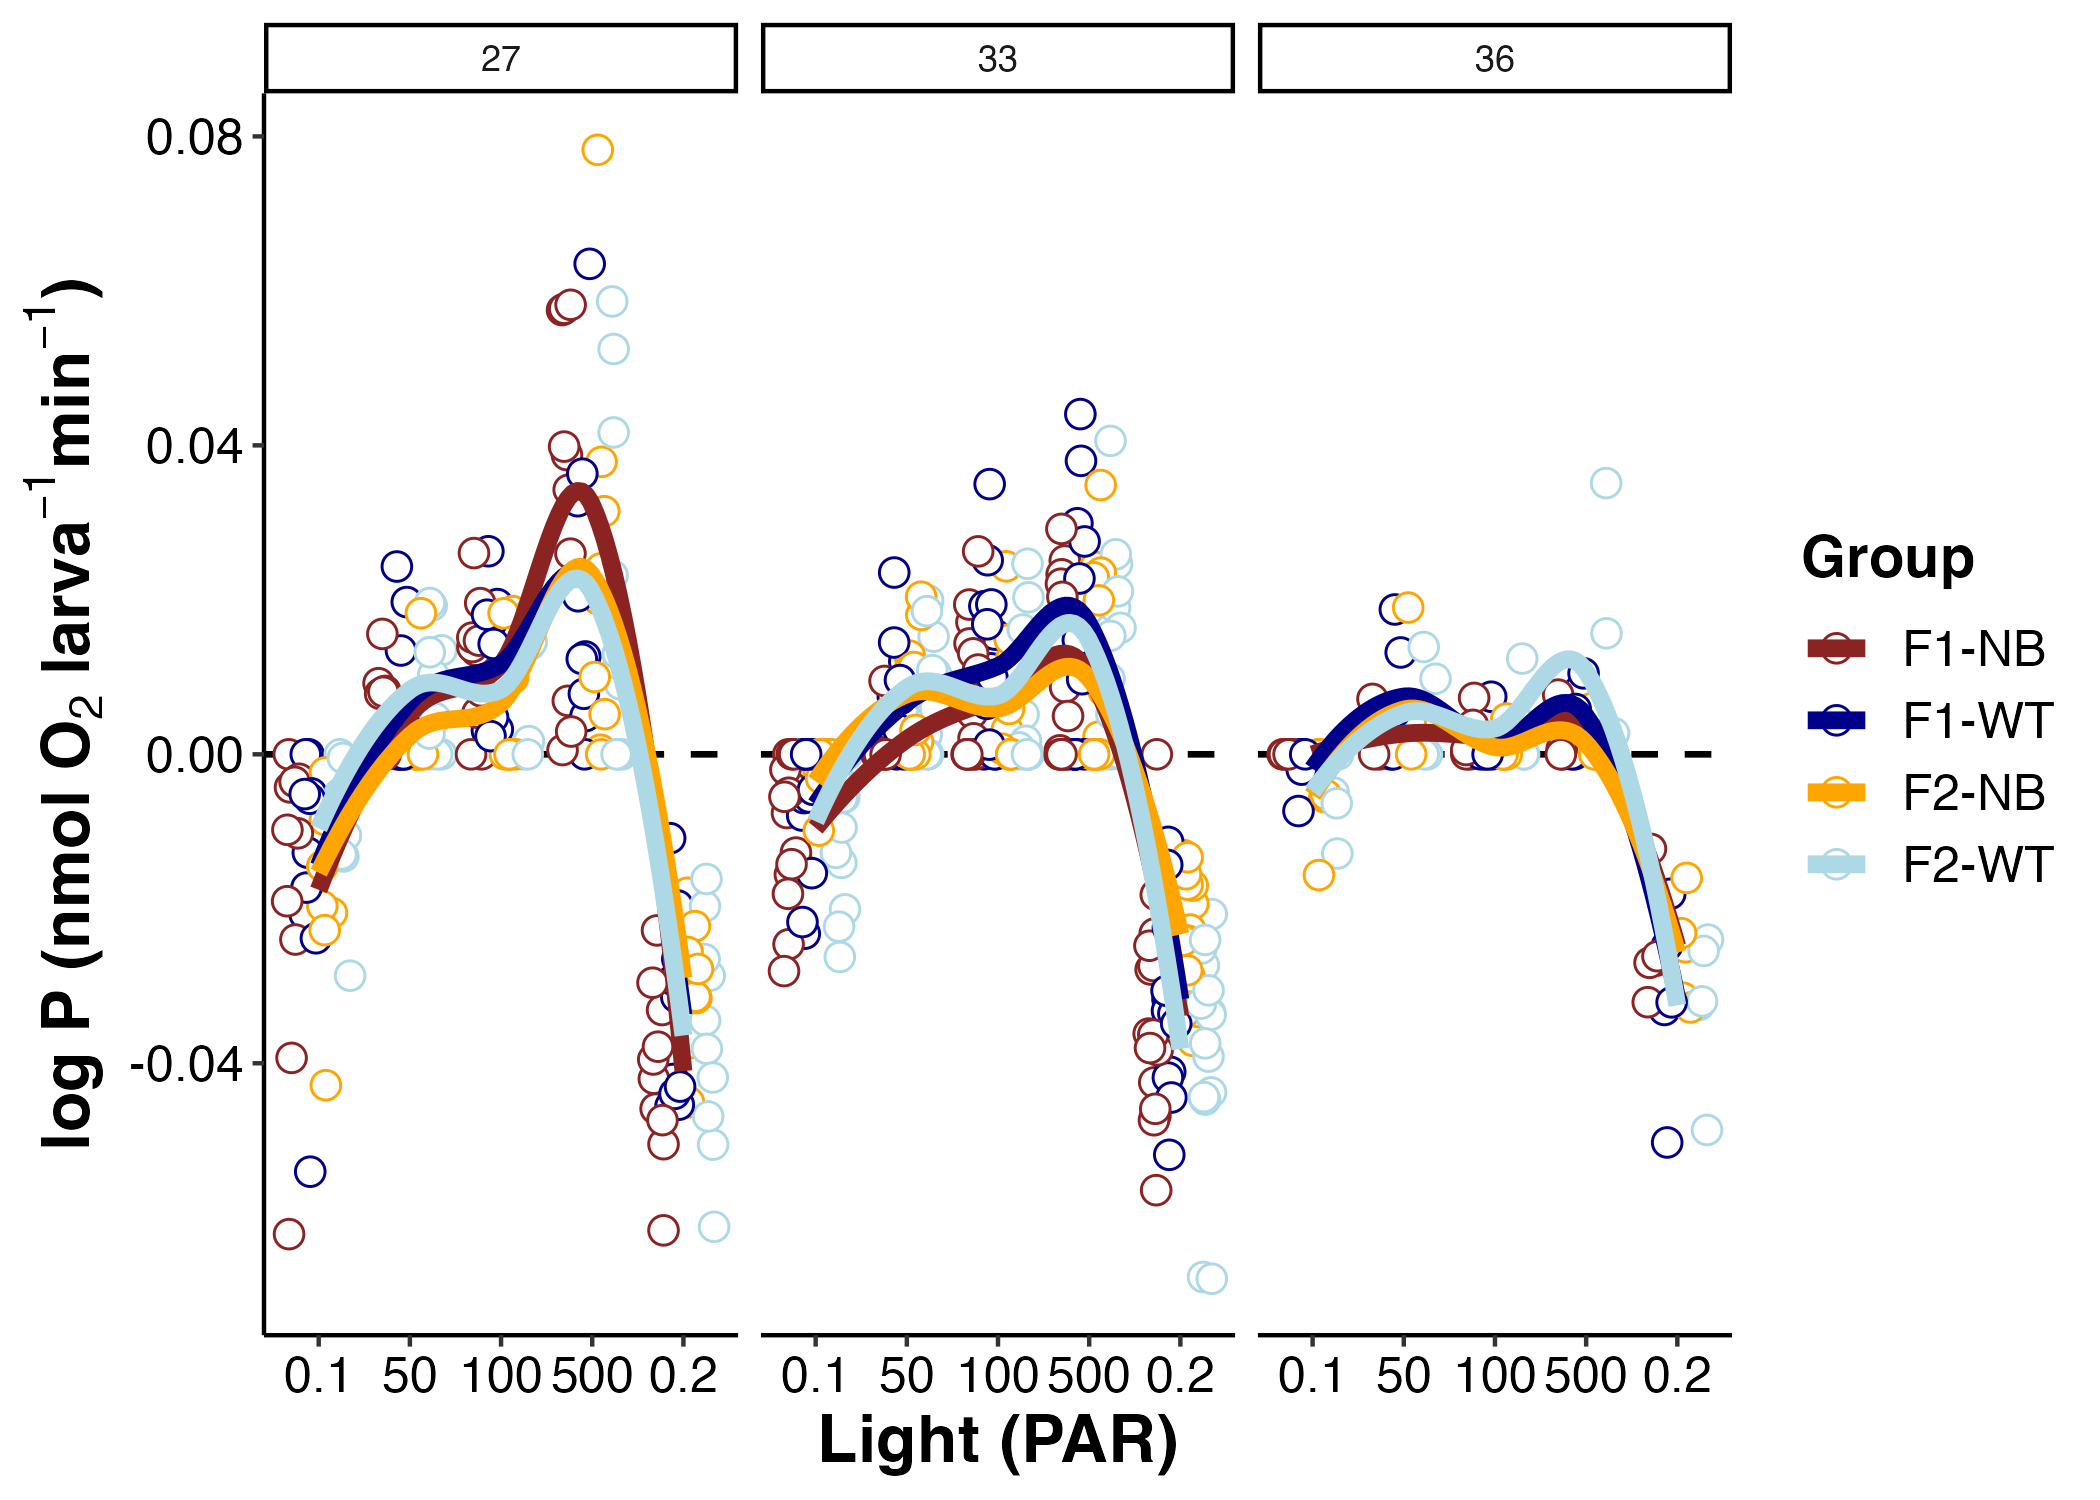
There are a few things to take away from this first look at the data:
- The shape of the curve changes by temperature, with the curve becoming more shallow (less photosynthesis) at higher temperatures.
- The shape of this curve is expected with higher photosynthesis with higher light values.
- Respiration values are greater at the ending dark (0.2 PAR) than the beginning dark stage (0.1 PAR). Note that 0.1 and 0.2 are truly 0 PAR, but I added the decimal to order the X axis in the correct order. This is expected because light enhanced respiration is greater due to the stimulation of animal respiration from the production of nutritional products and oxygen from symbiont photosynthesis. This stimulation is not present in dark adapted larvae since photosynthesis was not active prior to respiration measurements.
- There is not a large obvious difference in larval group in the shape of these curves, but we may detect differences by calculating metrics which we will do next.
I tested for light x temperature x group interactions with an ANOVA.
summary(aov(P.nmol.org.min~PAR*Group*Temperature, data=pr_data))

                       Df  Sum Sq Mean Sq F value   Pr(>F)
PAR                     4 0.17001 0.04250 355.057  < 2e-16 ***
Group                   3 0.00039 0.00013   1.079    0.357
Temperature             2 0.00028 0.00014   1.166    0.313
PAR:Group              12 0.00285 0.00024   1.981    0.024 *
PAR:Temperature         8 0.00889 0.00111   9.288 4.99e-12 ***
Group:Temperature       6 0.00057 0.00010   0.796    0.573
PAR:Group:Temperature  24 0.00243 0.00010   0.846    0.677
Residuals             536 0.06416 0.00012
Metabolic rates are affected by PAR, PAR x group interaction, and a PAR x temperature interaction. This indicates that larval groups have different P and/or R rates and that P and/or R rates are different by temperature.
There is no interaction between group x temperature or group x PAR x temperature, indicating that differences in larval groups are driven by light, rather than strongly different by temperature.
Calculating metabolic metrics
I then calculated metabolic rates to generate the following metrics:
- Light enhanced respiration: Respiration rate in the dark following exposure to light
- Dark respiration: Respiration in the dark following dark adapt period
- Net photosynthesis (low, medium, high light): Oxygen production in excess of host respiration
- Gross photosynthesis (low, medium, high light): Total oxygen production (P gross + R)
- P:R ratio (low, medium, high light): Photosynthesis divided by light enhanced respiration. We use light enhanced respiration for this calculation because respiration will be light enhanced when photosynthesis is active. This is the most ecologically relevant metric to compare oxygen demand and production. A P:R of 1 indicates that P meets R demand. A P:R greater than 1 indicates oxygen production that is higher than demand.
These metrics are calculated using the following script:
pr_data_calc<-pr_data%>%
  select(Date, Chamber.ID, Plate, Run, Temperature, Group, PAR, P.nmol.org.min)%>%
  pivot_wider(names_from=PAR, values_from=P.nmol.org.min)%>%
  mutate(ler=`0.2`)%>%
  mutate(rd=`0.1`)%>%
  mutate(ler_inverse=ler*-1)%>%
  mutate(rd_inverse=rd*-1)%>%
  mutate(p_net_low=`50`)%>%
  mutate(p_net_medium=`100`)%>%
  mutate(p_net_high=`500`)%>%
  mutate(p_gross_low=p_net_low-ler)%>%
  mutate(p_gross_medium=p_net_medium-ler)%>%
  mutate(p_gross_high=p_net_high-ler)%>%
  mutate(ratio_low=p_gross_low/(ler_inverse))%>%
  mutate(ratio_medium=p_gross_medium/(ler_inverse))%>%
  mutate(ratio_high=p_gross_high/(ler_inverse))%>%
  pivot_longer(names_to="Metric", values_to="Value", cols=c(ler:ratio_high))%>%
  select(!c(`0.1`, `100`, `500`, `0.2`))
Note that for P gross, P net, and P:R ratio we will have values at 50 PAR (low light), 100 PAR (medium light), and 500 PAR (high light).
LER and RD metrics
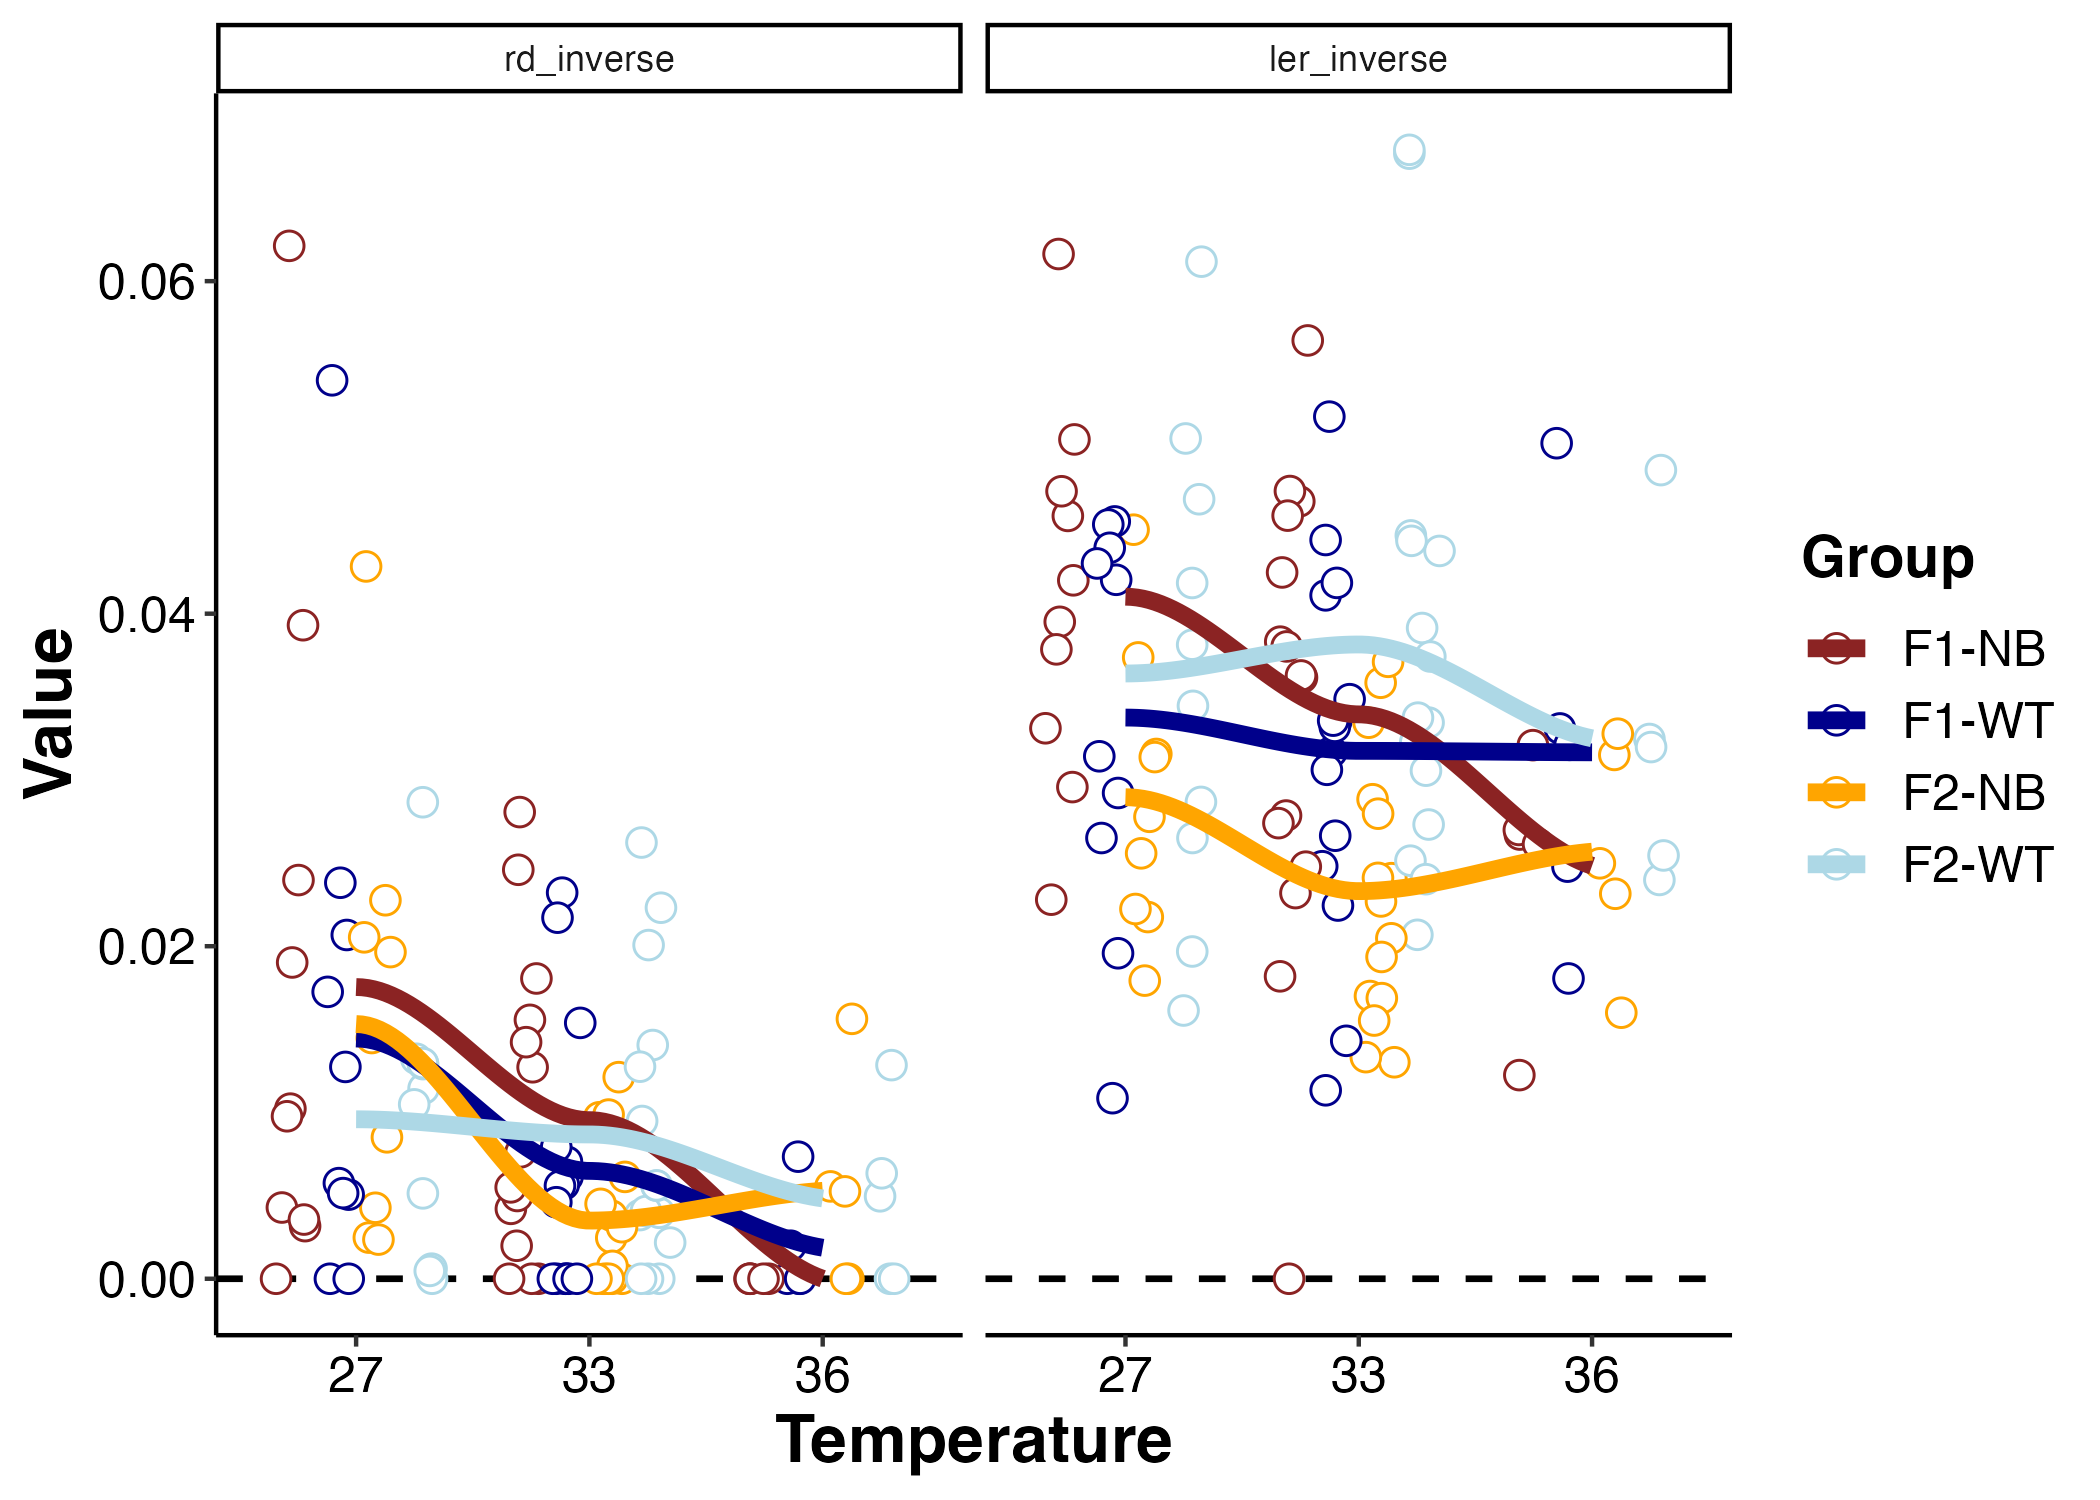
Here is a plot of LER and Rd.
I ran an ANOVA to examine the effect of temperature and group on LER and RD.
Here are the results for LER:
model<-pr_data_calc%>%
  filter(Metric=="ler_inverse")%>%
  aov(Value~Group*Temperature, data=.)

summary(model)

TukeyHSD(model, "Group")

                   Df   Sum Sq   Mean Sq F value Pr(>F)
Group               3 0.002097 0.0006990   5.222 0.0021 **
Temperature         2 0.000566 0.0002832   2.116 0.1256
Group:Temperature   6 0.000655 0.0001092   0.816 0.5601
Residuals         107 0.014322 0.0001338

$Group
                    diff          lwr           upr     p adj
F1-WT-F1-NB -0.002383062 -0.010179240  0.0054131151 0.8553014
F2-NB-F1-NB -0.009310296 -0.017173395 -0.0014471977 0.0133997
F2-WT-F1-NB  0.001840431 -0.005955747  0.0096366084 0.9267442
F2-NB-F1-WT -0.006927234 -0.014790333  0.0009358648 0.1046285
F2-WT-F1-WT  0.004223493 -0.003572684  0.0120196708 0.4935361
F2-WT-F2-NB  0.011150727  0.003287628  0.0190138261 0.0019109
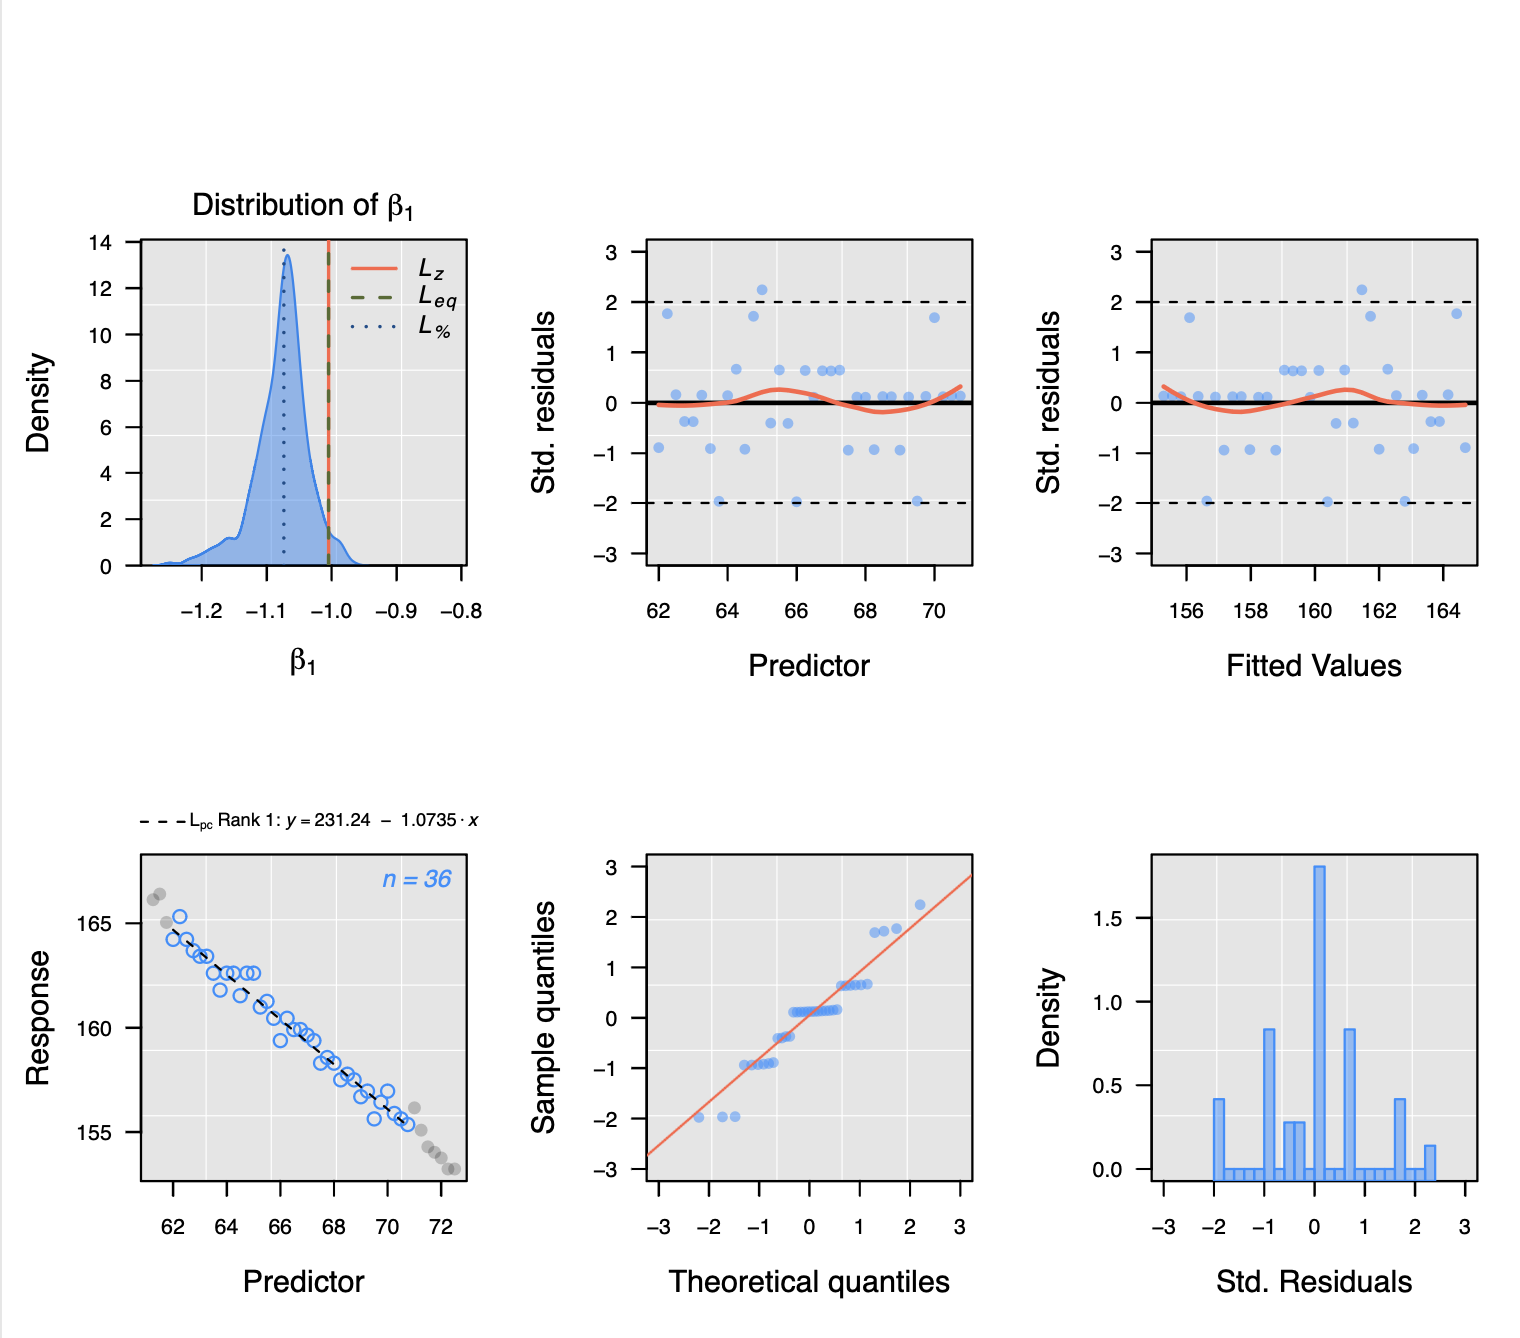
Light enhanced respiration is different by larval group. From the plot we can see that F2 NB had the lowest LER. LER in F2 NB was lower than F1 NB and F2 WT. There is no effect of temperature on LER. This could indicate that F2 NB corals have lower energy demand to survive in the same conditions as other groups. We will look at other metrics to interpret this difference.
Next I analyzed Rd (dark respiration):
model<-pr_data_calc%>%
  filter(Metric=="rd_inverse")%>%
  aov(Value~Group*Temperature, data=.)

summary(model)

TukeyHSD(model, "Temperature")

                   Df   Sum Sq   Mean Sq F value   Pr(>F)
Group               3 0.000161 0.0000536   0.500 0.683131
Temperature         2 0.001980 0.0009901   9.228 0.000201 ***
Group:Temperature   6 0.000609 0.0001015   0.946 0.465533
Residuals         107 0.011479 0.0001073

$Temperature
              diff         lwr          upr     p adj
33-27 -0.007115973 -0.01217964 -0.002052306 0.0032836
36-27 -0.011170387 -0.01794110 -0.004399677 0.0004547
36-33 -0.004054413 -0.01041079  0.002301967 0.2874958
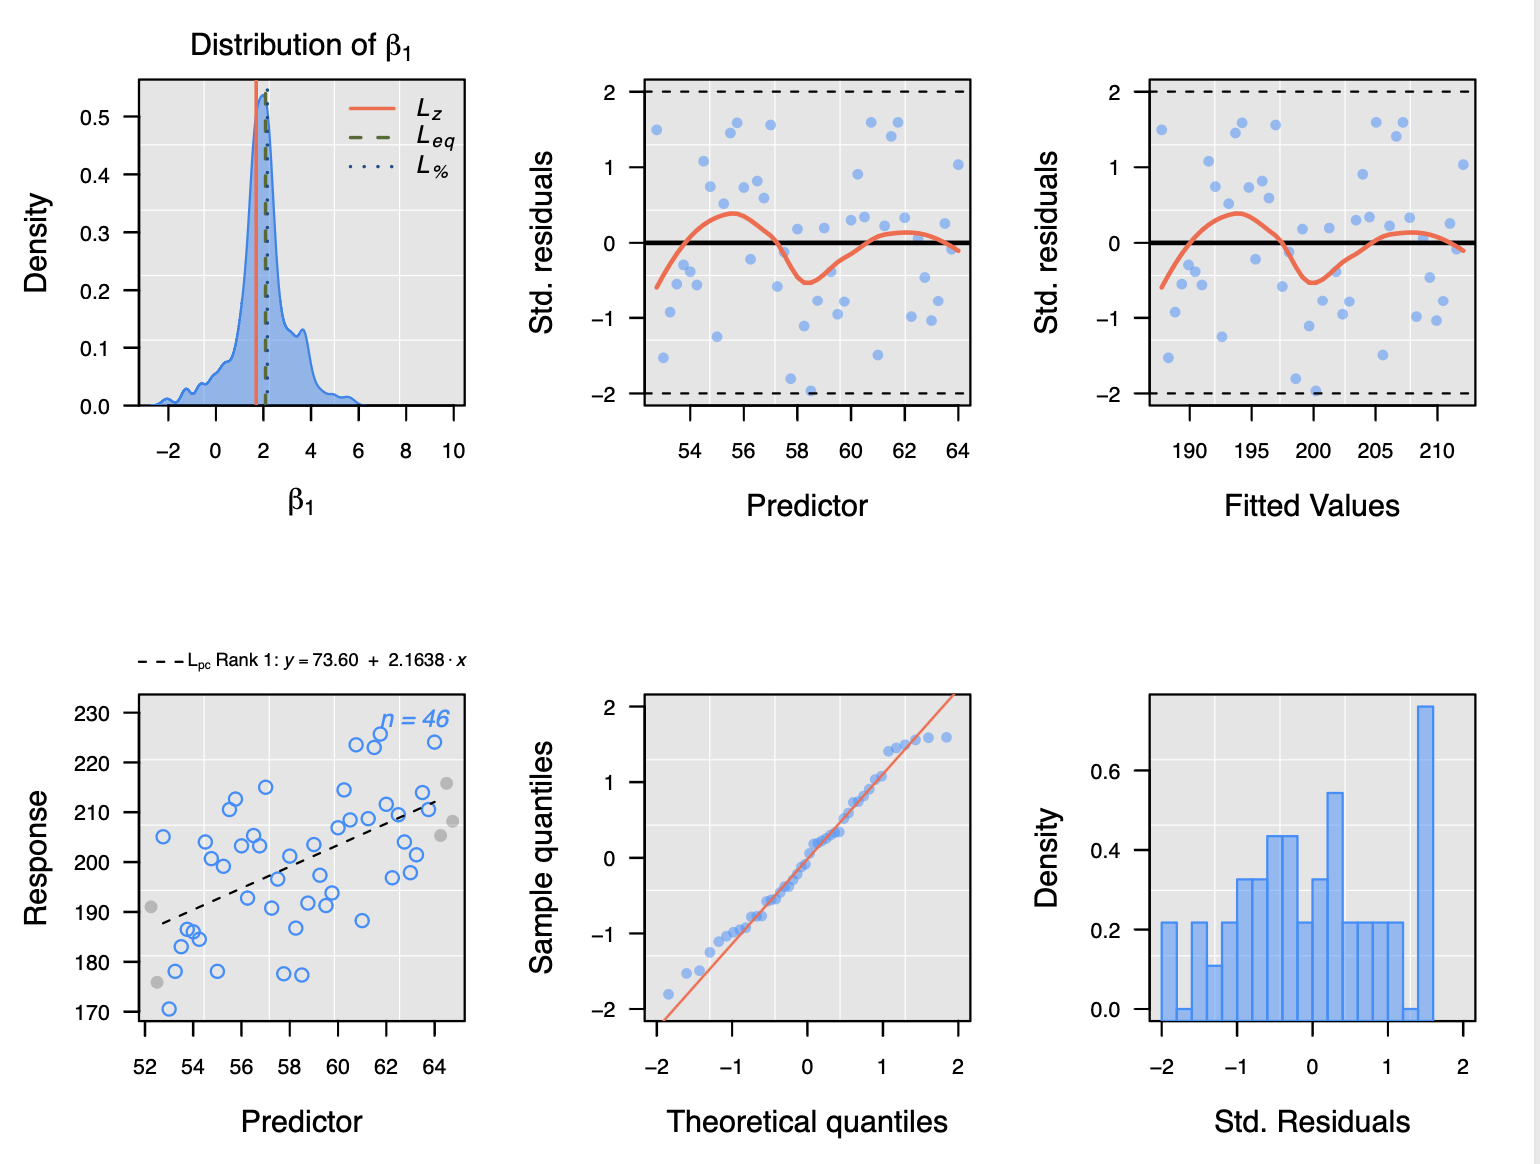
Dark respiration decreased with temperature where Rd was lower at 33 and 36 than at 27. This could indicate metabolic depression in larvae at elevated temperatures. This would make sense with the high temperatures we used for these measurements.
It is interesting that LER did not have the same decrease across temperature. This is an indication that stimulation of respiration by photosynthesis counteracts metabolic depression that happens at high temperature measured by Rd. There was no difference in dark respiration by larval group.
P net and P gross
I next looked at P net and P gross across light and temperature.
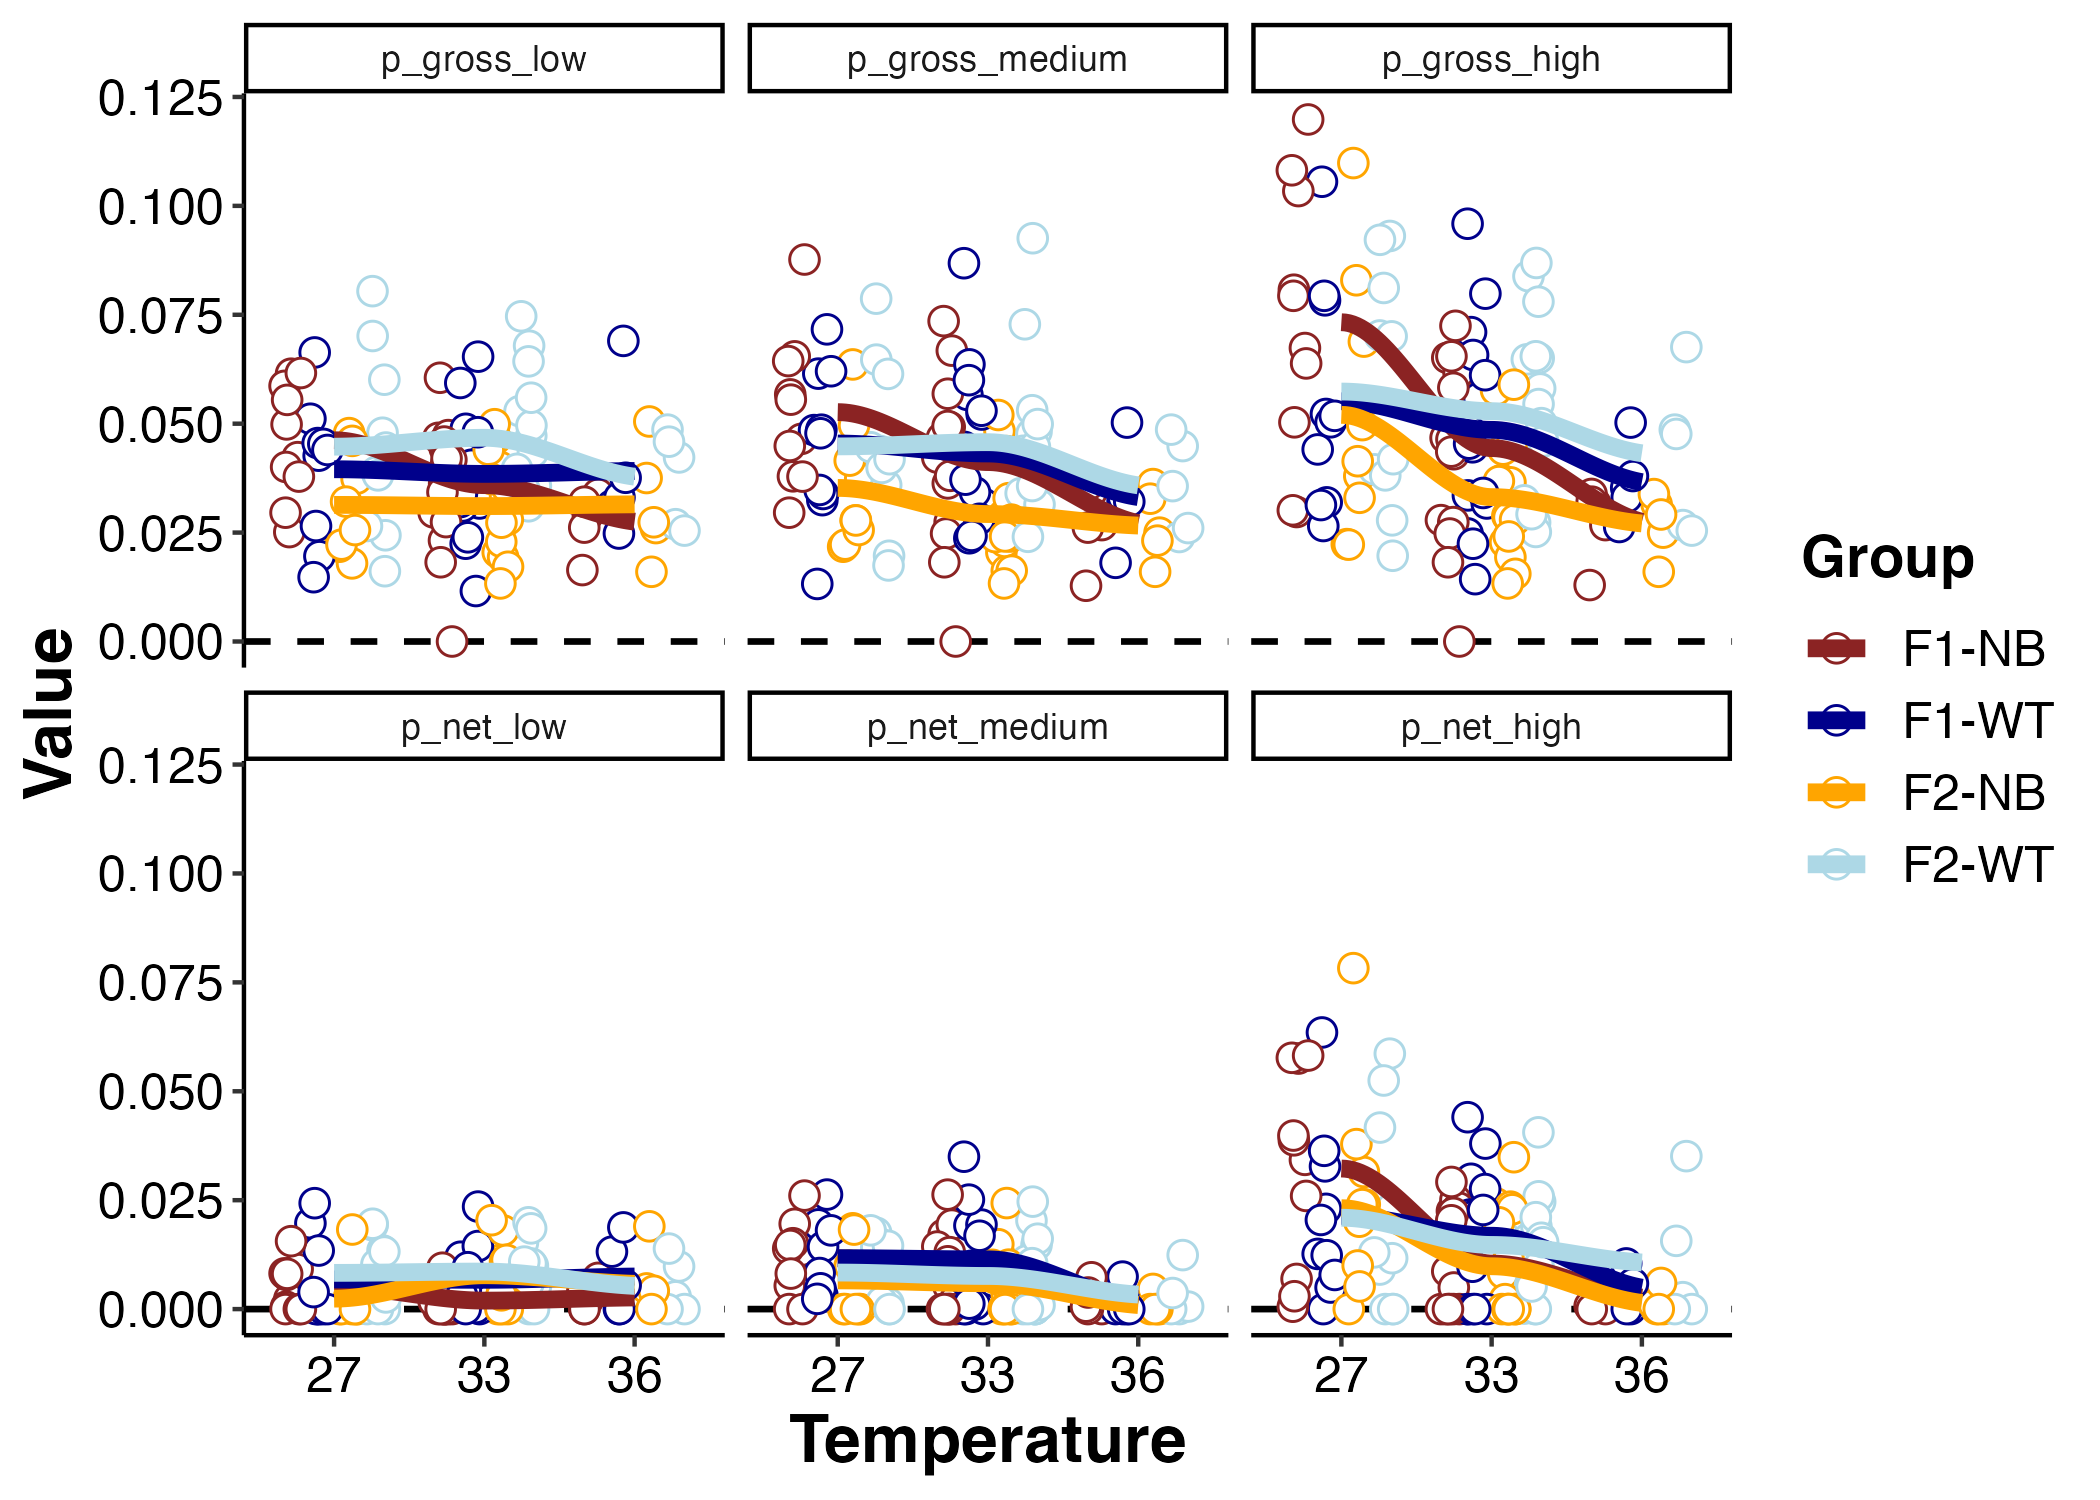
I used an ANOVA to analyze the effect of light (“Metric”), temperature, and group for P gross.
model<-pr_data_calc%>%
  filter(Metric %in% c("p_gross_low", "p_gross_medium", "p_gross_high"))%>%
  aov(Value~Metric*Temperature*Group, data=.)

summary(model)

                          Df  Sum Sq  Mean Sq F value   Pr(>F)
Metric                     2 0.00607 0.003037   9.499 9.84e-05 ***
Temperature                2 0.01025 0.005127  16.035 2.31e-07 ***
Group                      3 0.00892 0.002974   9.301 6.51e-06 ***
Metric:Temperature         4 0.00314 0.000784   2.453   0.0459 *
Metric:Group               6 0.00049 0.000081   0.253   0.9577
Temperature:Group          6 0.00418 0.000696   2.177   0.0450 *
Metric:Temperature:Group  12 0.00084 0.000070   0.218   0.9976
Residuals                319 0.10199 0.000320
There was a significant effect of light, temperature, group, light x temperature, and group x temperature on P gross - lots of interesting things are happening!
- P gross is higher as light increases.
- P gross decreases as temperature increases, but the effect of temperature is more pronouced at high light. At high light, P gross is more sensitive to temperature than at low light.
- Photosynthesis is lower in the F2 NB than the F1 NB and the F2 WT. This is interesting to note.
The lower P gross in the F2 NB aligns with what we saw in LER. LER was also lower in this group and this is likely due to decreased photosynthetic output and therefore less stimulation of respiration as compared to other groups. This may come with interesting metabolic trade offs between photosynthetic production and thermal tolerance.
I also analyzed P net.
model<-pr_data_calc%>%
  filter(Metric %in% c("p_net_low", "p_net_medium", "p_net_high"))%>%
  aov(Value~Metric*Temperature*Group, data=.)

summary(model)

                          Df  Sum Sq   Mean Sq F value   Pr(>F)
Metric                     2 0.00619 0.0030950  25.980 3.47e-11 ***
Temperature                2 0.00350 0.0017499  14.689 7.86e-07 ***
Group                      3 0.00050 0.0001658   1.392    0.245
Metric:Temperature         4 0.00314 0.0007841   6.582 4.21e-05 ***
Metric:Group               6 0.00047 0.0000780   0.655    0.686
Temperature:Group          6 0.00086 0.0001439   1.208    0.302
Metric:Temperature:Group  12 0.00088 0.0000730   0.612    0.832
Residuals                322 0.03836 0.0001191
There were significant effects of light and temperature on P net, but no effect of group. This shows that differences in photosynthesis are driven by respiration of the host because differences are seen in P gross but not P net.
P:R ratio
Finally, I looked at P:R ratios. Note that a P:R of 1 indicates that LER equals gross photosynthesis. A value of >1 indicates gross photosynthesis produces more oxygen than consumed through LER.
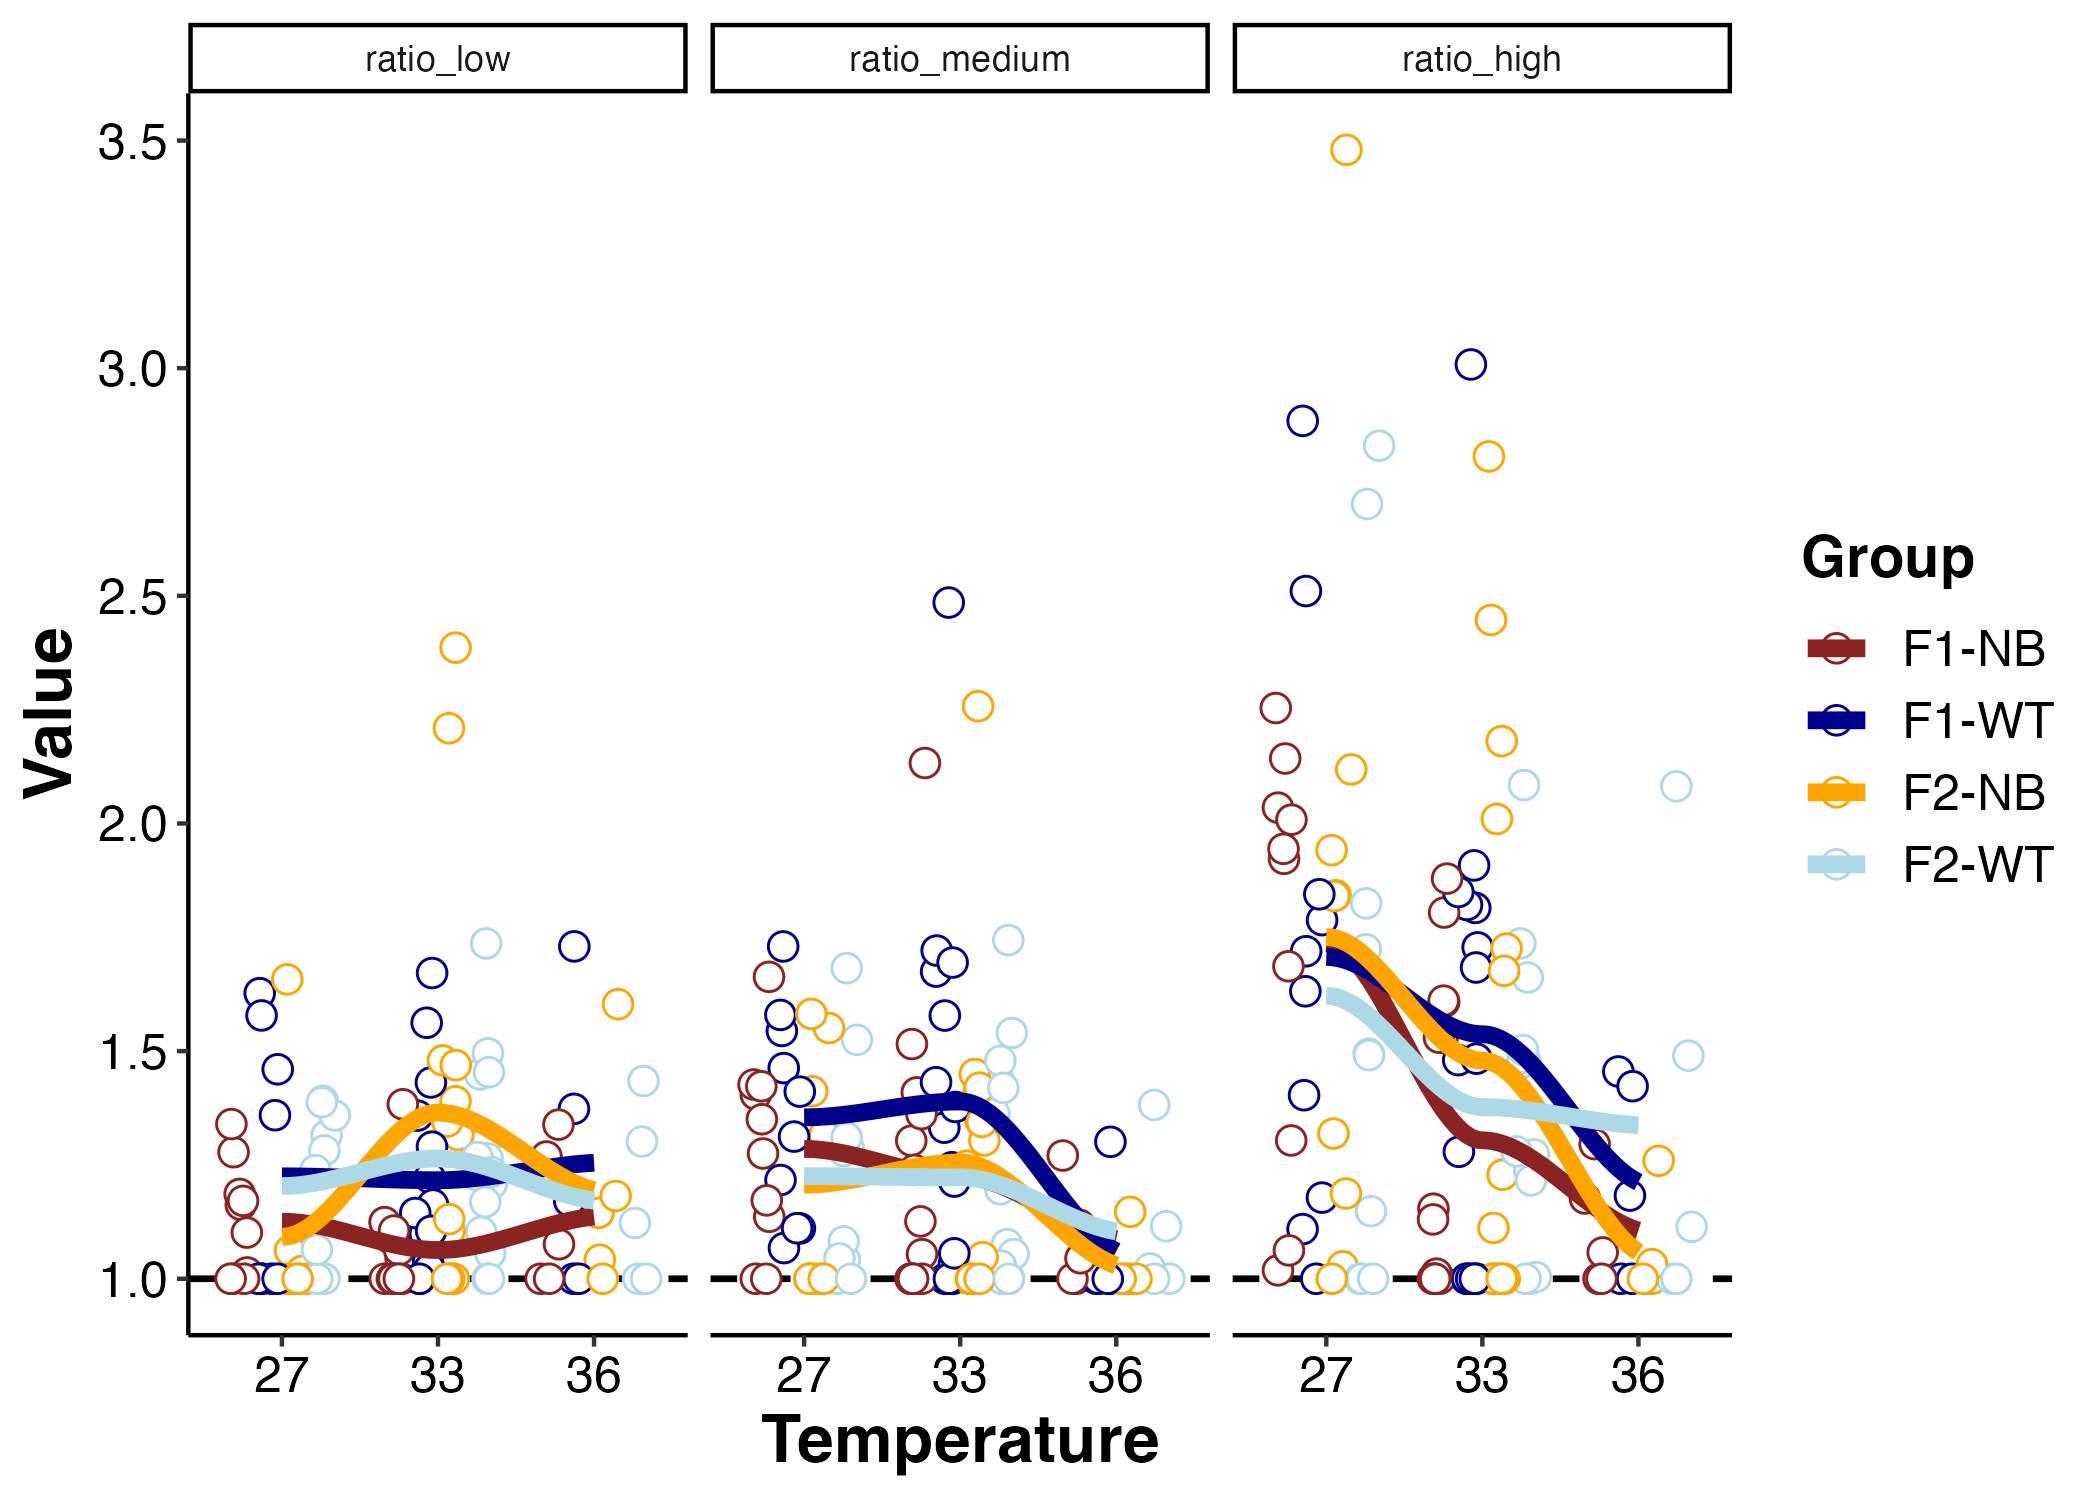
I used an ANOVA to test for effects of light (“Metric”), temperature, and group on P:R ratios.
model<-pr_data_calc%>%
  filter(Metric %in% c("ratio_low", "ratio_medium", "ratio_high"))%>%
  aov(Value~Metric*Temperature*Group, data=.)

summary(model)

                          Df Sum Sq Mean Sq F value   Pr(>F)
Metric                     2   5.21  2.6045  19.821 7.77e-09 ***
Temperature                2   2.18  1.0898   8.294 0.000309 ***
Group                      3   0.64  0.2119   1.613 0.186302
Metric:Temperature         4   2.51  0.6278   4.778 0.000935 ***
Metric:Group               6   0.35  0.0585   0.445 0.848073
Temperature:Group          6   0.54  0.0906   0.690 0.658264
Metric:Temperature:Group  12   0.54  0.0447   0.340 0.981119
Residuals                316  41.52  0.1314
There is an effect of light and temperature on P:R ratios, but no effect of group.
- P:R ratios increase as light increases. This makes sense as we know photosynthesis increases with light. P:R ratios are highest at high light in ambient conditions.
- P:R ratios are more sensitive to temperature effects at medium to high light than low light. Especially at high light - there is greater P:R ratio at ambient with a steep decline at 33 and 36°C. This also tracks what we saw with gross photosynthesis declining at elevated temperatures especially under high light.
- Because LER was unaffected by temperature, changes in P:R ratio are driven by changes in photosynthetic output.
Take Homes
There are several interesting take homes to explore further with this data.
- Light enhanced resipration was lower in the F2 NB group and P gross was lower in the F2 NB group. This demonstrates that metabolic rates are strongly driven by lower symbiont productivity in the F2 NB group as compared to other groups. This suggests that there may be metabolic trade offs between photosynthetic activity and thermal tolerance in these larvae.
- F2 NB corals maintained the same P:R ratios as other groups, indicating that even though symbiont productivity was lower, they are maintaining the same energy balance as other groups. This would suggest that the F2 NB experience energetic savings under ambient and stress conditions.
- These metrics were lower in F2 NB corals than the same generation of WT (F2 WT) and the previous generation of NB (F1 NB). This suggests that there is a generational effect of bleaching history on metabolic rates and may have interesting implications for selective breeding.
In order to fully understand the implications of these differences in metabolic rates, we need to consider phenotypic and performance information. Do the F2 NB larvae have higher or lower survivorship than other groups? Do they experience differences in growth or energy content? Do they have greater thermal tolerance? This information is critical to determine whether the differences in metabolic rates outlined here are due to energetic savings and advantageous metabolic strategies or are a signal of metabolic dysfunction.
Next Steps
The next step in this project is to determine what data is of interest to include in the project manuscript and to interpret in the context of phenotypic or performance metrics.