


Hawaii 2023 Coral Spawning and Field Expedition Daily Entry
This post includes the full notebook for June-July 2023 Montipora capitata coral spawning and field expedition in Hawaii at the Hawaii Institute of Marine Biology. These notebook posts by A. Huffmyer are updated in order of most recent to oldest.
Field expedition team members: Jill Ashey (URI), Jennifer Matthews (UT Sydney), Andrei Herdean (UT Sydney), Crawford Drury and Coral Resilience Lab (HIMB).
The GitHub repository for this project can be found here.
Project Overview
The goal of this field expedition is to conduct research on larval thermal tolerance in Montipora capitata larvae hosting different symbiont genera. M. capitata is a vertically transmitting coral and passes symbionts to offspring through the gametes. This work is funded in part through the National Science Foundation Ocean Sciences Postdoctoral Fellowship to AH and the University of Washington eScience Data Science Postdoctoral Fellowship to AH. More information on the abstract of the NSF OCE PRF award can be found here.
Below is a visual overview of our project:
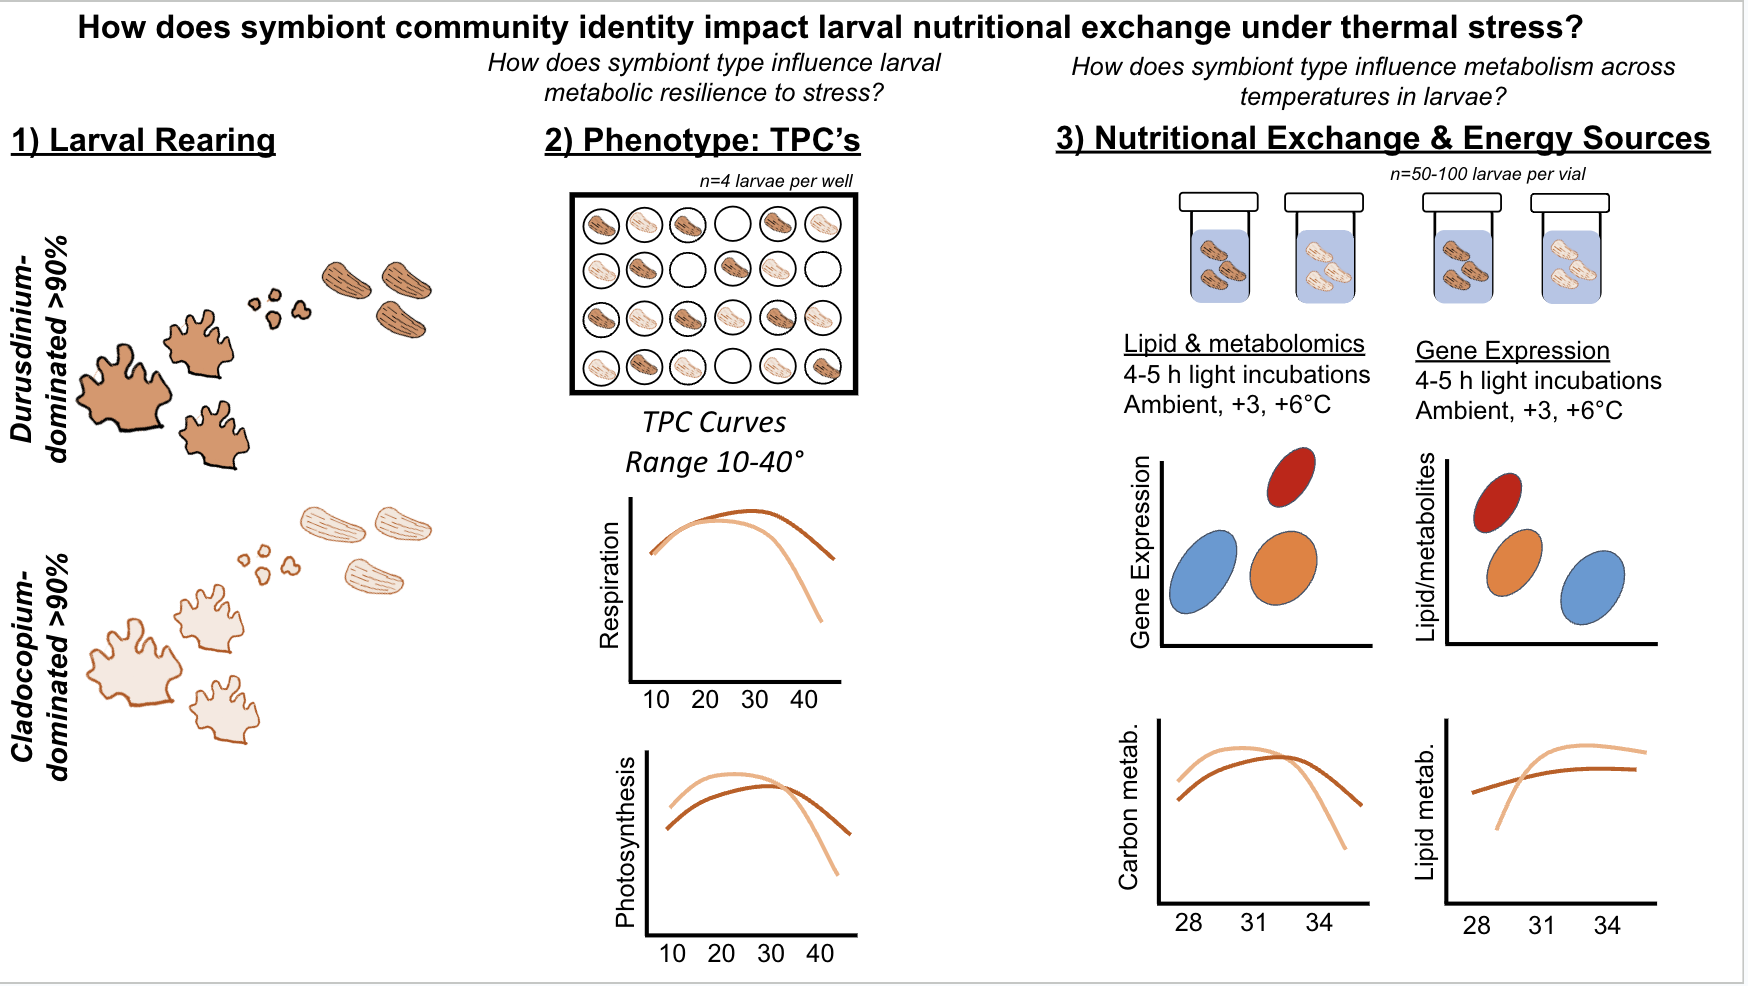
The goal for this expedition is to answer the following question - How does symbiont community identity impact thermal tolerance and larval energy usage under stress?
We will address this question by measuring:
- Larval photosynthesis-irradiance curves and photophysiology
- Larval thermal performance curves: respiration and photophysiology
- Larval gene expression
- Larval lipidomics
- Larval metabolomics
30 June 2023
Inventory and packing
Ariana and Jill worked on inventory and packing today and cleaning the upstairs inventory area. Everything is complete for the field season!!
29 June 2023
Inventory and packing
Ariana and Jill worked on inventory and packing today. We completed a master sample inventory and manifest and prepared boxes for shipment. The master sample list can be found on GitHub here. We will continue to track location of these boxes once they reach URI.
28 June 2023
Settlement trails
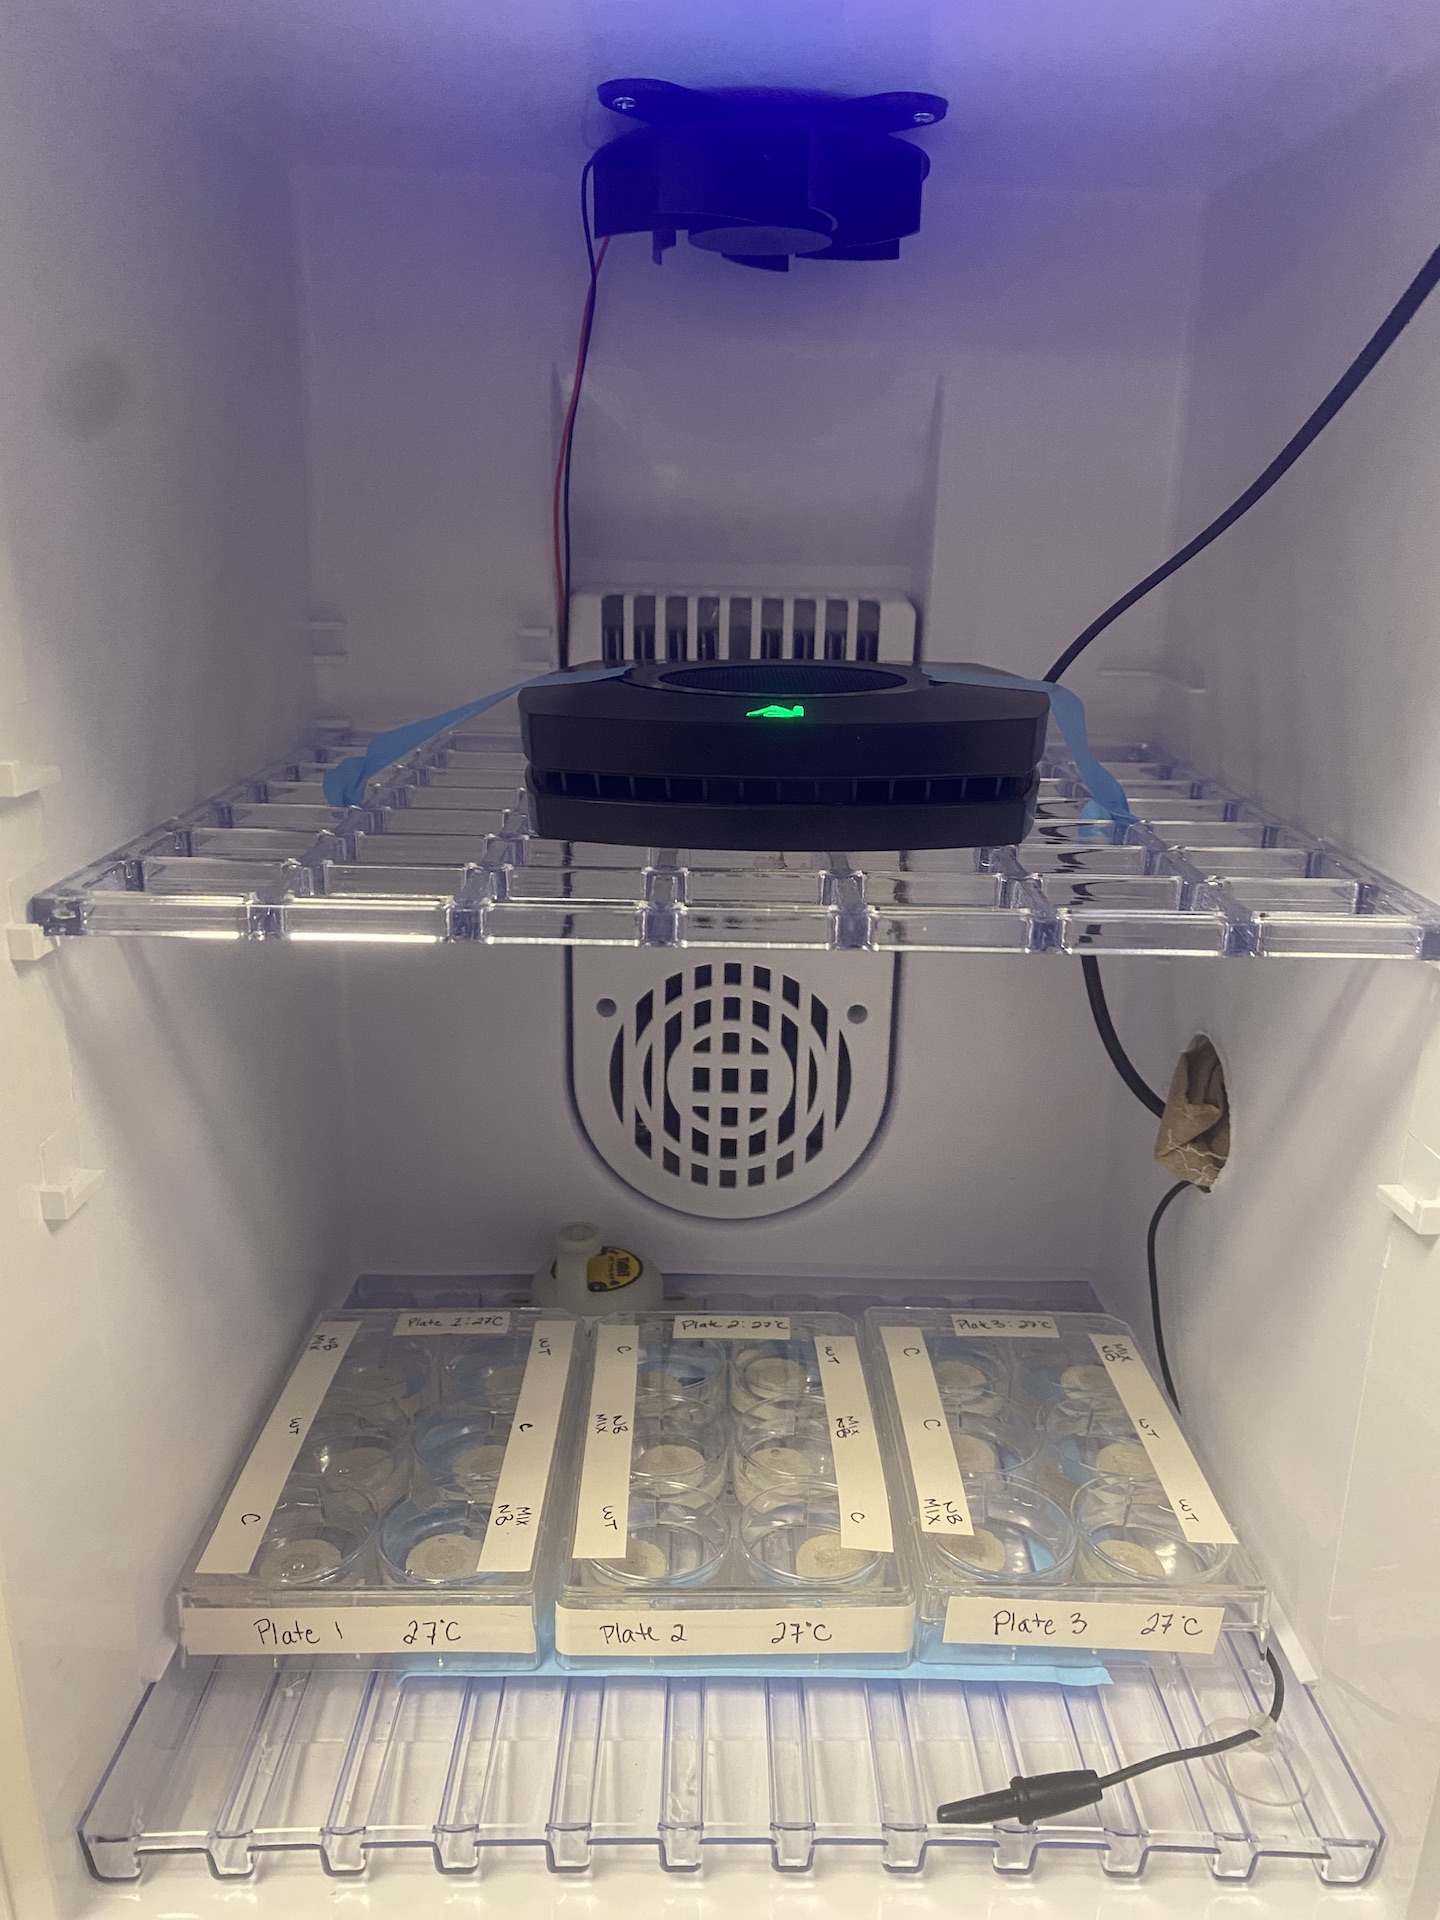
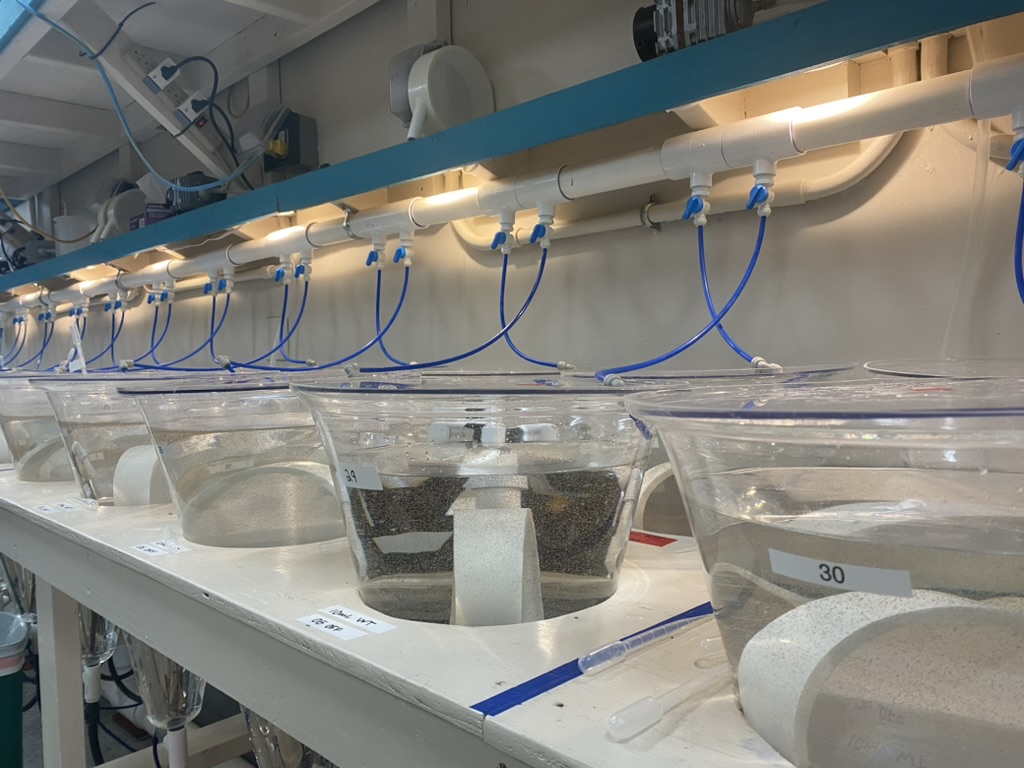
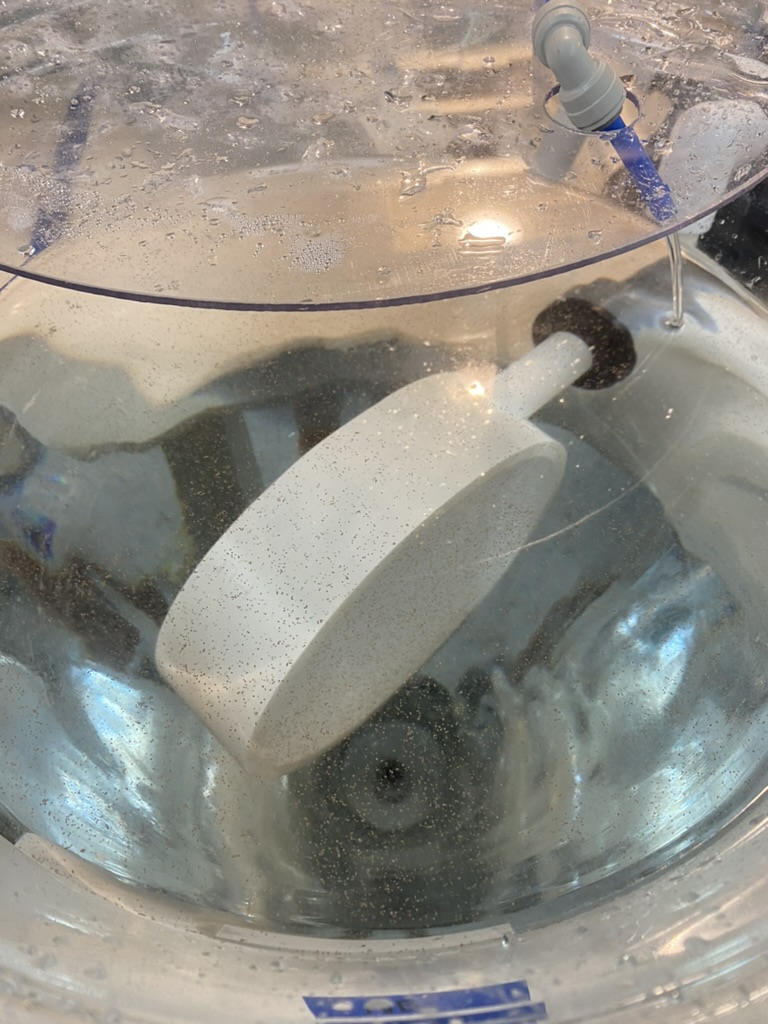
Ariana started settlement trials for each symbiont type by putting n=20 larvae per type into 6 well plates (n=2 wells per type per plate; n=6 total plates) with type distributed randomly throughout each plate. Each well had 1 aragonite plug (no stem, just the puck) that was pre rinsed in FSW. Wells were filled with 1 µM FSW. Three of the plates were loaded into one incubator at ambient (27C) and the other three loaded at high temperature (33C). Lights in both incubators were set at a medium light of 100 PAR.
However, the next morning the larvae were dead and the trials were not completed. In the future we will need to use flow through systems for settlement.
Cleaning tanks
Incubation tanks were cleaned and equipment was packed.
Cleaning larval conicals
All conicals were drained and any leftover larvae of C and MIX types were consolidated into one conical each for the CRL to use. All wildtype were used in our experiments.
Logger read outs
Loggers were read out, downloaded, and analyzed. Data is on GitHub here and figures produced are here.
27 June 2023
Rearing larvae
Conicals were stirred and checked throughout the day, everything looks good!
Environmental measurements
Jill took daily measurements.
| Date | Time | Tank | Temp | pH.mV | pH.nbs | flow | par |
|---|---|---|---|---|---|---|---|
| 20230627 | 9:00 | C1 | 26.26 | -48.9 | 8.01 | 23 | 5 |
| 20230627 | 9:01 | C2 | 26.23 | -49.4 | 8.02 | 23 | 5 |
| 20230627 | 9:02 | MIX1 | 26.21 | -49.5 | 8.02 | 20 | 5 |
| 20230627 | 9:03 | MIX2 | 26.23 | -49.5 | 8.02 | 23 | 6 |
| 20230627 | 9:04 | WT1 | 26.31 | -49.2 | 8.01 | 23 | 7 |
| 20230627 | 9:05 | WT2 | 26.29 | 49.3 | 8.01 | 25 | 5 |
ITS2 and cell density sampling
ITS2 and cell density samples were collected from the cool phenoplate run. Samples were collected between 11:50 and 19:00. Sample metadata can be found here and here.
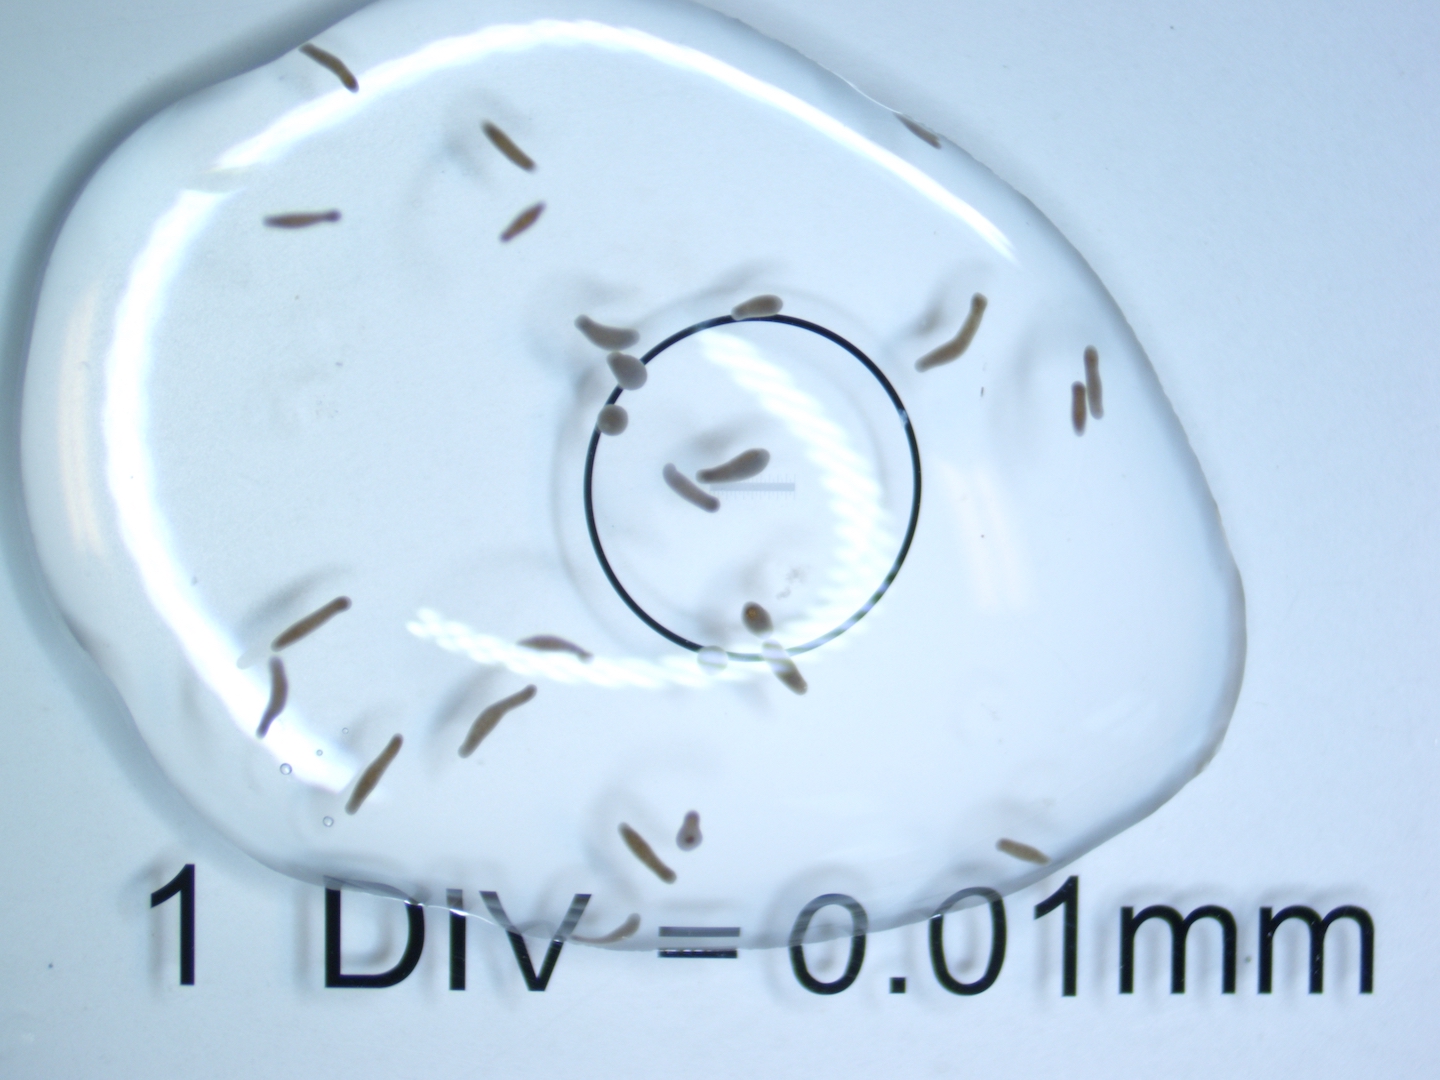
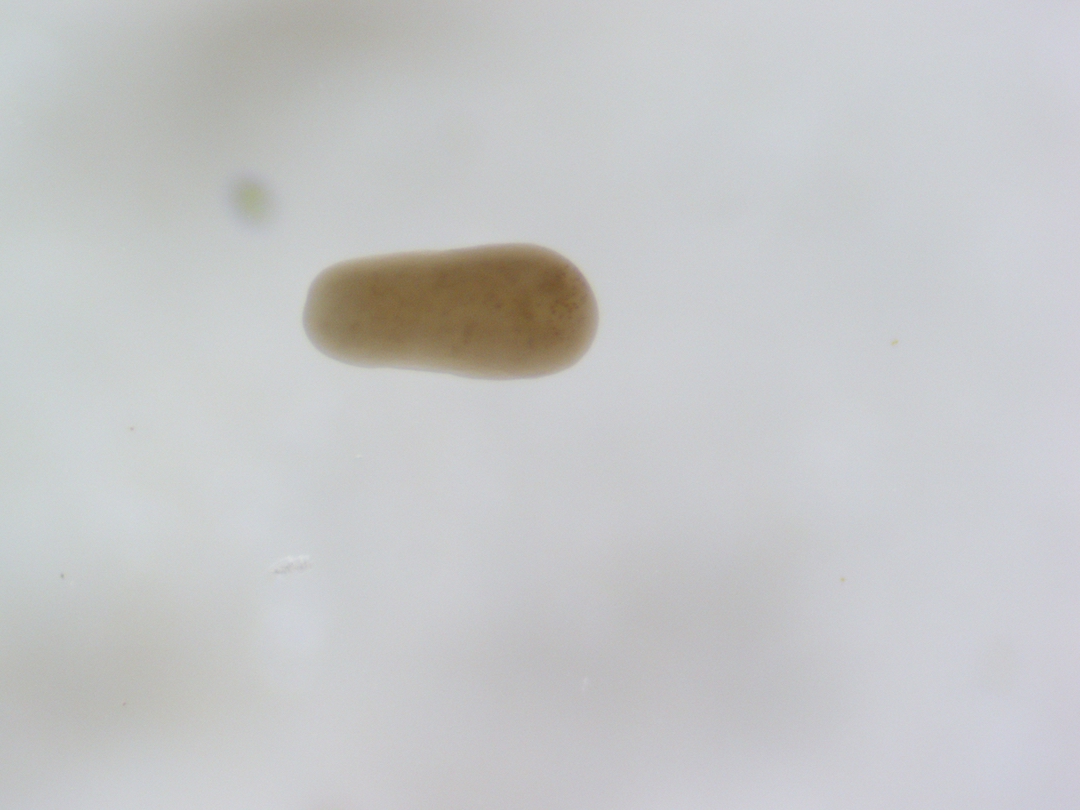
Pictures of larvae
Ariana took photos of larvae under the scope for reference. Here are some example photos. Notice how many larvae are elongated as expected by competent larvae exhibiting benthic swimming behavior.

Photophysiology and phenoplate measurements
Jen ran phenoplate measurements on larval groups all day today. We will have fluorescence and oxygen data from light and temperature profiles. Metadata and notes are recorded in Jen’s notebook.
Larval incubations
Larval incubations were run using the same protocols as on 24 June 2023 below. Incubations were run for exactly 4 h prior to sampling. Vials were stirred and rearranged at 11:15 and 14:00. Ariana loaded one blank vial into each tank to test temperatures inside the vials. Loading started at 08:25 and ended at 10:52. Symbiont groups were loaded in a different order than on 24 June 2023. Apex probes were calibrated at 07:40. Sampling occurred between 12:25 and 14:52.
MALDI samples were collected after incubations in an additional set of vials incubated for 4 h. Metadata for MALDI samples can be found on GitHub here. Jen gave Ariana CMC to use for future MALDI sampling. To do this, add 1 mL of CMC to a tube with 20 larvae. Remove the water before adding CMC. Gently rock and then snap freeze and store at -80C.
We monitored environmental conditions during the incubations.
| Date | Tank | Time | PAR1 | PAR2 | PAR3 | PAR4 | PAR5 | Mean PAR | Temp.C |
|---|---|---|---|---|---|---|---|---|---|
| 20230627 | 1 | 830 | 570 | 528 | 517 | 460 | 468 | 508.6 | 27.28 |
| 20230627 | 2 | 830 | 563 | 485 | 475 | 500 | 516 | 507.8 | 30.45 |
| 20230627 | 3 | 830 | 523 | 513 | 506 | 421 | 450 | 482.6 | 32.48 |
| 20230627 | 1 | 1006 | 576 | 483 | 537 | 502 | 472 | 514 | 27.05 |
| 20230627 | 2 | 1006 | 580 | 527 | 522 | 524 | 527 | 536 | 30.45 |
| 20230627 | 3 | 1006 | 523 | 537 | 538 | 508 | 503 | 521.8 | 32.84 |
| 20230627 | 1 | 1115 | 500 | 480 | 515 | 530 | 499 | 504.8 | 27.55 |
| 20230627 | 2 | 1115 | 555 | 510 | 475 | 420 | 518 | 495.6 | 30.45 |
| 20230627 | 3 | 1115 | 523 | 500 | 501 | 480 | 495 | 499.8 | 32.71 |
After incubations, Ariana estimated that we have ~15,000 WT larvae. Jen will use the remainder for phenoplate measurements.
F1/F2 project
We did one more run of F1/F2 NB and WT larvae for CRL today. We did one run 36C using the same protocol. The run was Run 3, plates 5 and 6.
26 June 2023
Rearing larvae
Conicals were stirred and checked throughout the day, everything looks good!
Environmental measurements
Ariana took daily measurements.
| Date | Time | Tank | Temp | pH.mV | pH.nbs | flow | par |
|---|---|---|---|---|---|---|---|
| 20230626 | 1820 | C1 | 26.73 | -49.3 | 8.02 | 19 | 0 |
| 20230626 | 1821 | C2 | 26.71 | -49.1 | 8.01 | 18 | 0 |
| 20230626 | 1822 | MIX1 | 26.78 | -48.3 | 8 | 20 | 0 |
| 20230626 | 1823 | MIX2 | 26.76 | -49.2 | 8.02 | 19 | 0 |
| 20230626 | 1824 | WT1 | 26.68 | -49.5 | 8.02 | 21 | 0 |
| 20230626 | 1825 | WT2 | 26.73 | -49.2 | 8.01 | 20 | 0 |
P and R runs
Today we ran temp x PI curves to measure respiration and photosynthesis using the protocol from our F1/F2 measurements. All SDR measurements are based on the Putnam Lab SDR protocol on GitHub here.
We will first dark adapt larvae in incubators and then expose them to 0 PAR (dark respiration), 50 PAR (low light photosynthesis), 100 PAR (medium light photosynthesis), and 500 PAR (high light photosynthesis), followed by another measurement at 0 PAR for light-enhanced respiration. This will provide us with the ability to capture dark respiration, light enhanced respiration, and photosynthesis across light levels. We will calculate gross photosynthesis and P:R ratios as well.
We dark adapted larvae for 15 minutes in falcon tubes in the incubators at 27C. Larvae were then counted onto loading plates and put back in the incubator to dark adapt for 10 more minutes.
We conducted measuremetns in 4 runs (8 plates) with one run at 27 (Run 3, plate 5 & 6), 30 (Run 1, plate 1 & 2), 33 (Run 4, plate 7 & 8), and 36C (Run 2, plate 3 & 4).
Run metadata and sample metadata is on GitHub along with data files.
Runs were conducted between 9:24 and 19:30 today.
Scripts to extract rates are on GitHub here and scripts to analyze are here. Figures produced can be seen here.
Overall, this provides an effective protocol to gather many metabolic metrics and can be used to calculate PI curves at multiple temperatures.
ITS2 and cell density sampling
ITS2 and cell density samples were collected from the larval pool. Samples were collected between 16:00 and 16:30. Sample metadata can be found here and here.
25 June 2023
Rearing larvae
All conicals were cleaned at 09:00. Cleaning was done by mixing the larvae and wiping the edges with a kimwipe to remove any settlers to dead material. Cultures looked good today.
Environmental measurements
Ariana took daily measurements.
| Date | Time | Tank | Temp | pH.mV | pH.nbs | flow | par |
|---|---|---|---|---|---|---|---|
| 20230625 | 1930 | C1 | 26.71 | -49.1 | 8 | 15 | 0 |
| 20230625 | 1931 | C2 | 26.6 | -50.6 | 8.04 | 17 | 0 |
| 20230625 | 1932 | MIX1 | 26.59 | -49.4 | 8.01 | 16 | 0 |
| 20230625 | 1933 | MIX2 | 26.63 | -50.6 | 8.04 | 15 | 0 |
| 20230625 | 1934 | WT1 | 26.61 | -50.2 | 8.03 | 17 | 0 |
| 20230625 | 1935 | WT2 | 26.69 | -50.1 | 8.04 | 15 | 0 |
F1/F2 project
The Coral Resilience lab successfully collected spawn and fertilized gametes from parents (F1 WT) of non-bleached corals and wildtype adults (F1 WT) as well as 5-year-old WT (F2 WT) and NB offspring (F2 NB). They are monitoring survival and settlement of these corals and we are collaborating with them to measure metabolic rates of these four groups.
Today we ran P and R measurements across a temperature x PI curve profile. We will first dark adapt larvae in incubators and then expose them to 0 PAR (dark respiration), 50 PAR (low light photosynthesis), 100 PAR (medium light photosynthesis), and 500 PAR (high light photosynthesis), followed by another measurement at 0 PAR for light-enhanced respiration. We will do one set of measurements at ambient (27C) and another at elevated temperature (30C). This will provide us with the ability to capture dark respiration, light enhanced respiration, and photosynthesis across light levels. We will calculate gross photosynthesis and P:R ratios as well.
We dark adapted larvae for 15 minutes in falcon tubes in the incubators at 27C. Larvae were then counted onto loading plates and put back in the incubator to dark adapt for 10 more minutes.
The measurements looked great! Here is an example of the oxygen data from this run. You can clearly see the respiration and light phases.
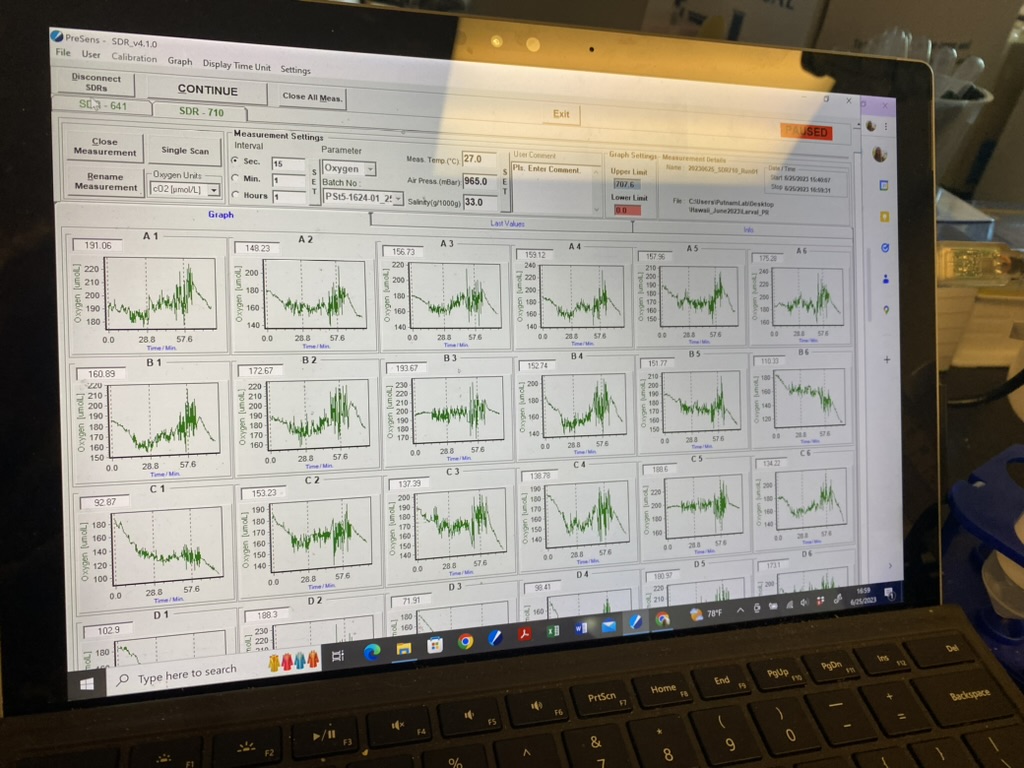
Data and metadata can be found on GitHub here.
Data analysis and figures can be found on GitHub here and scripts can be found here for rate extraction and rate analysis here.
All plates were calibrated with 100% air saturated FSW before each run at the respective temperature.
Preparing for next round of measurements
We labeled vials and prepared tanks for the next round of incubations that will start on June 27th. We also prepared the SDR and plate maps for the next round of P and R measurements that will start on June 26th (tomorrow). We will use a temperature PI curve approach for tomorrow as we did for the F1/F2 project today.
24 June 2023
Rearing larvae
We checked larvae today and the cultures are looking good, densities are remaining high. Conical C1 was cleaned at 20:00. There were a mat of settlers on the conical that died and needed to be cleaned. The conical was drained through a 153 µM seive. The conical was wiped clean, refilled with FSW and the larvae were added back in.
Environmental measurements
Ariana took daily measurements in the conical tanks.
| Date | Time | Tank | Temp | pH.mV | pH.nbs | flow | par |
|---|---|---|---|---|---|---|---|
| 20230624 | 1938 | C1 | 26.91 | -50.1 | 8.03 | 17 | 0 |
| 20230624 | 1939 | C2 | 26.98 | -50.2 | 8.03 | 16 | 0 |
| 20230624 | 1940 | MIX1 | 27.01 | -50.1 | 8.03 | 18 | 0 |
| 20230624 | 1941 | MIX2 | 26.95 | -50.4 | 8.04 | 17 | 0 |
| 20230624 | 1942 | WT1 | 26.89 | -50.6 | 8.04 | 16 | 0 |
| 20230624 | 1943 | WT2 | 27 | -50.4 | 8.04 | 16 | 0 |
P and R runs
We ran photosynthesis and respiration measurements today. For each run, we ran photosynthesis measurements at 100 PAR for ~15-20 minutes, then measurements at 500 PAR for ~15-20 minutes, followed by dark measurements with the lights off for ~10-15 minutes. This captures photosynthesis at low and high light levels as well as light-enhanced respiration. We will run these measurements at 27, 30, and 33°C to mirror the temperature treatments for our incubations.
Run information for these plates can be found on GitHub here and sample well information can be found on GitHub here.
We ran 3 runs with 6 total plates from 10:00-16:00.
| Run | Plate | Temperature |
|---|---|---|
| 1 | 1 | 27 |
| 1 | 2 | 27 |
| 2 | 3 | 33 |
| 2 | 4 | 33 |
| 3 | 5 | 30 |
| 3 | 6 | 30 |
In run 1, the lights were first turned to 500 before we decided to add a low light measurements. Lights were turned off, held in the dark for 2 minutes, then returned to 100 PAR. Remove the first 6 minutes of this run.
Data were downloaded to Drive and GitHub here.
Larval incubations
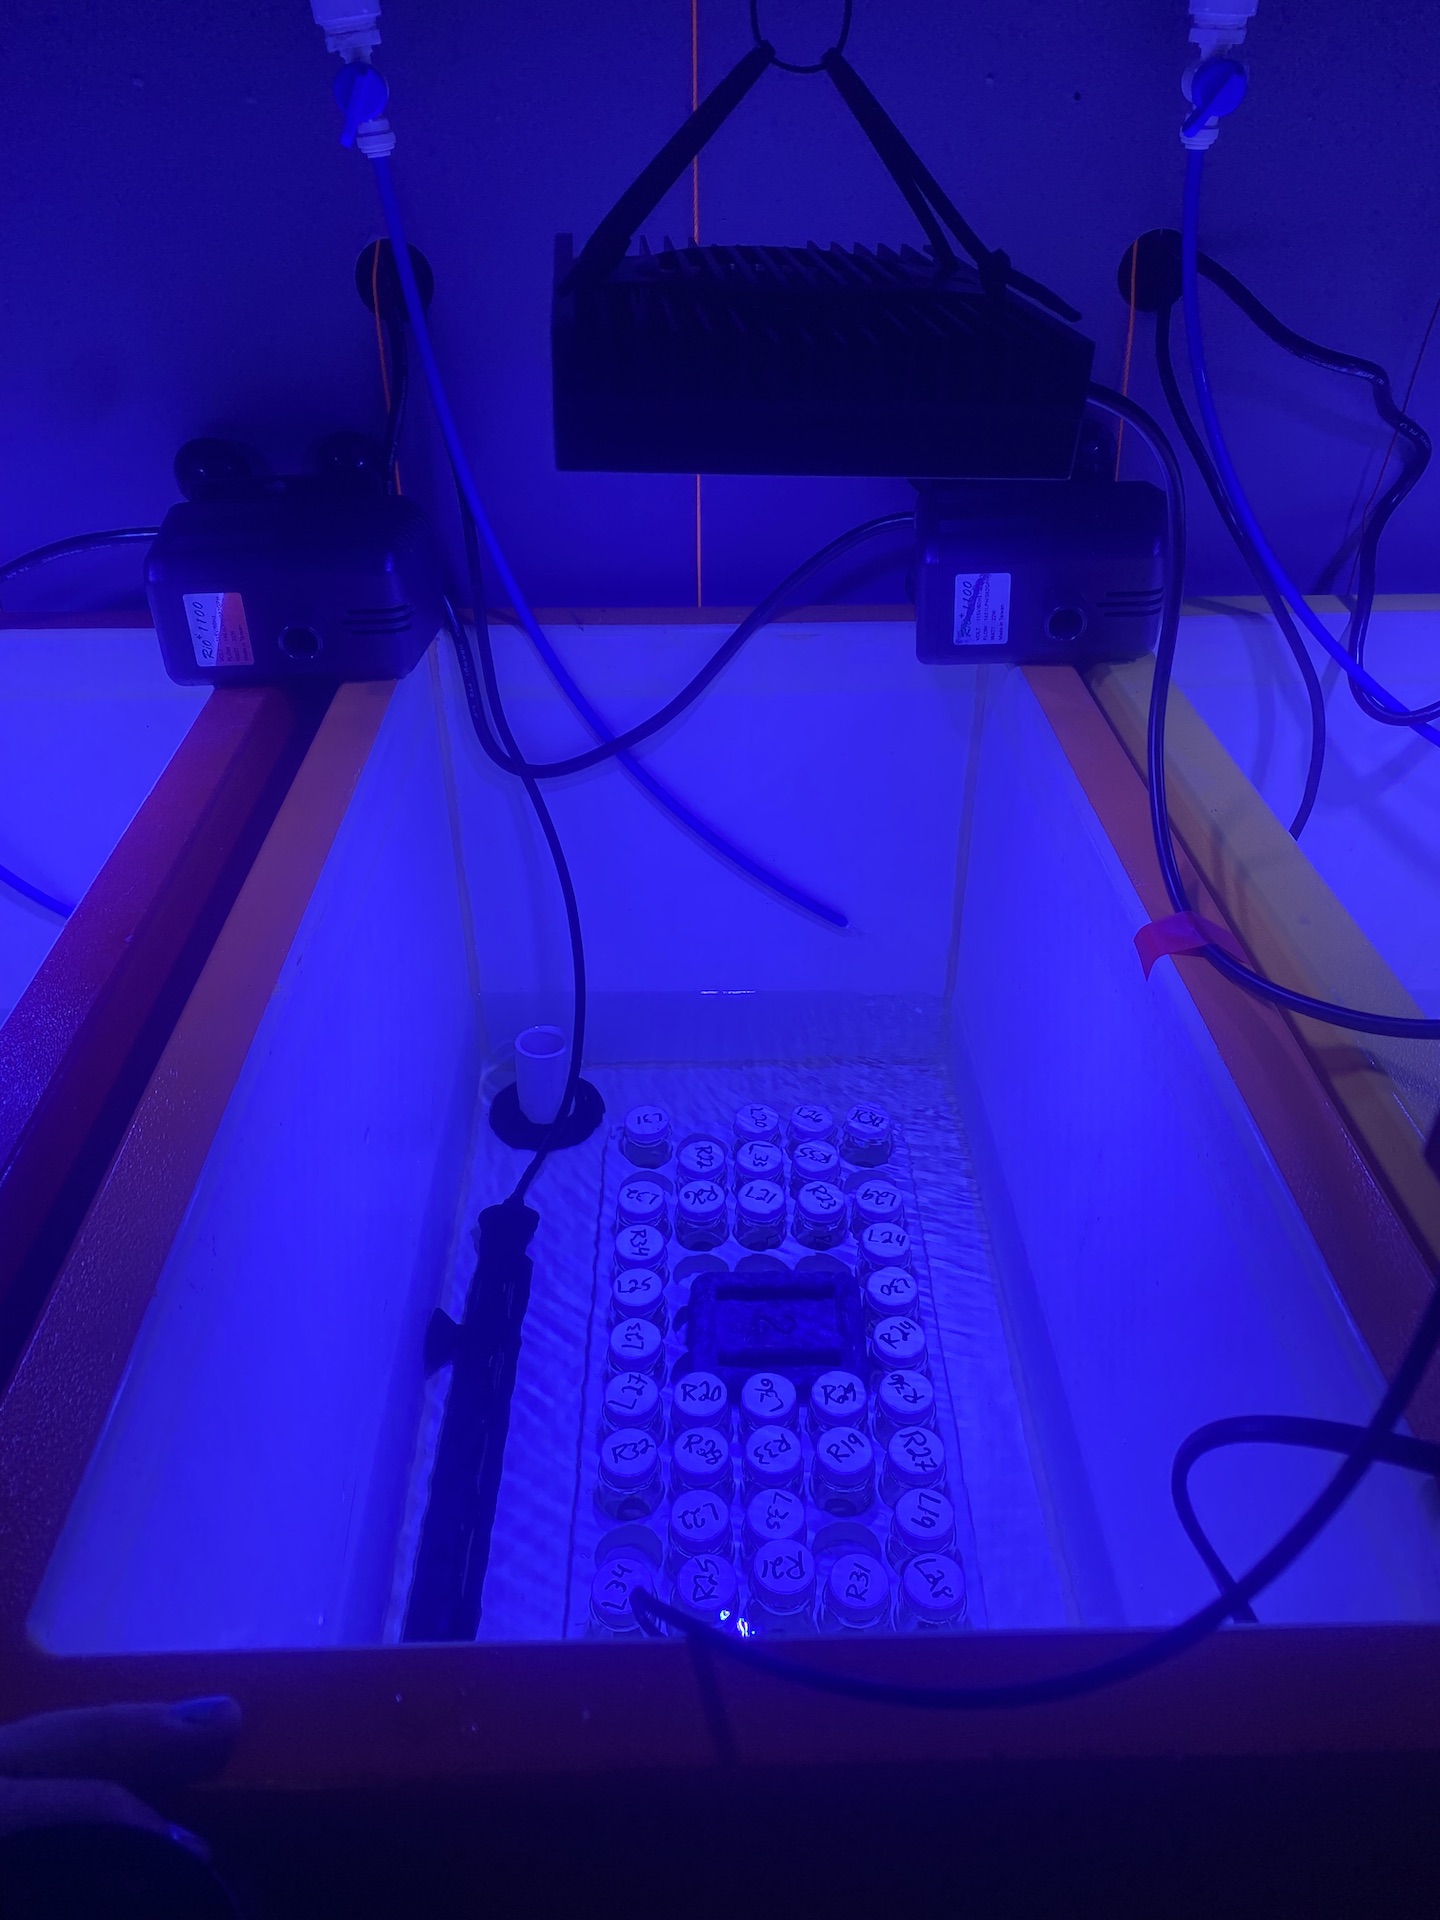
We set up lights in the tanks in the morning and calibrated the Apex temperature probes at 09:07 prior to the start of incubations. Light was measured in the center and each of the four corners of the vial racks in the tank at the level of the vials. We are targeting 500 PAR light levels based on previous PI curve measurements that show saturating irradiance for mixed symbiont larvae around 500-600 PAR. This is to achieve saturating irradiance during the incubations.
We measured light in each tank at 5 positions in the tank. Light target was achieved at 95% intensity on all AI light channels with UV and moonlight set at 0%. Lights were 50 cm above the surface of the vials and the water level was 21.5 cm deep. The vials were about ~3 cm from the surface of the water.
The tanks act as a water bath for temperature for the incubations.
| Tank | Location | Treatment | PAR |
|---|---|---|---|
| 1 | 1 | Ambient (27) | 530 |
| 1 | 2 | Ambient (27) | 539 |
| 1 | 3 | Ambient (27) | 530 |
| 1 | 4 | Ambient (27) | 447 |
| 1 | 5 | Ambient (27) | 502 |
| 2 | 1 | Moderate (30) | 539 |
| 2 | 2 | Moderate (30) | 542 |
| 2 | 3 | Moderate (30) | 530 |
| 2 | 4 | Moderate (30) | 495 |
| 2 | 5 | Moderate (30) | 473 |
| 3 | 1 | High (31) | 521 |
| 3 | 2 | High (31) | 516 |
| 3 | 3 | High (31) | 518 |
| 3 | 4 | High (31) | 448 |
| 3 | 5 | High (31) | 473 |
Temperatures were stable using the Apex system at the target treatments.
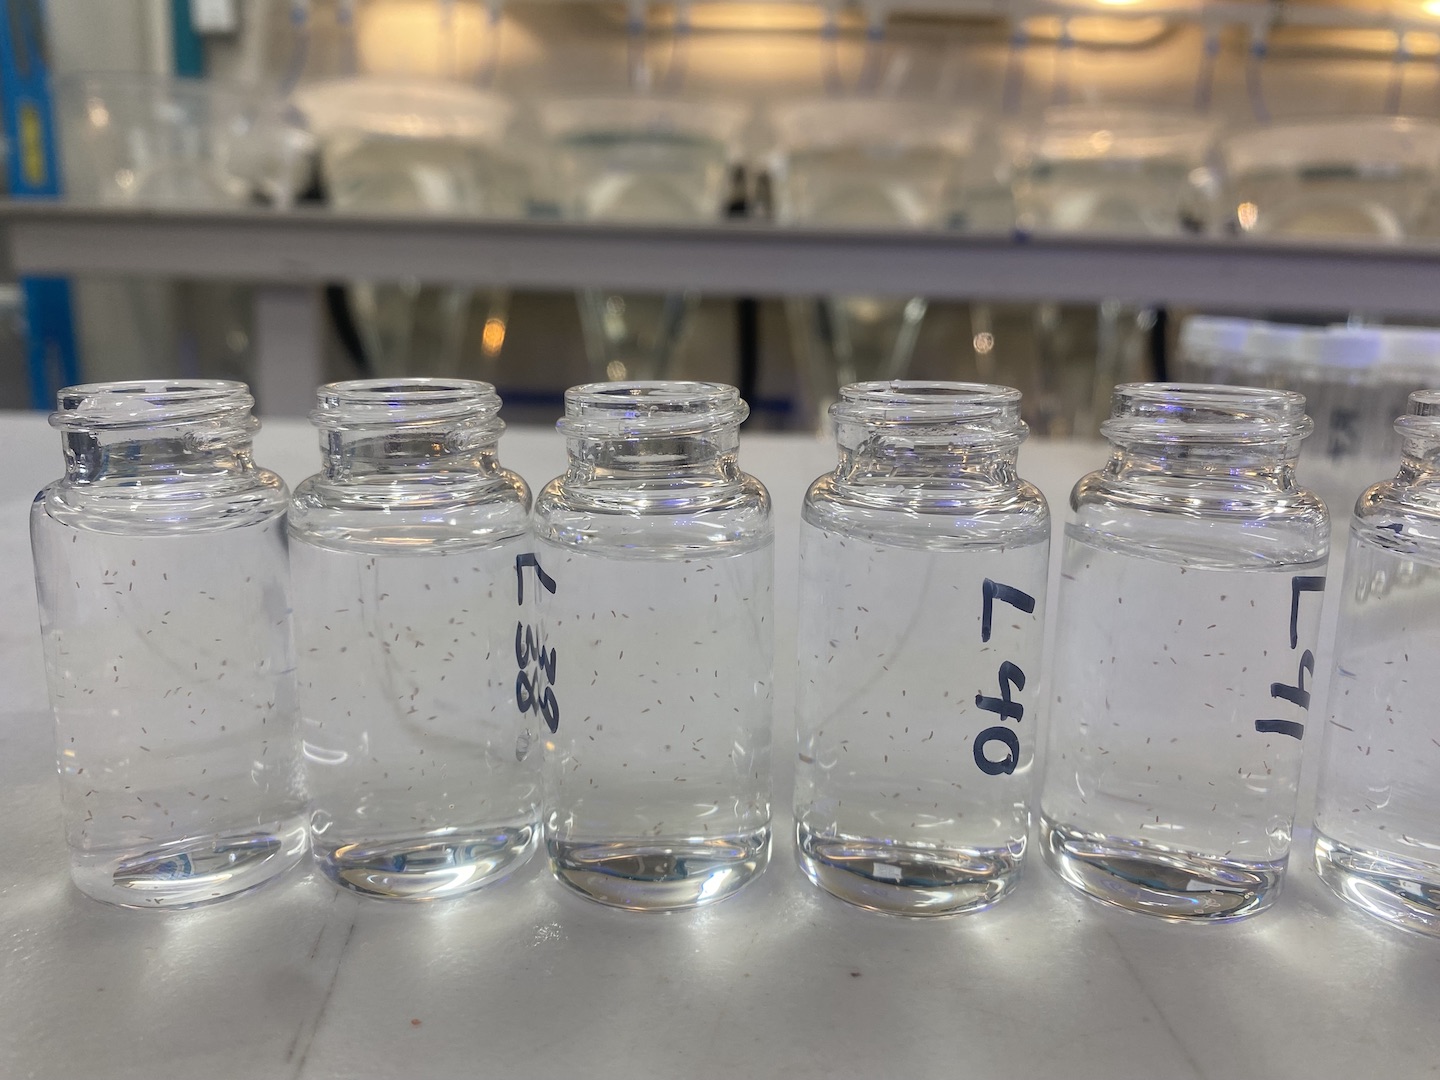
Incubations were run by adding larvae using concentration estimates to each vial and staggered in start times in groups of 6 vials by 6-10 minutes. This will stagger the end sampling times to make it achievable to give all vials exactly 4 hours of incubation time.
We used 20 mL scintillation vials for these incubations labeled with R## or L##. R vials are for RNA sampling and L vials are for lipid sampling. Vials will be sampled into tubes with the same number on the label.
No vials were loaded in the center of the tank to avoid the highest light areas. Vials were randomly distributed around the rack. Halfway through the incubation, vials were redistributed and rotated to stir the larvae in the vial and account for any position effects. Vials were rearranged at 16:00.
During loading, larvae were out of the conical for the same amount of time before being added to the incubator. Larvae were pulled from the conical in the falcon tube and I used a concentration estimate to determine the volume of larvae to achieve the desired total number of larvae in each vial. I took 0.5 mL subsamples (n=5) from each falcon tube after gentle mixing to homogenize the tube. Larave in these subsamples were counted and then the density of the falcon tube was calculated. The R tubes were loaded with 50 larvae for RNA analyses and the L tubes were loaded with 100 larvae for lipid analyses. I used a density worksheet to calculate the volume of larvae requried for each vial.
The metadata and worksheets for incubations is on GitHub here.
Larvae were loaded by symbiont type in random order. Today, C larvae were loaded in all vials needing C larvae, followed by wildtype larvae and then mixed larvae. Loading started at 13:22 and finished at 15:22. Groups of 6 vials were loaded at a time and separated by 6-10 minutes. Time start and time sampled are recorded in the sample metadata. All vials were exposed to 4h 10min of incubation.
Once loaded, vials were filled with 20 mL 1 µM FSW, capped, and added to racks in tanks.
After the 4h incubations, samples were out of treatment for less than 1 minute before sampling. Vials were taken out in the order they were loaded one at a time. The water in the vial was then poured through a 70µM cell strainer. Larvae were then concentrated in the cell strainer in a 6-well plate with FSW using a glass pipette and removed and added into a labeled 1.5 mL screw top microcentrifuge tube. R tubes were preserved by adding 700 µL of RNA/DNA shield and the lipid tubes were snap frozen in liquid nitrogen. Tubes were out of treatment for less than 1 minute before preservation or freezing. After all vials were sampled, tubes were put in boxes in the -80C freezer. Sample inventory can be found on GitHub here. Each treatment group (temp x symbiont) had a separate pipette, cell strainer, and 6 well plate. Sampling took place from 17:33 to 19:32.
MALDI samples were collected after incubations in an additional set of vials incubated for 4 h. Metadata for MALDI samples can be found on GitHub here.
Light and temperature were monitored in each tank.
| Date | Tank | Time | PAR1 | PAR2 | PAR3 | PAR4 | PAR5 | Mean PAR | Temp.C |
|---|---|---|---|---|---|---|---|---|---|
| 20230624 | 1 | 1300 | 410 | 460 | 480 | 490 | 570 | 482 | 27.41 |
| 20230624 | 2 | 1300 | 490 | 480 | 402 | 469 | 580 | 484.2 | 30.13 |
| 20230624 | 3 | 1300 | 485 | 470 | 510 | 515 | 490 | 494 | 32.93 |
| 20230624 | 1 | 1530 | 516 | 466 | 534 | 482 | 502 | 500 | 27.43 |
| 20230624 | 2 | 1530 | 500 | 502 | 492 | 480 | 520 | 498.8 | 29.92 |
| 20230624 | 3 | 1530 | 560 | 470 | 480 | 501 | 510 | 504.2 | 33.13 |
| 20230624 | 1 | 1730 | 550 | 500 | 506 | 490 | 467 | 502.6 | 27.29 |
| 20230624 | 2 | 1730 | 565 | 510 | 492 | 470 | 502 | 507.8 | 30.31 |
| 20230624 | 3 | 1730 | 551 | 475 | 526 | 503 | 475 | 506 | 33.13 |
Light achieved the target of 500 PAR and temperature held at target for the incubations.
Sampling for ITS2 and cell density
ITS2 and cell density samples were collected after being run through the cool (20-30C) phenoplate run for each symbinot type. Samples were collected between 12:55 and 16:55. Sample metadata can be found here and here.
23 June 2023
Rearing larvae
Larval cultures looked good today! We stirred and tended them every 2-3 hours.
Thermal performance curves
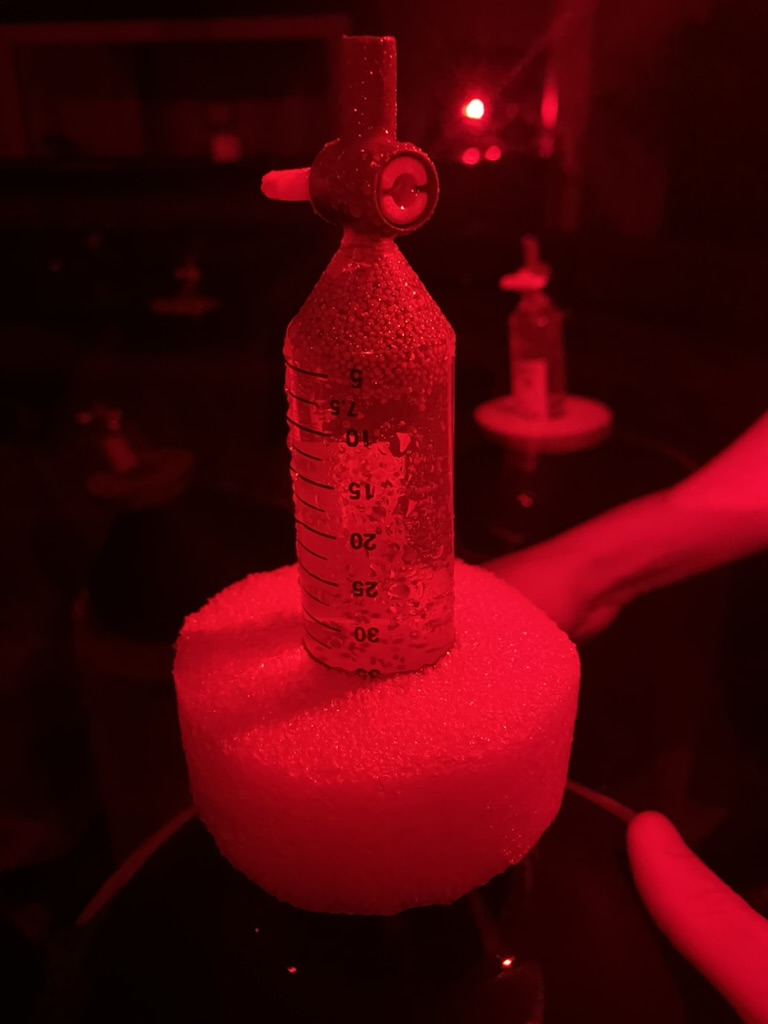
Today we ran thermal performance curves (TPC). We brought a falcon tube of larvae from each tank and stored in the incubator in the dark at 26°C. Fresh larvae were brought to the lab every ~2 hours during the measurements.
The SDR was calibrated with 100% air saturated seawater before every run.
Tempratures were ran in duplicate plates with one plate in each incubator/SDR. There were 3 blank wells on each plate and the location of larvae from each group was randomized throughout each plate. This removes any position effects or SDR effects since treatment groups were randomized throughout. We ran temperatures in random order as well to avoid any time of day effects on metabolic rates.
Incubator 1 had SDR 641 (SDR 1) and incubator 2 had the SDR 710 (SDR2).
The plates that we ran were as follows:
| Run | Plate | SDR | Temp | Time Start | Time End | Notes |
|---|---|---|---|---|---|---|
| 4 | 7 | 641 | 10 | 11:08 | 11:23 | We re did this run because the calibration failed on the first attempt, after calibration everything looked good |
| 4 | 8 | 710 | 10 | 11:08 | 11:23 | |
| 5 | 9 | 641 | 24 | 12:24 | 12:39 | |
| 5 | 10 | 710 | 24 | 12:24 | 12:39 | |
| 6 | 11 | 641 | 32 | 13:47 | 14:08 | |
| 6 | 12 | 710 | 32 | 13:47 | 14:08 | |
| 7 | 13 | 641 | 28 | 15:21 | 15:37 | |
| 7 | 14 | 710 | 28 | 15:21 | 15:37 | |
| 8 | 15 | 641 | 36 | 16:36 | 16:57 | |
| 8 | 16 | 710 | 36 | 16:36 | 16:57 | |
| 9 | 17 | 641 | 39 | 17:51 | 18:18 | |
| 9 | 18 | 710 | 39 | 17:51 | 18:18 | |
| 10 | 19 | 641 | 40 | 20:26 | 20:51 | |
| 10 | 20 | 710 | 40 | 20:26 | 20:51 | |
| 11 | 21 | 641 | 29 | 21:51 | 22:10 | |
| 11 | 22 | 710 | 29 | 21:51 | 22:10 |
For run 4, we re did this run because the calibration failed on the first attempt, after calibration everything looked good.
Sample metadata for TPC is on GitHub here and the datafiles for each run are on GitHub here.
ITS2 and cell density sampling
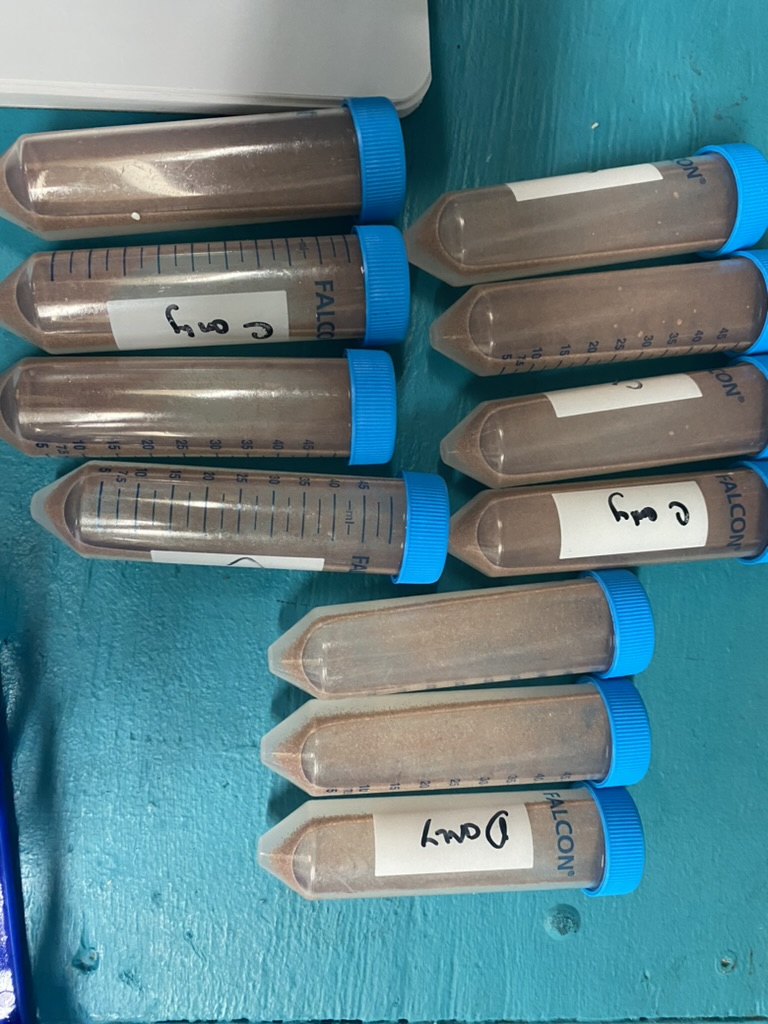
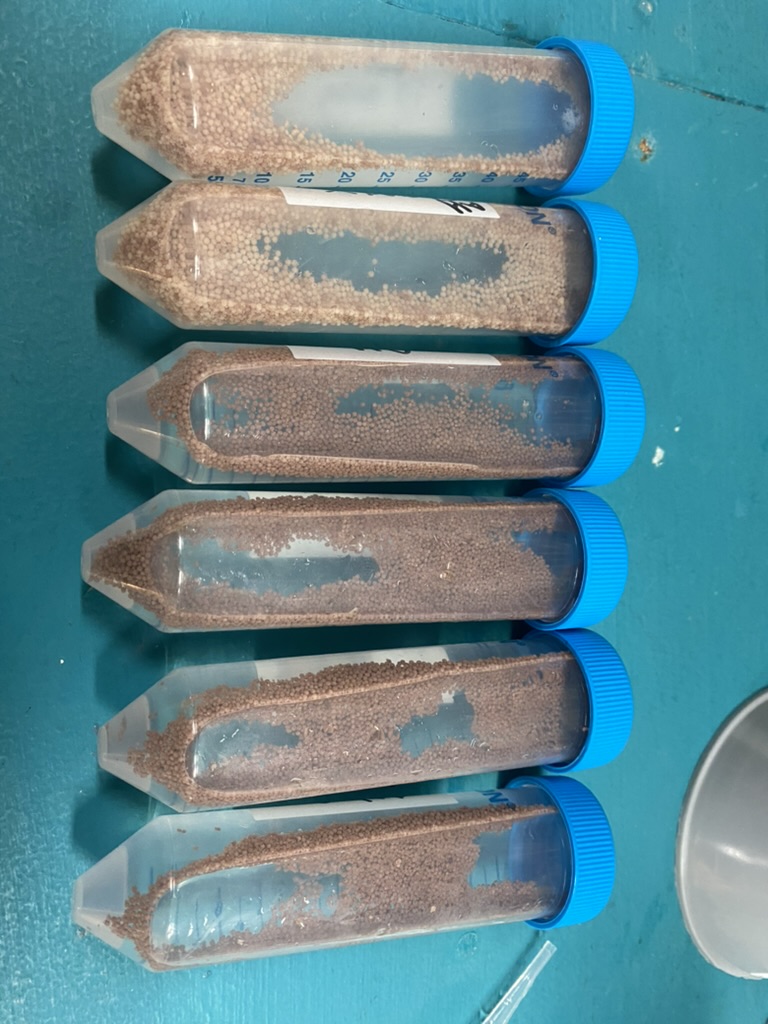
We took n=6 samples per symbiont type for ITS2 samples and cell density/size samples. Samples were spun for 30 sec at 10,000 rcf, water was removed, and samples were preserved. ITS2 samples were preserved with 500 µL RNA/DNA shield and cell density samples were preserved with 200µL 20% Zfix. ITS2 samples were stored in the -80C and cell density samples were kept in the 4C fridge.
A master sample list can be found on GitHub here.
Environmental samples
Ariana took daily measurements.
| Date | Time | Tank | Temp | pH.mV | pH.nbs | flow |
|---|---|---|---|---|---|---|
| 20230623 | 1805 | C1 | 27.18 | -50.1 | 8.03 | 17 |
| 20230623 | 1806 | C2 | 27 | -50.3 | 8.03 | 16 |
| 20230623 | 1807 | MIX1 | 27.13 | -50.6 | 8.04 | 18 |
| 20230623 | 1808 | MIX2 | 27.18 | -50.6 | 8.04 | 17 |
| 20230623 | 1809 | WT1 | 27.21 | -50 | 8.03 | 18 |
| 20230623 | 1810 | WT2 | 27.2 | -50.5 | 8.04 | 16 |
PAR was 0 for all tanks.
All daily measurements are on GitHub here.
Apex set up
Jill set up the Apex equipment today.
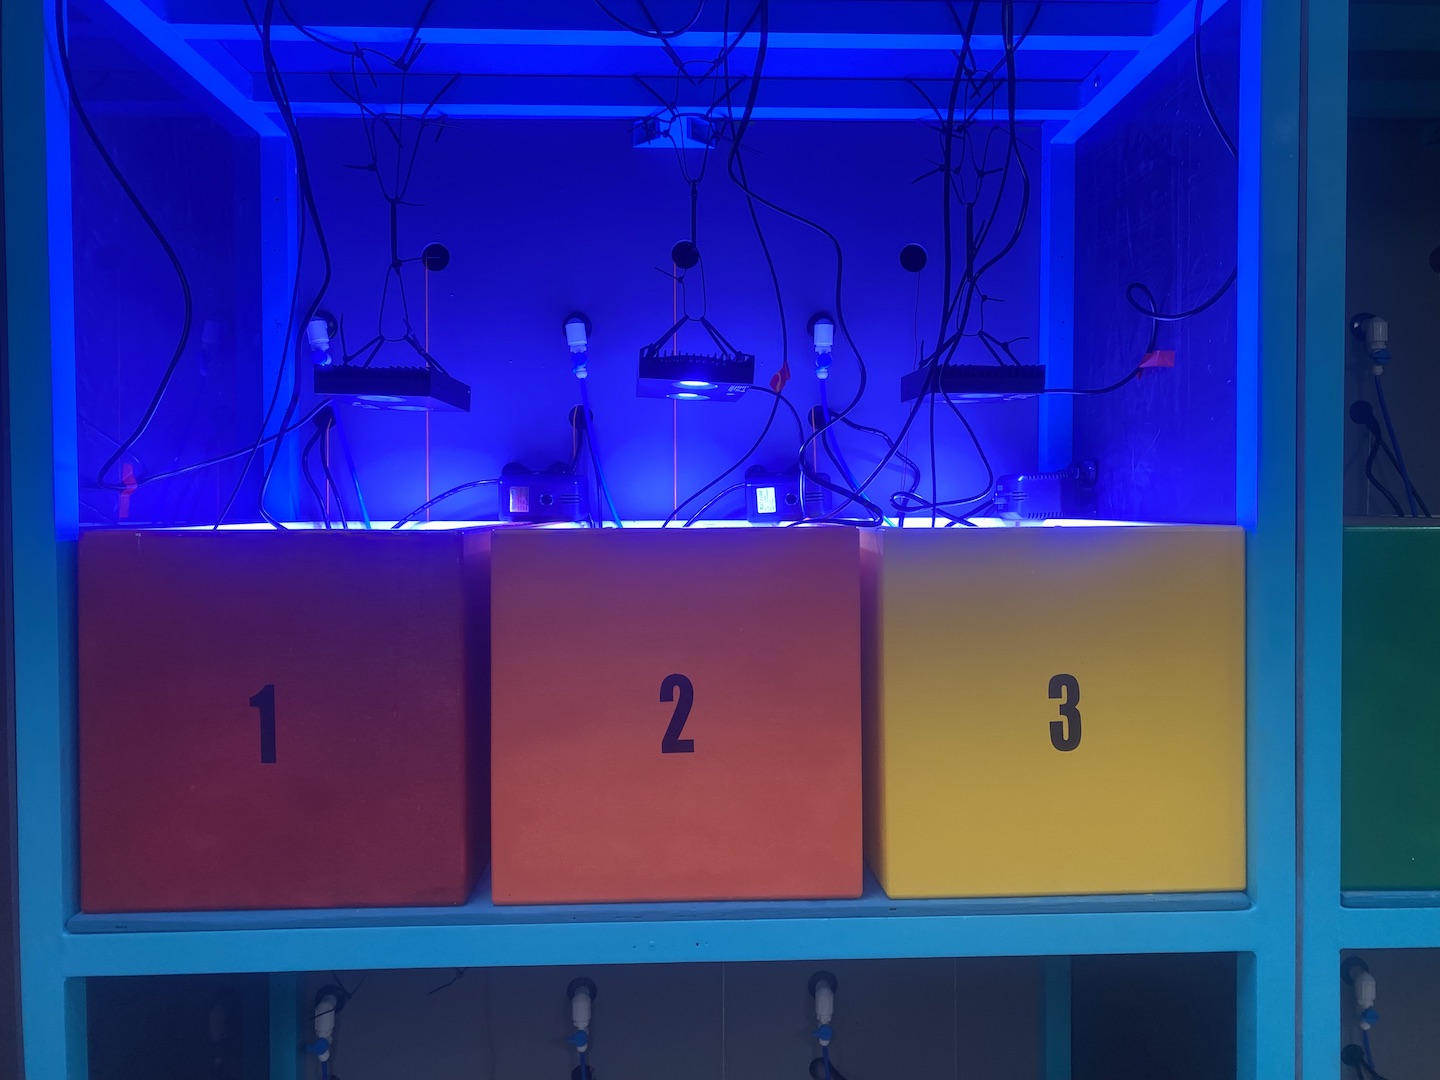
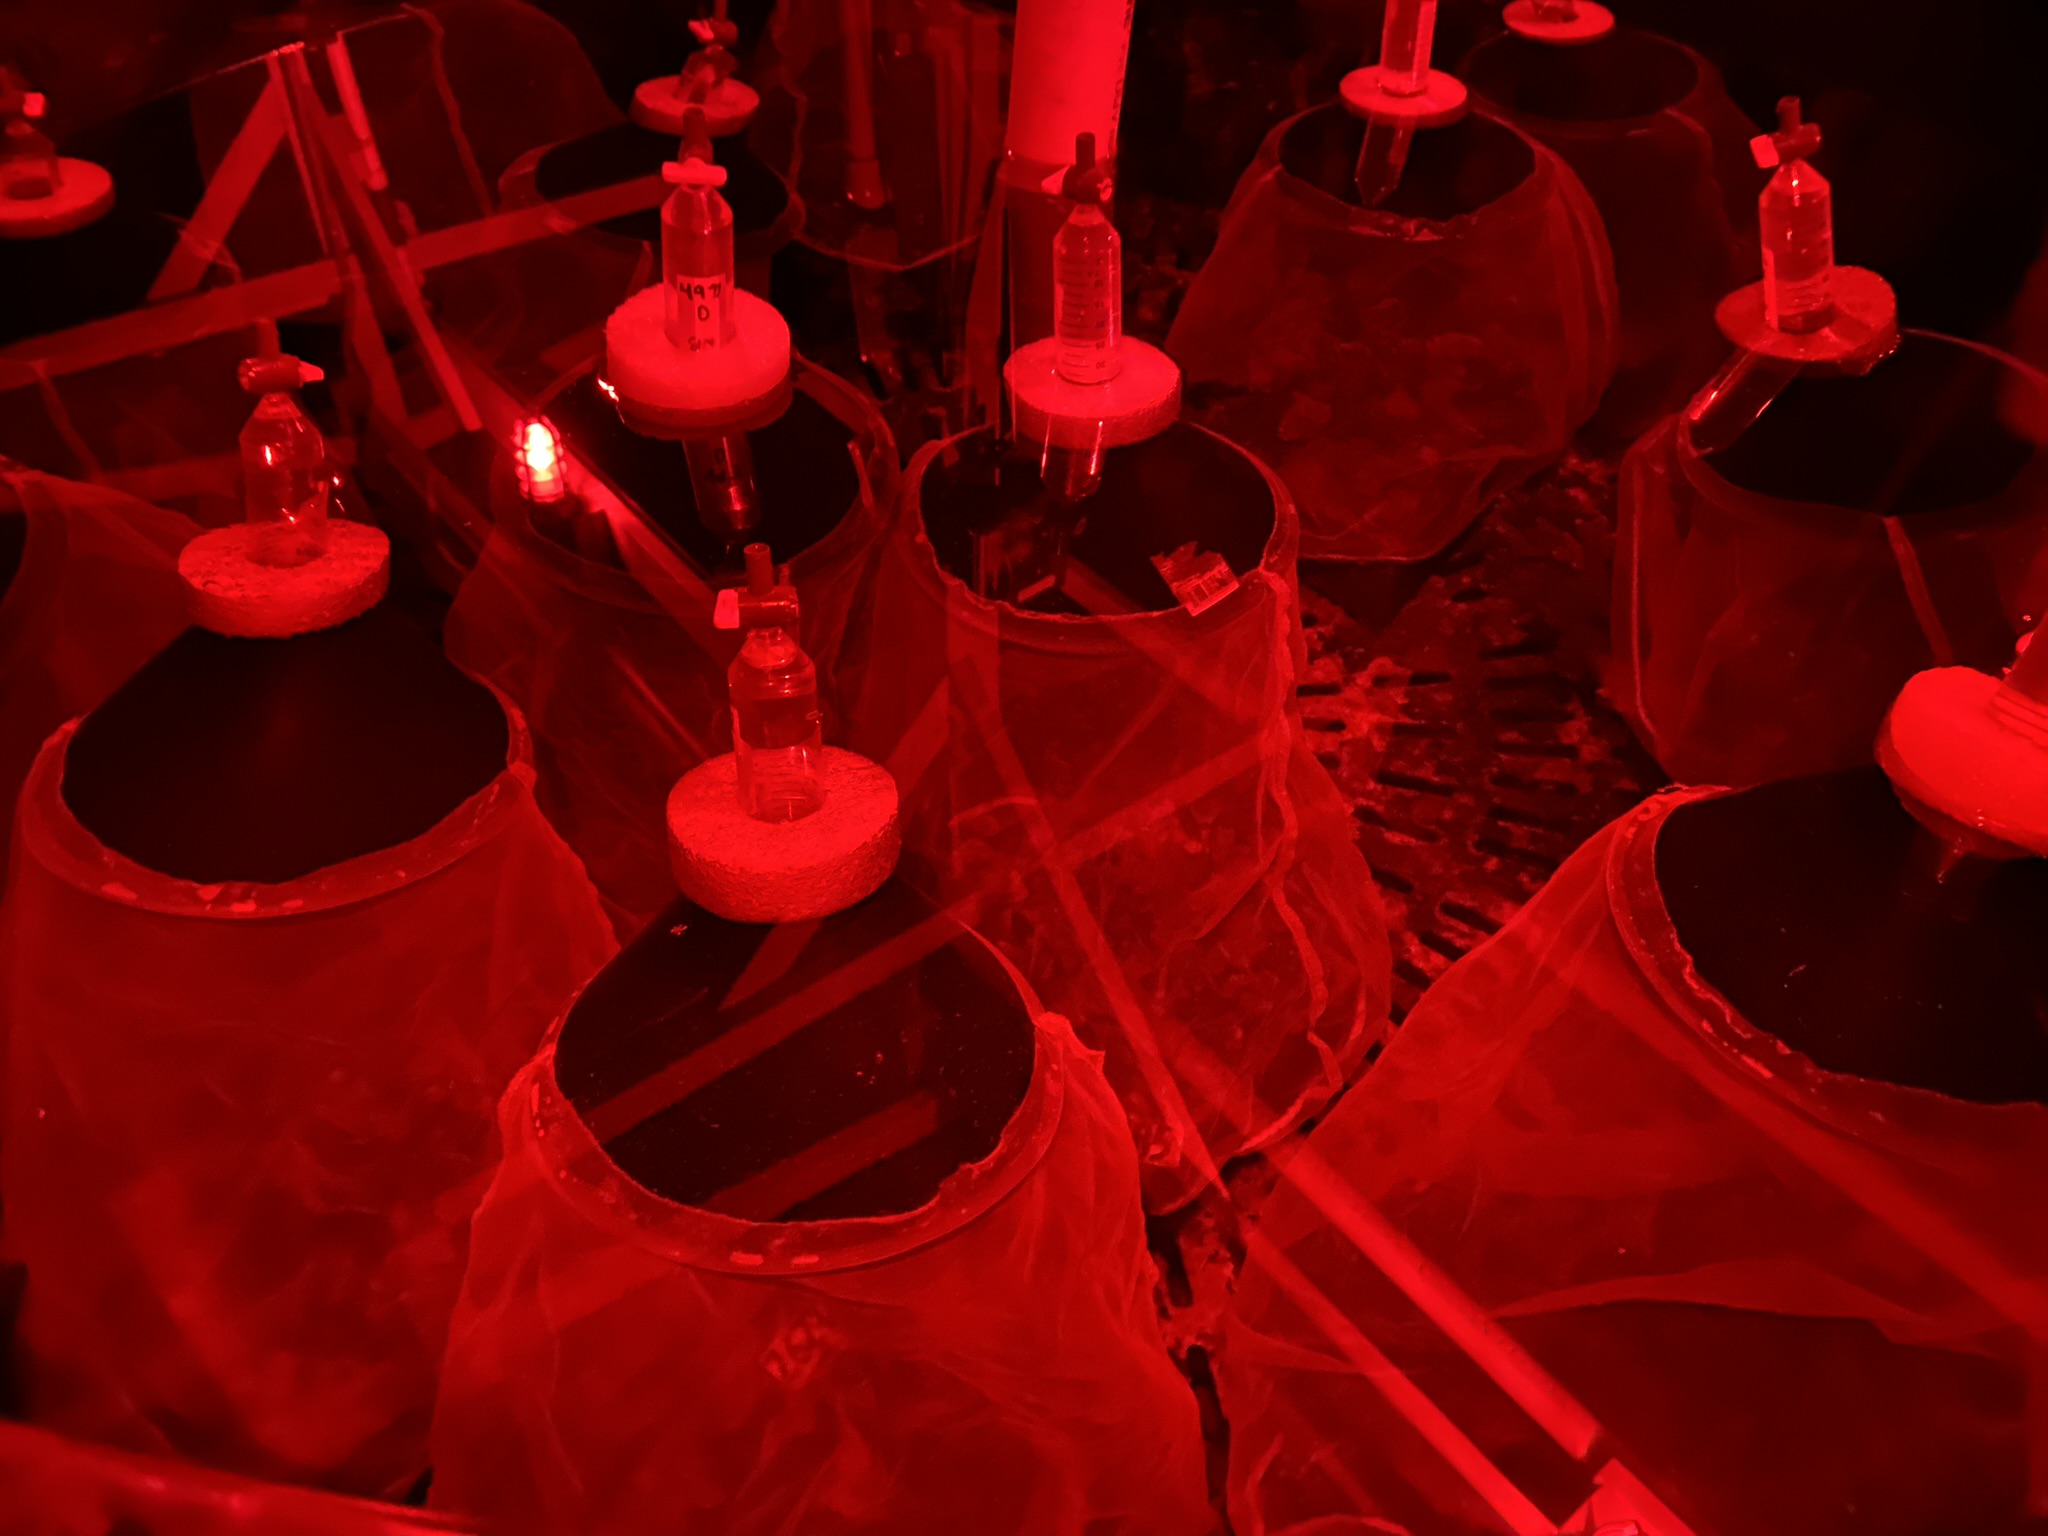
The Apex unit was names “HIMB 2023” on the Putnam Lab Apex Fusion account. We used the Apex Base SN 29428 and the Apex EB32 SN 117982. We have 3 tanks/treatments (ambient = 27; moderate = 30; high = 33). These will be static hold treatments for larval incubations for RNA and Lipid sampling. Jill set up 1 base unit with a temperature probe and two PM1’s with two additional temperature probes.
The base unit was named TMPAMB (ambient), PM1_19 was named TMPMOD (moderate), and PM1_21 was named TMPHIG (high).
Heaters were plugged into outlets 1, 2, and 3 of the EB32. The heaters are 300W titanium Finnex submersible heaters. The outlets were controlled to hold static at 27, 30, and 33.
Tanks were up and running in the afternoon and equipped with AquaIllumination HD32 lights hung from the top of the tanks with zip ties. Apex and heaters were added to the tanks and we added a Hydor Pico recirculating pump to each tanks. Tanks were supplied with FSW.
Tank 1 will be ambient, Tank 2 will be moderate, and Tank 3 will be high. Tanks will be started tomorrow morning.
Deploying loggers
Loggers were deployed (Hobo Tidbits) into each tank. Ambient = logger 21723474; Moderate = logger 21723473; High = logger 21723475.
Estimating larval sample size
Ariana calculated expected larval sample size needed to make sure we have enough. Here are my estimates for each symbiont type:
- PI curves: n=2 plates x 7 wells x 5 larvae = 70 per day x 2 days = 140 larvae
- TPCs: n=16 plates x 7 wells x 5 larave = 560 per day x 2 days = 1,120 larvae
- Phenoplate: n=48 wells x 150 larvae = 7200 per sym x 2 days = 14,400 larvae
- Incubations: n=18 x 100 larvae = 1800 per symbiont for lipids x 2 days = 3600 larvae for lipids + 3600/2 = 1800 larvae for RNA = 5,400 larvae
- Cell density and ITS2: n=5 time points x 6 reps per sym x 2 metrics x 30 larvae = 1800 larvae
- P and R measurements: n=6 plates x 7 wells x 5 larvae x 2 days = 420 larvae
This totals ~23,000 larvae per symbiont type. We should have enough given that we have approximately 50K larvae of each type. WT is the lowest density, so we may be close on WT samples.
Our plans may change going forward, but this provide a general estimate for our work.
22 June 2023
Allocating experimental larvae and rearing
Today we allocated the larvae for our experiment. We have three groups:
- Nonbleached parents with a mix of C and D symbionts (likely majority D)
- Bleached parents with C symbionts
- Wildtype
We now have n=2 conicals for each of these groups, which are technical replicates of the large fertilization pool for each type. We have at least 50,000 larvae of each type for our experiments. D conicals were mixed with mixed parents (same parents in each pool) and C3 tank was combined with C1 and C2. 6/17 cultures are left separate from our experiment 6/18 cultures.
The parents that contributed to the nonbleached mix pool are:
These larvae will be checked and stirred a few times daily and during the night.
PI Curves
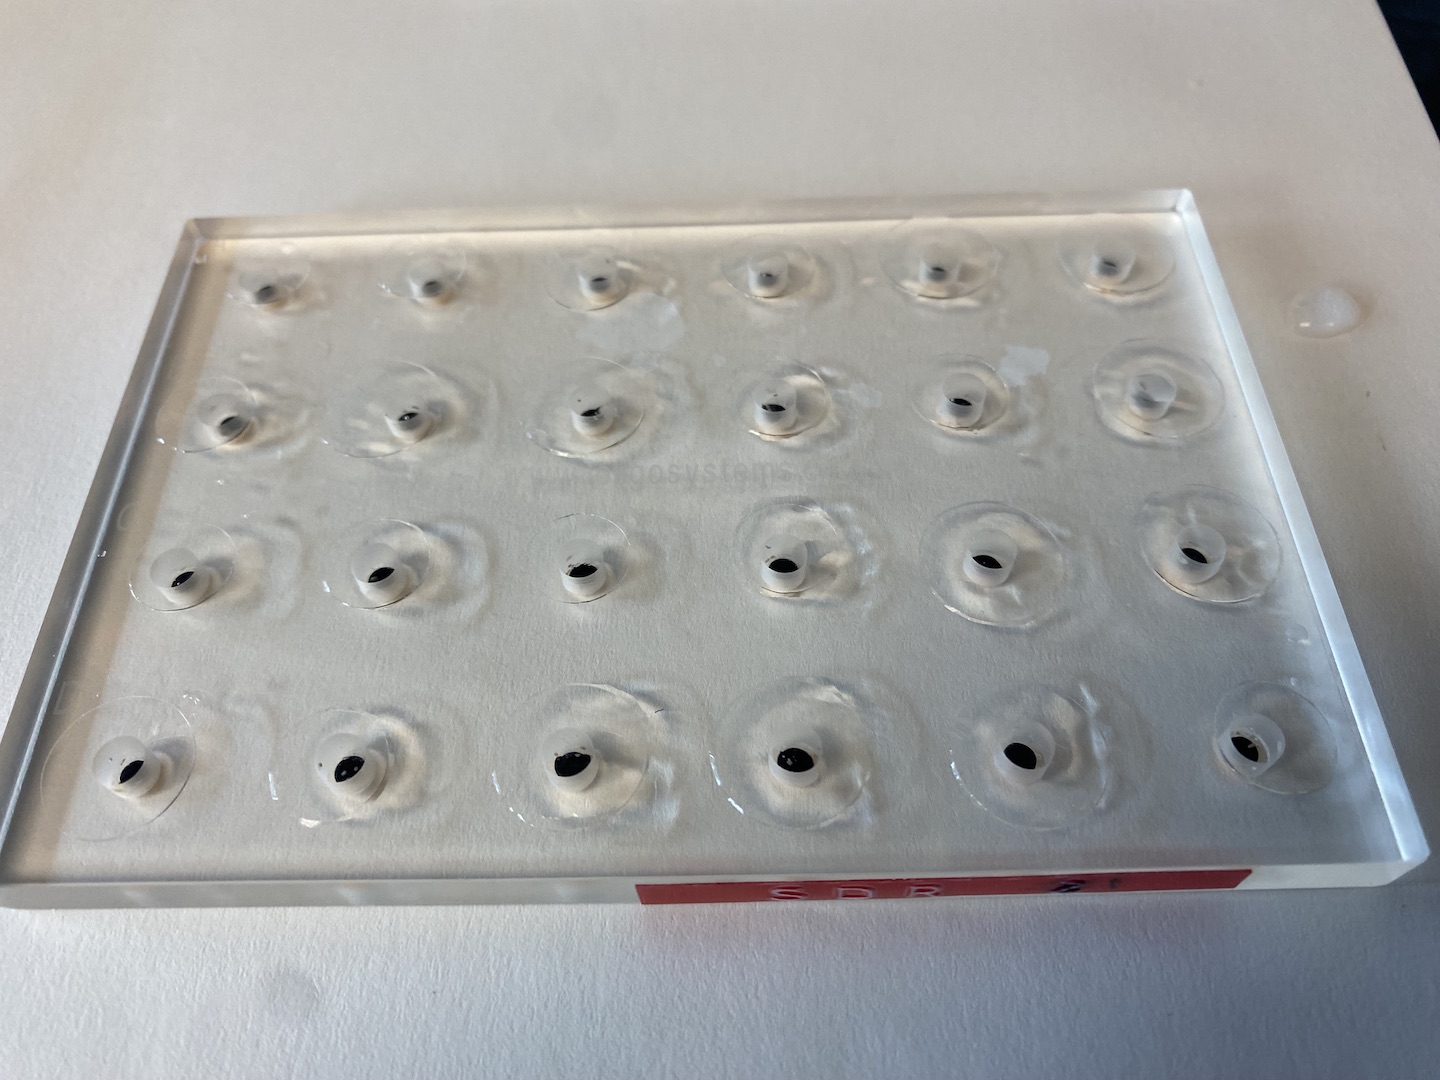
Jill and Ariana ran larval PI curves today with mixed, wildtype, and C larvae. Plate maps and sample information dataframes are on GitHub here and a full protocol is on our Google Drive folder. Briefly, we loaded n=5 larave into n=7 wells per symbiont type per SDR plate. We are using both the 641 and 710 SDR with the plates in incubators. We are following this general SDR protocol for general practices.
Jill completed optimization steps including calibration of the SDR to 0% and 100% air saturated oxygen. All calibrations and single measurements were satisfactory. Jill also completed measurements of the light field and centered the SDR in the incubator and secured the light.
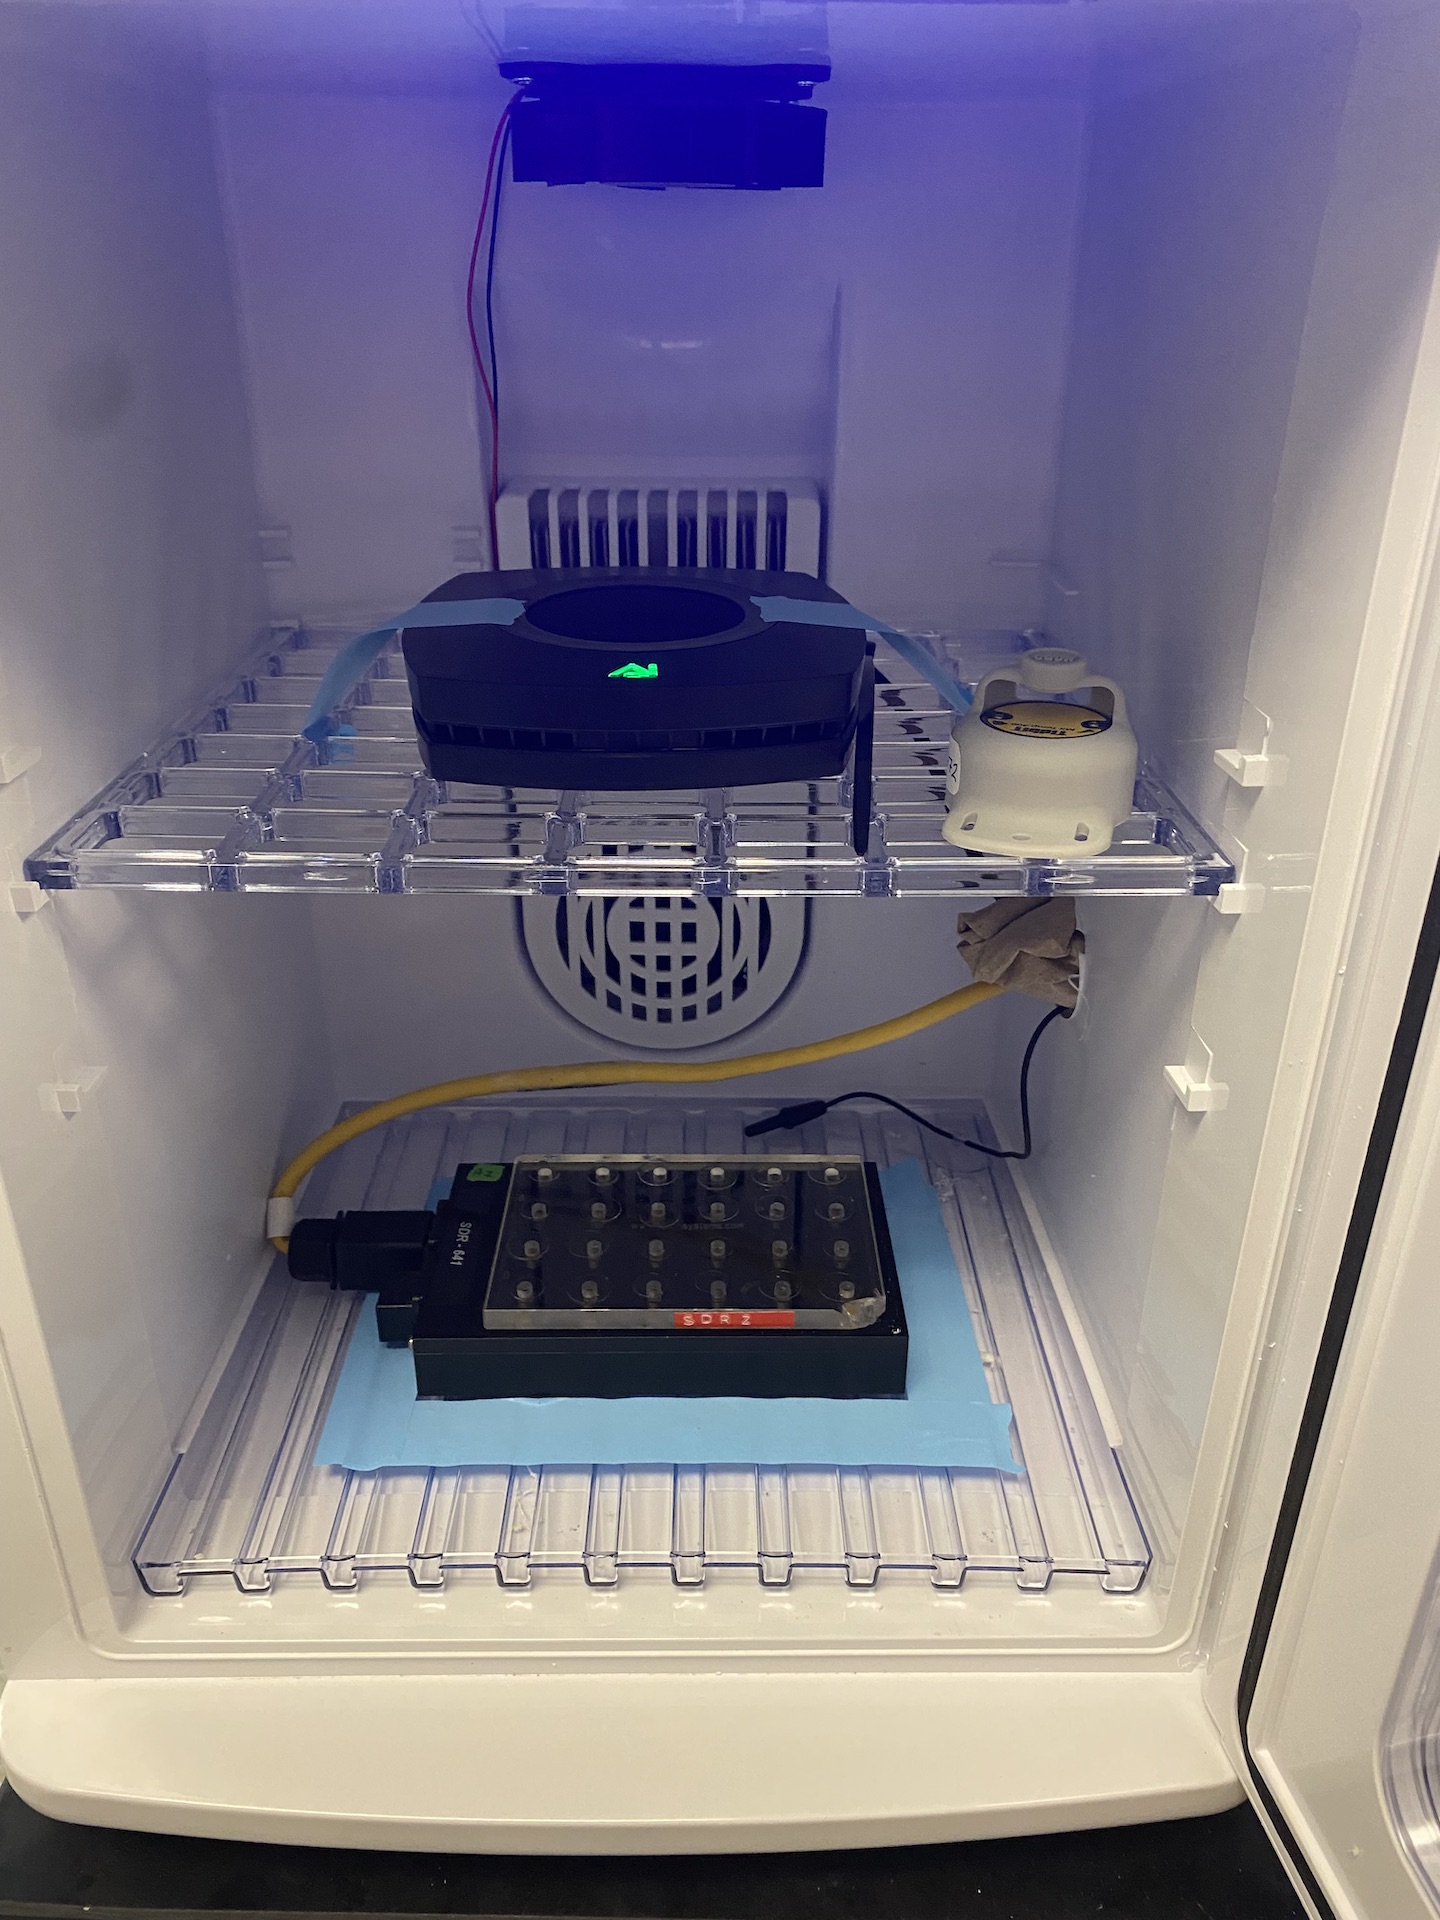
We ran two plates for the SDR today with symbiont type and blank location randomized within each plate with a different configuration for each plate. See the sample information in GitHub for a full sample list and plate locations.
We first dark adapted the larvae in an incubator at 26°C for 1 hour prior to measurements. 5 larvae of each type from duplicate conicals (half of the wells were from C1 and half from C2 tanks, etc) were added to the plates, sealed with coverslips, and measured. We used 3 1µm FSW blanks in each plate.
We first ran respiration at 0 PAR and then increased the PAR levels using AquaIllumination lights in 11 intervals with 15-20 minutes per interval. The intervals we used were:
| PAR | Light % |
|---|---|
| 0 | 0 |
| 16 | 2 |
| 60 | 5 |
| 120 | 8 |
| 165 | 10 |
| 275 | 15 |
| 425 | 21 |
| 700 | 33 |
| 1100 | 54 |
| 1500 | 84 |
| 1660 | 100 |
These intervals should encompass the entire PI curve and provide high frequency measurements at low light. Our larvae are acclimated to low light, so this appropriate for our use. PAR values were generated with a standard curve of light channel % and PAR values on GitHub here.
Full run information can be found on GitHub here.
The PI curve was conducted from ~14:30-17:30. We controlled and monitored temperature constantly in the incubators. Temperatures remained between 35.5 and 27°C on target until the lights reached 1500 PAR. At this point the lights generated too much heat and the temperature went to >30°C. We will look at the PI curves and likely remove these high light values from future PI curve measurements.
We also used separate pipettes for each symbiont type and washed plates with DI water between loading.
Analyzing PI curve data
Ariana wrote R scripts to extract and conduct preliminary analyses on PI curves. The scripts are on GitHub here for extraction of rates and here for analysis of PI curves.
We found some very interesting results!
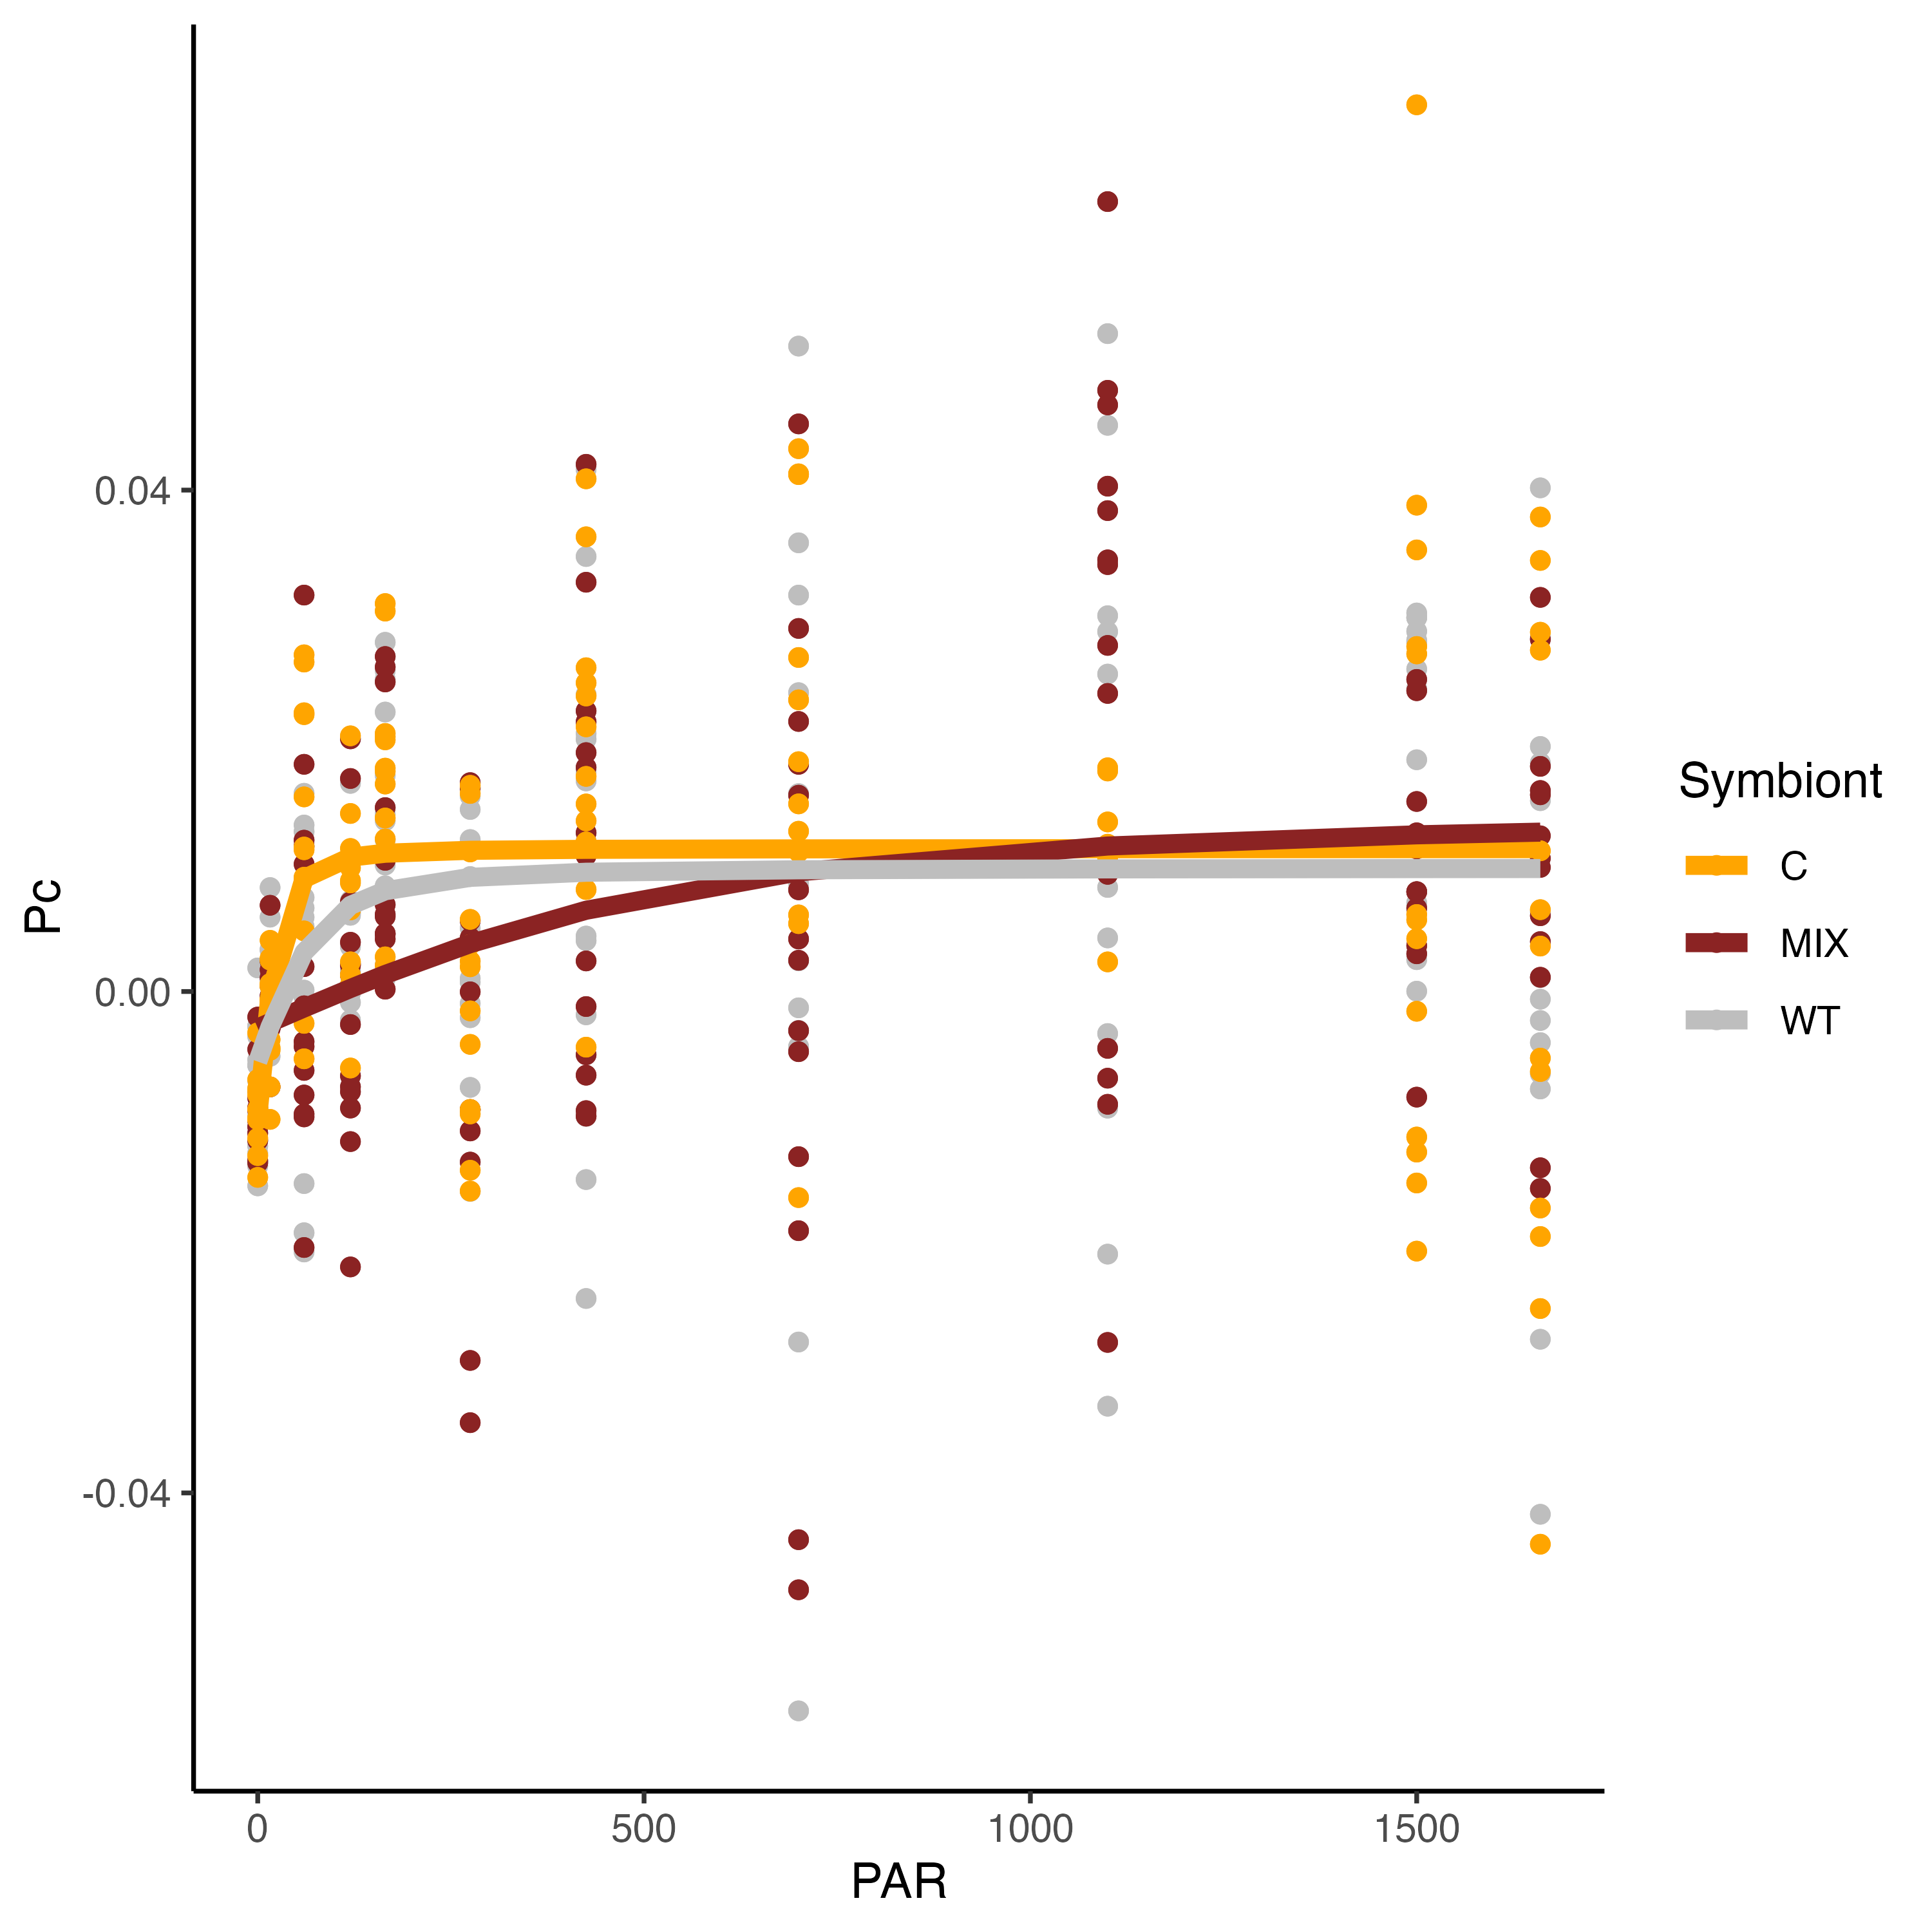
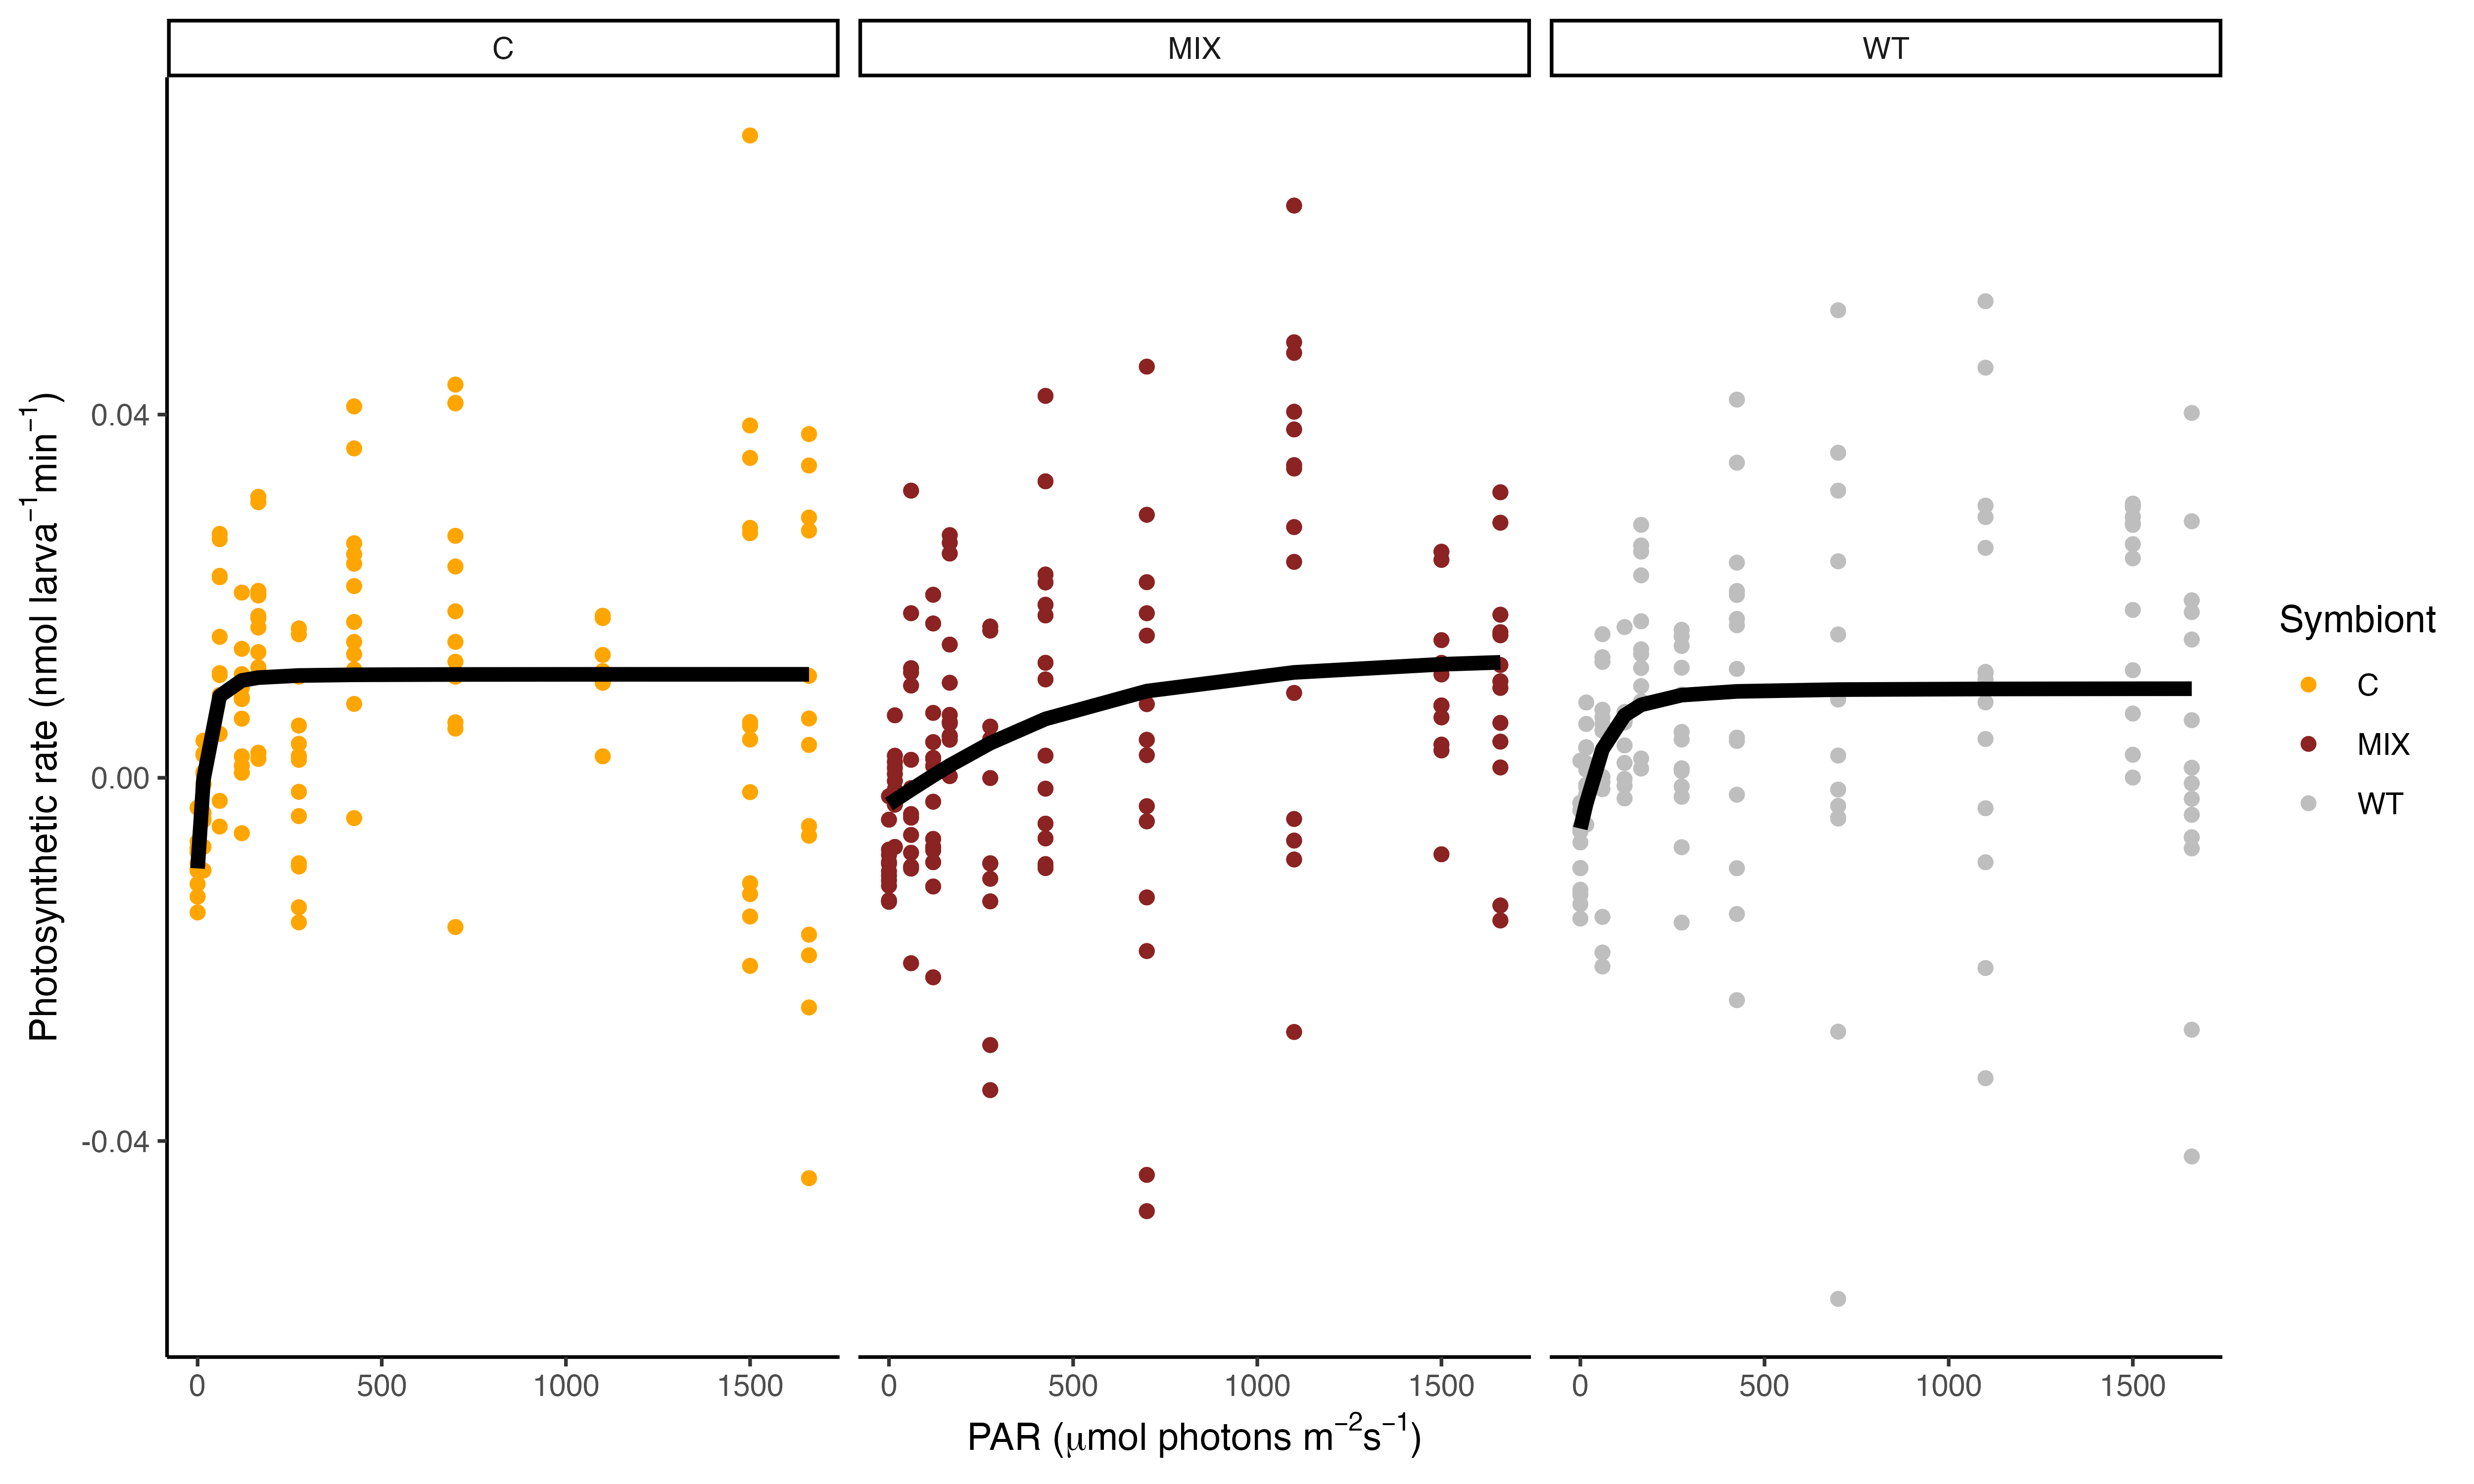
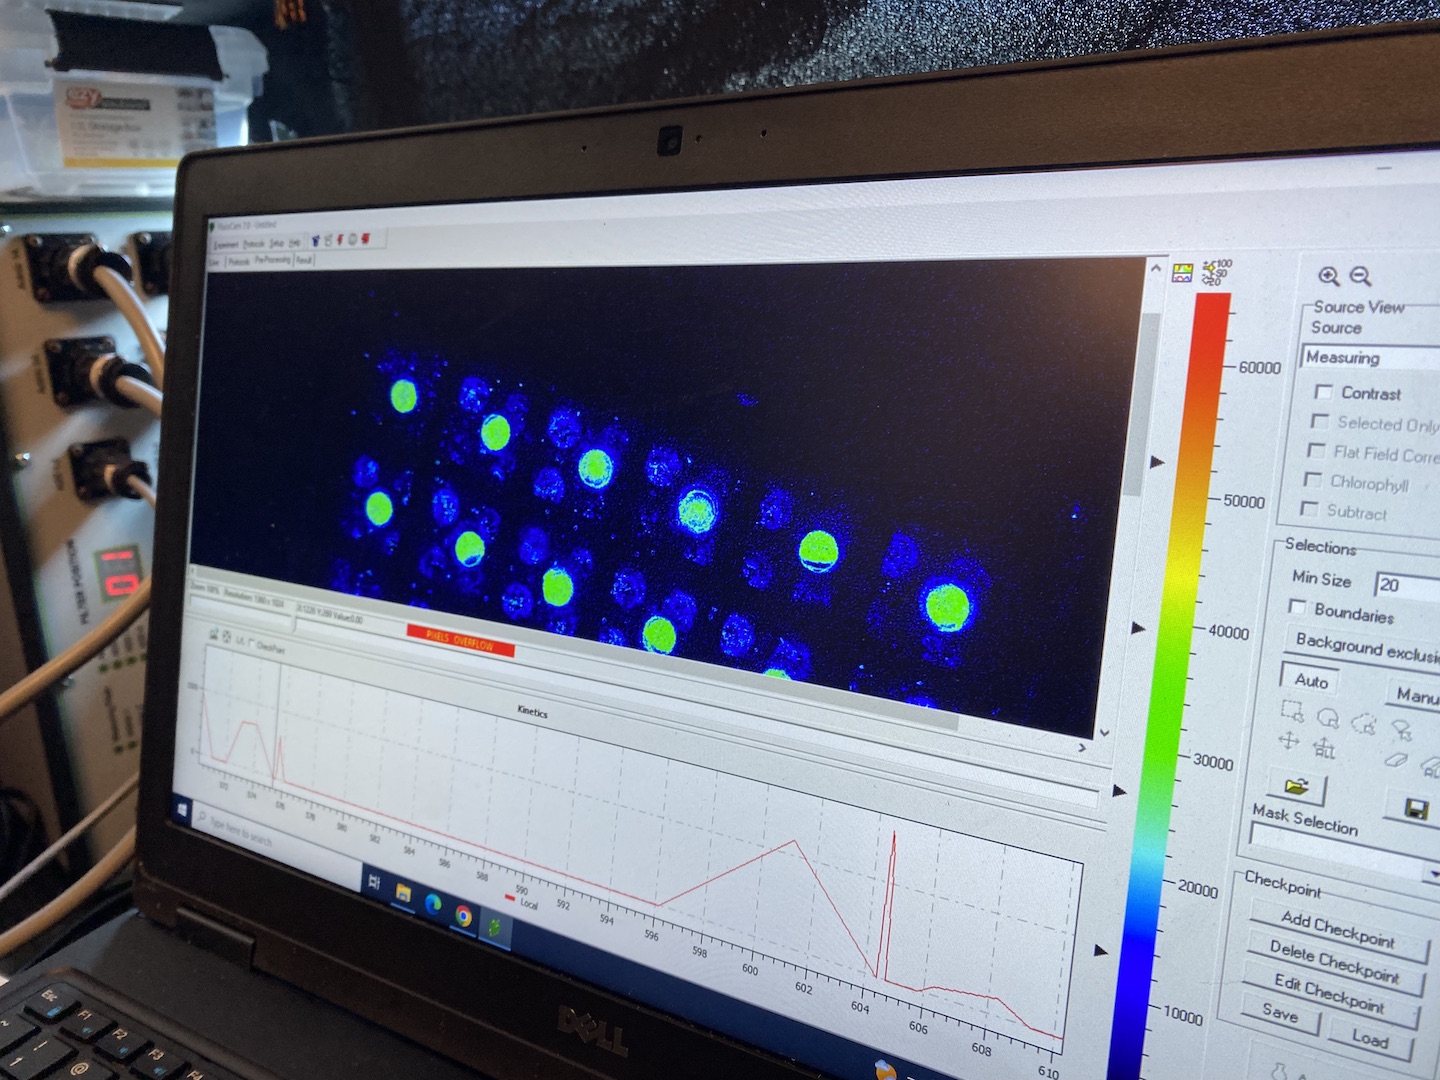
These results show that the PI curve of Mix symbiont (C and D, mostly D) larvae are different from Cladocopium larvae and wildtype samples! The saturating irradiance (Ek) for WT and C larvae is approximately 100 PAR while this parameter is ~600 for Mixed larvae. This is very interesting. We will use these PI curves to set light levels for additional measurements and will be interested to compare this data with the photophysiological data with Jen and Andrei.
ITS2 Sampling
Ariana sampled n=30 larvae per sample for n=6 samples from each symbiont type (n=3 per conical) at 1500-1600 for ITS2 amplicon sequencing. 18 total samples were collected by counting 30 larvae, spinning the larvae down in the tube for 1.5 min at 10,000 rcf (Eppindorf centrifuge 5415D model) and preserved with 500 µL RNA/DNA shield. Samples were stored in the -80°C freezer.
Size/Symbiont Density Sampling
Ariana sampled n=30 larvae per sample for n=6 samples from each symbiont type (n=3 per conical) at 1600-1700 for size and symbiont density. 18 total samples were collected by counting 30 larvae, spinning the larvae down in the tube for 1.5 min at 10,000 rcf (Eppindorf centrifuge 5415D model) and preserved with 200 µL 20% zinc buffered formalin in FSW. Samples were stored in the 4°C fridge.
Preparing tubes and materials
Jill labeled tubes and vials in preparation for incubations in two days.
Photophysiology & phenoplate
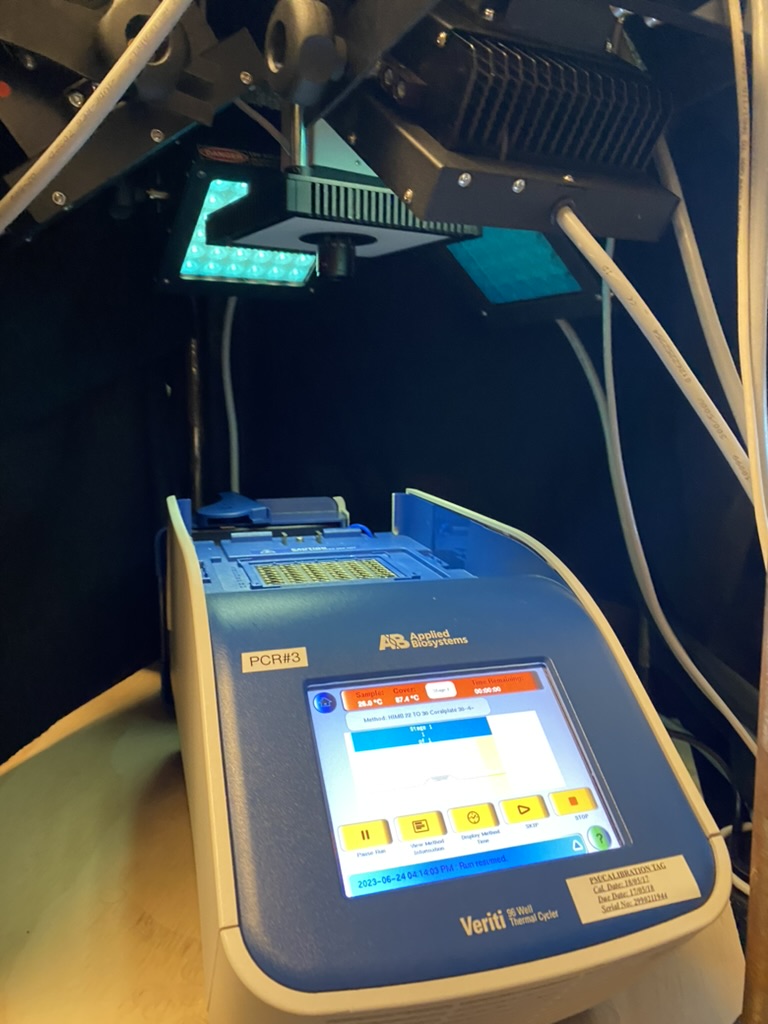
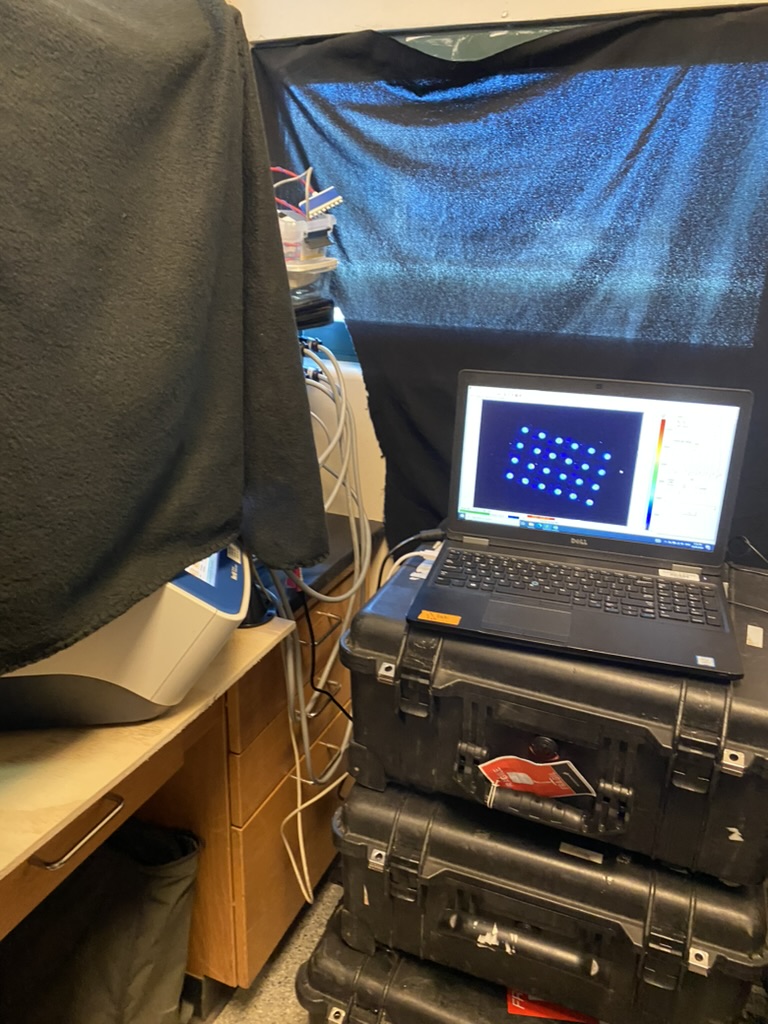
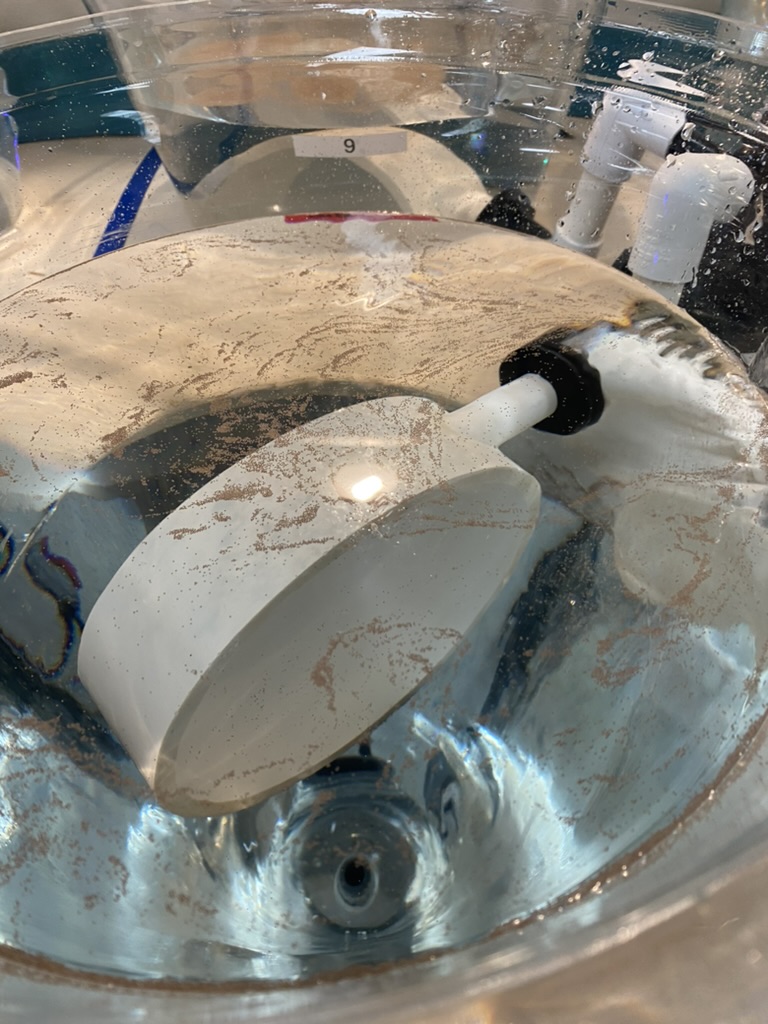
Jen and Andrei conducted optimizations and calibrations today for the phenoplate and had success measuring fluorescence and oxygen in larvae! Test runs show that they can capture a full thermal performance curve and a full suite of photophysiological assays on Montipora larvae. Tomorrow we will run experimental samples.
Jen and Andrei’s notes and protocols will be added to our Google Drive and uploaded to GitHub.
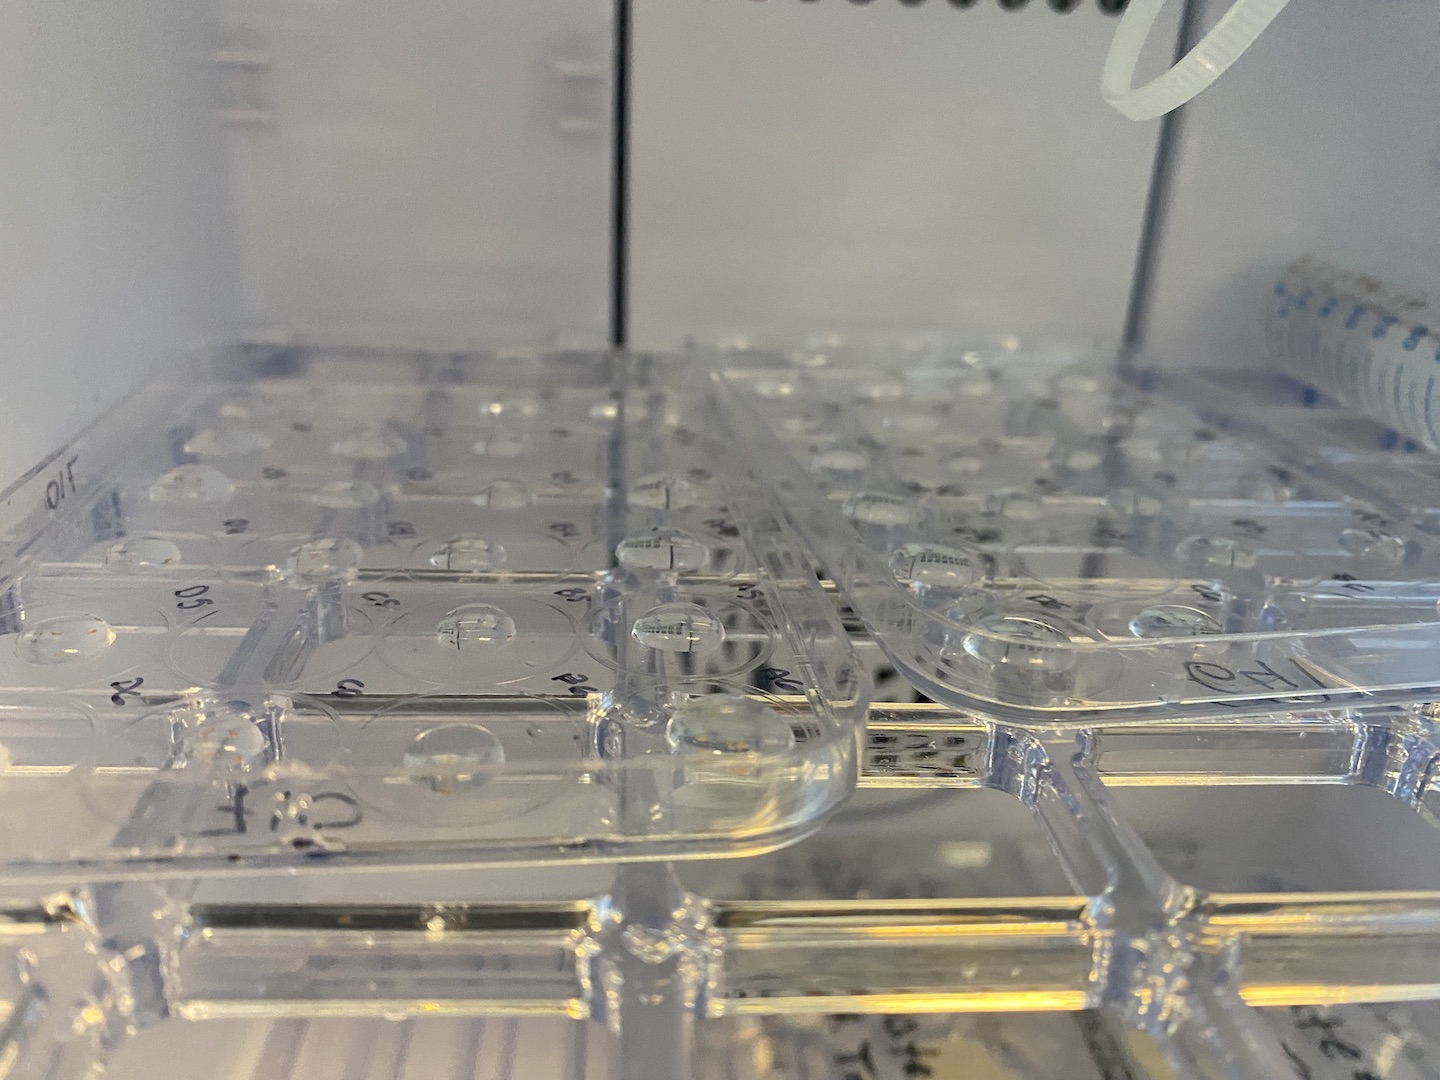
We also walked through our experimental design for phenoplate measurements, which will occur every 1-2 days. We will analyze the three symbiont groups with two plates (24 well plates across a light and temperature gradient) per group. The first plate will run a sequence of temperature exposures from 20-22-24-26-28-30°C and the second plate will run 31-32-33-34-36-38°C. Across these temperatures the phenoplate will collect oxygen data (respiration and photosynthesis; TPC’s) and fluorescence (Fv/Fm, Ek, ETR, rapid light curves). These temperature profiles are chosen to provide high resolution data around thermal maxima and provide a wide range of temperatures to encompass a full PI curve. We will run a total of 6 plates per day with n=30 larvae per well. We will sample for ITS2 and symbiont cell density after these runs if needed to conserve larvae.
I will add links to more information, protocols, and data as they become available.
Environmental measurements
Ariana took daily measurements.
| date | time | tank | group | pH.mV | pH.nbs | temp.C | sal.psu | flow.mL.5s | par | tris.date | notes |
|---|---|---|---|---|---|---|---|---|---|---|---|
| 6/22/23 | 1709 | C1 | Cladocopium | -48.9 | 8.01 | 27.29 | 33 | 17 | 4 | 20230617 | |
| 6/22/23 | 1710 | C2 | Cladocopium | -49.2 | 8.02 | 27.28 | 33 | 17 | 3 | 20230617 | |
| 6/22/23 | 1712 | MIX1 | Mixed | -49.3 | 8.02 | 27.13 | 33 | 17 | 2 | 20230617 | |
| 6/22/23 | 1713 | MIX2 | Mixed | -49 | 8.01 | 27.21 | 33 | 20 | 4 | 20230617 | |
| 6/22/23 | 1714 | WT1 | Wildtype | -48.2 | 8 | 27.19 | 33 | 20 | 3 | 20230617 | |
| 6/22/23 | 1718 | WT2 | Wildtype | -48.9 | 8.01 | 26.91 | 33 | 17 | 1 | 20230617 |
21 June 2023
Our collaborators from UT Sydney arrived today! Jennifer Matthews and Andrei Herdean will be helping us run photophysiology measurements.
Rearing larvae
Larval cultures looked good today. They had occasional stirring and care from babysitters.
Counting larvae
Ariana measured larval density in the morning to monitor density and make final decisions on which larval groups we will use.
| Tank | Total Volumee | Sample Volume | Count | Average per mL | Total |
|---|---|---|---|---|---|
| C1 | 15L | 5mL | 8,8,12 | 1.86 | 28000 |
| C2 | 15L | 5mL | 23,20,17 | 4 | 60000 |
| C3 | 15L | 5mL | 29,22,22 | 4.86 | 73000 |
| D1 | 15L | 5mL | 8,14,9 | 2.06 | 31000 |
| D2 | 15L | 5mL | 3,3,1 | 0.46 | 7000 |
| D3 | 15L | 5mL | 4,2,1 | 0.46 | 7000 |
| NB1 | 15L | 5mL | 27,35,40 | 0.8 | 102000 |
| NB2 | 15L | 5mL | 17,22,22 | 4.06 | 61000 |
| NB3 | 15L | 5mL | 45,43,38 | 8.4 | 126000 |
| NB4 | 15L | 5mL | 24,32,20 | 5.06 | 76000 |
| NB5 | 15L | 5mL | 11,22,30 | 4.2 | 63000 |
| NB6 | 15L | 5mL | 22,24,21 | 4.4 | 67000 |
| NB7 | 15L | 5mL | 17,20,32 | 4.6 | 69000 |
| NB8 | 15L | 5mL | 8,17,7 | 2.1 | 30000 |
We have plenty of C, but our density for D is low. We will use NB cultures, which are mixed C and D (but majority D). We will re-allocate larvae in the morning and settle anything that is left over.
Test PI curves and respiration measurements
Jill ran test measurements for respiration and PI curves today. Metadata was recorded on Google Drive and GitHub.
Jill first ran test respiration measurements at three temperatures:
| Plate | Run | Temperature |
|---|---|---|
| 1 | 1 | 15 |
| 2 | 1 | 15 |
| 3 | 2 | 25 |
| 4 | 2 | 25 |
| 5 | 3 | 33 |
| 6 | 3 | 33 |
5 larvae were loaded in each well. Metatdata was recorded on Google Drive and GitHub. Jill noticed that we need to take the plate out inbetween runs when the temperature is reaching a new target to avoid condensation. The incubator temperature may also differ than the actual temperature, so we will check this using the temperature probe. In the dark the temperatures hit the target temperatures as indicated by temperatures from the SDR data. Ariana worked on preliminary analysis of this data on GitHub.
Jill also ran a test PI curve in which the larvae are exposed to consecutive increasing light levels.
| Date | Run | Plate | SDR | Light_Level | Light_Value | TimeStart | TimeStop | TimeInterval | IntervalStart | IntervalStop | Temperature | Notes |
|---|---|---|---|---|---|---|---|---|---|---|---|---|
| 20230621 | 1 | 1 | 641 | 1 | 0 | 16:48 | 17:18 | 0:30 | 0 | 30 | 26 | Test |
| 20230621 | 1 | 1 | 641 | 2 | 50 | 17:20 | 17:52 | 1:02 | 33 | 62 | 26 | Test |
| 20230621 | 1 | 1 | 641 | 3 | 150 | 17:54 | 18:20 | 1:28 | 65 | 88 | 26 | Test |
| 20230621 | 1 | 1 | 641 | 4 | 500 | 18:24 | 18:50 | 1:54 | 91 | 114 | 26 | Test |
| 20230621 | 1 | 1 | 641 | 5 | 900 | 18:53 | 19:19 | 2:20 | 117 | 140 | 26 | Test |
| 20230621 | 1 | 1 | 641 | 6 | 1400 | 19:21 | 19:48 | 2:47 | 143 | 167 | 26 | Test |
| 20230621 | 1 | 2 | 710 | 1 | 0 | 16:48 | 17:18 | 0:30 | 0 | 30 | 26 | Test |
| 20230621 | 1 | 2 | 710 | 2 | 50 | 17:20 | 17:52 | 1:02 | 33 | 62 | 26 | Test |
| 20230621 | 1 | 2 | 710 | 3 | 150 | 17:54 | 18:20 | 1:28 | 65 | 88 | 26 | Test |
| 20230621 | 1 | 2 | 710 | 4 | 500 | 18:24 | 18:50 | 1:54 | 91 | 114 | 26 | Test |
| 20230621 | 1 | 2 | 710 | 5 | 900 | 18:53 | 19:19 | 2:20 | 117 | 140 | 26 | Test |
| 20230621 | 1 | 2 | 710 | 6 | 1400 | 19:21 | 19:48 | 2:47 | 143 | 167 | 26 | Test |
We observed that there was oxygen consumption in the dark and slow photosynthesis rates at low light levels that increased as light increased. At the highest level we could also see rates leveling off as expected! Ariana will work on analyzing this data to see if we need to adjust the light protocol.
Labeling tubes
We labeled tubes in preparation for sampling. Each type of tube has a specific color and letter prefix to help us identify. We will be sampling cell density and ITS2 samples tomorrow and labeled tubes in preparation for these assays. Size/cell density samples will have red labels and ITS2 samples will have green labels.
For ITS2 and cell density, we will sample n=30 larvae per sample and sample n=3 tubes per tank/n=6 tubes per symbiont type. We will sample these metrics throughout our experiments.
Environmental measurements
| 6/21/23 | 1726 | C1 | -49.8 | 8.03 | 27.24 | 33 | 14 | 3 | 20230617 |
|---|---|---|---|---|---|---|---|---|---|
| 6/21/23 | 1727 | C2 | -49.5 | 8.02 | 27.06 | 33 | 16 | 4 | 20230617 |
| 6/21/23 | 1728 | C3 | -49.9 | 8.03 | 27.22 | 33 | 15 | 5 | 20230617 |
| 6/21/23 | 1729 | D1 | -48.7 | 8.01 | 27.44 | 33 | 25 | 3 | 20230617 |
| 6/21/23 | 1730 | D2 | -49.9 | 8.03 | 27.29 | 33 | 14 | 2 | 20230617 |
| 6/21/23 | 1731 | D3 | -49.7 | 8.02 | 27.25 | 33 | 15 | 4 | 20230617 |
| 6/21/23 | 1732 | NB1 | -49.7 | 8.02 | 27.38 | 33 | 20 | 3 | 20230617 |
| 6/21/23 | 1733 | NB2 | -48.7 | 8.03 | 27.34 | 33 | 17 | 2 | 20230617 |
| 6/21/23 | 1734 | NB3 | -49.8 | 8.02 | 27.33 | 33 | 18 | 1 | 20230617 |
| 6/21/23 | 1735 | WT1 | -49.5 | 8.02 | 27.39 | 33 | 10 | 4 | 20230617 |
| 6/21/23 | 1736 | WT2 | -50 | 8.03 | 27.48 | 33 | 20 | 3 | 20230617 |
| 6/21/23 | 1737 | WT3 | -50 | 8.03 | 27.36 | 33 | 20 | 2 | 20230617 |
Experimental design
We will add Wildtype larvae into our experimental design as well! This will allow us to compare symbiont types and any differences between wild and selected parent groups.
We will also use non-bleached parent mixed symbiont groups in order to have sufficient sample size.
Ariana worked on updating metadata and sampling information.
We will likely make n=2 tanks per type: Wiltype 1-2, C 1-2, and Mixed 1-2
20 June 2023
Rearing embryos
Embryos were cleaned and maintained all night and are looking good! No major mortality and cultures are staying clean. Checked every 1-2 hours throughout the day and evening. The cultures look great!
Setting up SDR and respirometry equipment
We set up the SDR and lights in incubators. We did the following:
- Cut holes in the shelves so that we can set lights on the shelves and not have light be impacted
- Determine light percentages for each desired light level for larval PI curves. These are percentages for all channels (but 0% moonlight) and PAR values measured with the Apogee.
| Light % | PAR |
|---|---|
| 0 | 0 |
| 5 | 55 |
| 10 | 138 |
| 15 | 260 |
| 25 | 468 |
| 35 | 667 |
| 50 | 924 |
| 75 | 1286 |
| 90 | 1456 |
| 100 | 1548 |
- Set up SDR equipment
- Conduct SDR calibration with 0% and 100% oxygen saturated seawater. We will need to do this again on the first run of each day.
- Run test round with n=5 larvae in a few wells
- Organize bench area
We also ran a test PI curve running 10 minute consecutive intervals at 0, 130, 450, and 900 PAR. P rates changed over light levels. If we can use the consecutive PI curve method, we can even try running PI curves at multiple temperatures (26-29-32-35) for example.
Ariana tested temperatures for the incubators with lights. With doors closed the incubators held temperature (26°C) with lights at 450 PAR just fine. The incubators went to 10°C without lights. Colder temperatures will require the door to be open if lights are on.
Counting larvae in conicals
Ariana conducted estimated larval density counts for each C, D, and NB conical. To determine volume of each conical Ariana filled a test conicals with water. The conicals have 15 L total volume when filled.
Conicals were stirred well to homogenize larval density in the conical. Triplicate 5 mL samples were taken and the number of larvae were counted in the sample. I then calculated the total number of larvae in each conical to help us make decisions on which larval groups to use.
| Tank | Total Vol | Sample Vol | Rep | Larvae | Mean | Total Larvae |
|---|---|---|---|---|---|---|
| C1 | 15L | 5mL | 1 | 10 | 10 | 30000 |
| C1 | 15L | 5mL | 2 | 6 | ||
| C1 | 15L | 5mL | 3 | 14 | ||
| C2 | 15L | 5mL | 1 | 16 | 17.7 | 53100 |
| C2 | 15L | 5mL | 2 | 17 | ||
| C2 | 15L | 5mL | 3 | 20 | ||
| C3 | 15L | 5mL | 1 | 21 | 26.3 | 78900 |
| C3 | 15L | 5mL | 2 | 28 | ||
| C3 | 15L | 5mL | 3 | 30 | ||
| D1 | 15L | 5mL | 1 | 10 | 14 | 42000 |
| D1 | 15L | 5mL | 2 | 14 | ||
| D1 | 15L | 5mL | 3 | 16 | ||
| D2 | 15L | 5mL | 1 | 5 | 4 | 12000 |
| D2 | 15L | 5mL | 2 | 4 | ||
| D2 | 15L | 5mL | 3 | 3 | ||
| D3 | 15L | 5mL | 1 | 3 | 3 | 9000 |
| D3 | 15L | 5mL | 2 | 1 | ||
| D3 | 15L | 5mL | 3 | 3 | ||
| Bucket C1 | 15L | 5mL | 1 | 13 | 11 | 22000 |
| Bucket C1 | 15L | 5mL | 2 | 8 | ||
| Bucket C1 | 15L | 5mL | 3 | 12 | ||
| Bucket C2 | 15L | 5mL | 1 | 12 | 11 | 22000 |
| Bucket C2 | 15L | 5mL | 2 | 8 | ||
| Bucket C2 | 15L | 5mL | 3 | 13 |
Based on these numbers, we can proceed with using Durusdinium and Cladocopium larvae and not use the mixed non-bleached cultures. In order to do this, we need to combine the Durusdinium cultures and also combine the Cladocopium cultures across days to ensure the developmental time of C and D are the same. We will work on redistributing these cultures in the morning. For example, if we add 20% more larvae of Durusdinium from 6/17 to the 6/18 cultures, we will add the same proportion to the Cladocopium cultures. If there aren’t enough in the morning we may still need to use the mixed NB cultures instead.
Environmental measurements
| date | time | tank | group | pH.mV | pH.nbs | temp.C | sal.psu | flow.mL.5s | par | tris.date | notes |
|---|---|---|---|---|---|---|---|---|---|---|---|
| 6/20/23 | 1129 | C1 | Cladocopium | -48 | 7.99 | 26.6 | 33 | 3 | 15 | 20230617 | |
| 6/20/23 | 1130 | C2 | Cladocopium | -47.3 | 7.98 | 26.56 | 33 | 2 | 12 | 20230617 | |
| 6/20/23 | 1131 | C3 | Cladocopium | -47.9 | 7.99 | 26.63 | 33 | 3 | 16 | 20230617 | |
| 6/20/23 | 1132 | D1 | Durusdinium | -48 | 7.99 | 26.54 | 33 | 2 | 12.5 | 20230617 | |
| 6/20/23 | 1133 | D2 | Durusdinium | -48 | 7.99 | 26.46 | 33 | 1 | 17.5 | 20230617 | |
| 6/20/23 | 1135 | D3 | Durusdinium | -48.2 | 8 | 26.7 | 33 | 0 | 10 | 20230617 | |
| 6/20/23 | 1136 | Bucket C1 | Bucket | -44.4 | 7.93 | 26.99 | 33 | 0 | 0 | 20230617 | |
| 6/20/23 | 1137 | Bucket C2 | Bucket | -44.8 | 7.94 | 27.29 | 33 | 0 | 0 | 20230617 |
Taking extra samples
Ariana collected n=12 samples of approx. 30-40 larvae for extra or practice samples. These were taken from the bucket of extra Cladocopium larvae. Larvae were added to tubes, water was removed, and they were either snap frozen (n=6) or preserved in RNA/DNA shield (n=6).
| Date | Time | Tube Number | Volume larvae | Symbiont | Tank | Preservation Method | Storage | Color |
|---|---|---|---|---|---|---|---|---|
| 20230620 | 1230 | E1 | 100uL | Cladocopium | C Bucket | Snap frozen | -80C | Orange |
| 20230620 | 1230 | E2 | 100uL | Cladocopium | C Bucket | Snap frozen | -80C | Orange |
| 20230620 | 1230 | E3 | 100uL | Cladocopium | C Bucket | Snap frozen | -80C | Orange |
| 20230620 | 1230 | E4 | 100uL | Cladocopium | C Bucket | Snap frozen | -80C | Orange |
| 20230620 | 1230 | E5 | 100uL | Cladocopium | C Bucket | Snap frozen | -80C | Orange |
| 20230620 | 1230 | E6 | 100uL | Cladocopium | C Bucket | Snap frozen | -80C | Orange |
| 20230620 | 1230 | E7 | 100uL | Cladocopium | C Bucket | RNA/DNA shield | -80C | Orange |
| 20230620 | 1230 | E8 | 100uL | Cladocopium | C Bucket | RNA/DNA shield | -80C | Orange |
| 20230620 | 1230 | E9 | 100uL | Cladocopium | C Bucket | RNA/DNA shield | -80C | Orange |
| 20230620 | 1230 | E10 | 100uL | Cladocopium | C Bucket | RNA/DNA shield | -80C | Orange |
| 20230620 | 1230 | E11 | 100uL | Cladocopium | C Bucket | RNA/DNA shield | -80C | Orange |
| 20230620 | 1230 | E12 | 100uL | Cladocopium | C Bucket | RNA/DNA shield | -80C | Orange |
19 June 2023
Rearing embryos
Embryos were maintained at night by CRL staff. At 07:30 Ariana came into lab and did a cleaning due to the morning mortality. The buckets of embryos from 6/17 were clean and only needed minimal care. C conicals looked good and also needed pretty minimal cleaning. The D conicals had higher mortality and are at lower density. These required a more thorough cleaning to remove the dead material.
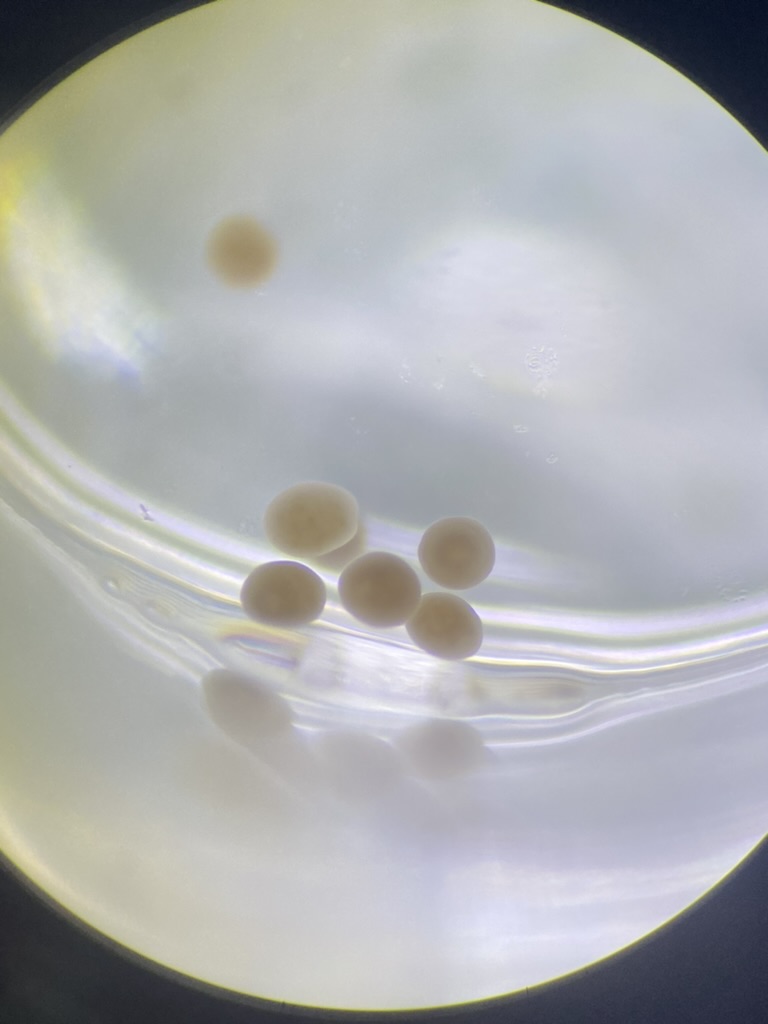
Embryos are at the blastula stage from the 6/17 cohort. There are some entering the planula stage too! We took some fun pictures today.
Water flow was raised to 15-20 mL per 5 sec at 08:00. D1 has the lowest density, D2 and D3 are better, but still lower than optimal. We will require about 15,000 larvae of D and C. We will assess the conicals today and consider alternatives to make sure we have enough sample size.
One option is combining 6/17 and 6/18 cultures. Since we will be working with mature larvae, the one day developmental difference is not an issue. This will also add more parent colonies to the cultures. We would combine both the D and C cultures so that each symbiont type is treated equally.
The other option is to compare our bleached parents Cladocopium cultures with Ford’s non-bleached mixed symbiont cultures. These cultures have a majority D with some C. These cultures have many larvae, so this is a good option.
We will keep all options open until the time we need to decide.
At 12:15 Ariana and Jill drained D1 since it had very few larvae (<500) and added these larvae to D2. We then drained the D bucket and added it to the D1 conical, providing a 6/17 D culture. We did water changes in the C buckets at 12:30.
All corals were babysat the rest of the day with mixing and cleaning if needed every hour. Cultures were stable.
Embryos were cared for every hour for the day and night.
At 2000, Ariana noticed that Ford’s non-bleached mixed cultures were looking dirty. Ariana cleaned these with kim wipes and they looked good after cleaning. They will be babysat tonight too by CRL staff.
Environmental measurements
Morning environmental measurements:
| date | time | tank | group | pH.mV | pH.nbs | temp.C | sal.psu | flow.mL.5s | par | tris.date | notes |
|---|---|---|---|---|---|---|---|---|---|---|---|
| 6/19/23 | 952 | C1 | Cladocopium | -47 | 7.98 | 26.67 | 33 | 2 | 15 | 20230617 | |
| 6/19/23 | 953 | C2 | Cladocopium | -47.9 | 7.99 | 26.64 | 33 | 1 | 15 | 20230617 | |
| 6/19/23 | 954 | C3 | Cladocopium | -48.1 | 8 | 26.8 | 33 | 3 | 18 | 20230617 | |
| 6/19/23 | 955 | D1 | Durusdinium | -48.1 | 8 | 26.86 | 33 | 1 | 20 | 20230617 | |
| 6/19/23 | 956 | D2 | Durusdinium | -48.3 | 8 | 26.8 | 33 | 0 | 17 | 20230617 | |
| 6/19/23 | 1000 | D3 | Durusdinium | -48.3 | 8 | 26.73 | 33 | 3 | 18 | 20230617 | |
| 6/19/23 | 1001 | Bucket D | Bucket | -46.3 | 7.96 | 26.05 | 33 | 0 | 0 | 20230617 | |
| 6/19/23 | 1002 | Bucket C1 | Bucket | -48.1 | 8 | 26.14 | 33 | 0 | 0 | 20230617 | |
| 6/19/23 | 1003 | Bucket C2 | Bucket | -48.4 | 8 | 26.23 | 33 | 0 | 0 | 20230617 |
Buckets are at similar temperatures. We will monitor these to make sure they dont get too warm or deviate from the conicals.
Afternoon environmental measurements:
| date | time | tank | pH.mV | pH.nbs | temp.C | sal.psu | flow.mL.5s | par | tris.date | ||
|---|---|---|---|---|---|---|---|---|---|---|---|
| 6/19/23 | 1147 | C1 | -44.8 | 7.93 | 27.12 | 33 | 2 | 15 | 20230617 | 20230617 | |
| 6/19/23 | 1153 | C2 | -48 | 7.99 | 27.04 | 33 | 2 | 15 | 20230617 | 20230617 | |
| 6/19/23 | 1157 | C3 | -48.7 | 8.01 | 27.16 | 33 | 3 | 18 | 20230617 | 20230617 | |
| 6/19/23 | 1148 | D1 | -47.6 | 7.99 | 27.14 | 33 | 4 | 17 | 20230617 | 20230617 | |
| 6/19/23 | 1151 | D2 | -45.9 | 7.95 | 27.13 | 33 | 1 | 16 | 20230617 | 20230617 | |
| 6/19/23 | 1155 | D3 | -48.5 | 8 | 27.03 | 33 | 0 | 12 | 20230617 | 20230617 | |
| 6/19/23 | 1200 | Bucket D | -46.9 | 7.97 | 26.96 | 33 | 0 | 0 | 20230617 | 20230617 | |
| 6/19/23 | 1202 | Bucket C1 | -48 | 7.99 | 27.05 | 33 | 0 | 0 | 20230617 | 20230617 | |
| 6/19/23 | 1204 | Bucket C2 | -48 | 7.99 | 27.29 | 33 | 0 | 0 | 20230617 | 20230617 |
Evening environmental measurements:
| date | time | tank | pH.mV | pH.nbs | temp.C | sal.psu | flow.mL.5s | par | tris.date | |
|---|---|---|---|---|---|---|---|---|---|---|
| 6/19/23 | 1940 | C1 | -49.2 | 8.01 | 26.83 | 33 | 0 | 0 | 20230617 | |
| 6/19/23 | 1942 | C2 | -49.5 | 8.02 | 26.87 | 33 | 0 | 0 | 20230617 | |
| 6/19/23 | 1943 | C3 | -49.4 | 8.02 | 26.88 | 33 | 0 | 0 | 20230617 | |
| 6/19/23 | 1945 | D1 | -46.8 | 7.97 | 26.8 | 33 | 0 | 0 | 20230617 | |
| 6/19/23 | 1946 | D2 | -49.3 | 8.02 | 26.97 | 33 | 0 | 0 | 20230617 | |
| 6/19/23 | 1947 | D3 | -49.6 | 8.02 | 26.73 | 33 | 0 | 0 | 20230617 | |
| 6/19/23 | 1948 | NB1 | -48.7 | 8 | 26.74 | 33 | 0 | 0 | 20230617 | |
| 6/19/23 | 1949 | NB2 | -49.1 | 8.01 | 26.9 | 33 | 0 | 0 | 20230617 | |
| 6/19/23 | 1950 | NB3 | -49.3 | 8.02 | 26.89 | 33 | 0 | 0 | 20230617 | |
| 6/19/23 | 1951 | NB4 | -49.3 | 8.02 | 26.69 | 33 | 0 | 0 | 20230617 | |
| 6/19/23 | 1953 | NB5 | -49.5 | 8.02 | 26.82 | 33 | 0 | 0 | 20230617 | |
| 6/19/23 | 1954 | NB6 | -49.4 | 8.02 | 26.71 | 33 | 0 | 0 | 20230617 | |
| 6/19/23 | 1955 | NB7 | -49.3 | 8.01 | 26.61 | 33 | 0 | 0 | 20230617 | |
| 6/19/23 | 1956 | NB8 | -49.6 | 8.02 | 26.76 | 33 | 0 | 0 | 20230617 |
18 June 2023 - early morning 19 June 2023
Rearing embryos from 17 June spawning
Cultures were checked frequently and were clean and healthy at 07:30. At 08:00 the cultures had some mortality and were goopey. This has been seen before - it seems that ~08:00 is the time when unfertilized eggs degrade and cause declines in culture quality.
Ariana cleaned the cultures by removing the debris, wiping the surface with kimwipes, and bumping the embryos off the banjo filters.
Flow was increased to 15-20 mL per 5 sec at 08:00 to flush out cloudy water.
C3 had the most mortality and Ariana did an 80% water change. The conical was refilled after about 30 min.
Flow for all conicals was reduced back to 7-10 mL per 5 sec at 09:00.
The D cultures had lower density and lower quality than the C cultures.
Cultures were cleaned every 1-2 hours.
Environmental measurements
Morning measurements:
| Date | Time | Tank | pH (mV) | pH (nbs) | temp (C) | sal (psu) | flow (mL per 5 sec) | light (PAR) | Tris date |
|---|---|---|---|---|---|---|---|---|---|
| 20230618 | 920 | C1 | -47.9 | 7.99 | 26.29 | 33 | 11 | 3 | 20230617 |
| 20230618 | 921 | C2 | -47.4 | 7.98 | 26.39 | 33 | 10 | 2 | 20230617 |
| 20230618 | 922 | C3 | -46.5 | 7.97 | 26.46 | 33 | 14 | 3 | 20230617 |
| 20230618 | 923 | D1 | -47.9 | 7.99 | 26.35 | 33 | 12 | 1 | 20230617 |
| 20230618 | 924 | D2 | -47.8 | 7.99 | 26.51 | 33 | 14 | 2 | 20230617 |
| 20230618 | 925 | D3 | -47.5 | 7.99 | 26.48 | 33 | 10 | 2 | 20230617 |
| 20230618 | 945 | Parent NB1 | -51.1 | 8.05 | 27.84 | 34 | 400 | 196 | 20230617 |
| 20230618 | 946 | Parent NB2 | -50.5 | 8.03 | 27.43 | 34 | 450 | 312 | 20230617 |
| 20230618 | 947 | Parent B1 | -50.7 | 8.03 | 27.52 | 34 | 375 | 268 | 20230617 |
| 20230618 | 948 | Parent B2 | -53.4 | 8.09 | 27.99 | 34 | 450 | 251 | 20230617 |
Afternoon measurements:
| Date | Time | Tank | pH (mV) | pH (nbs) | temp (C) | sal (psu) | flow (mL per 5 sec) | light (PAR) | Tris date |
|---|---|---|---|---|---|---|---|---|---|
| 20230618 | 1709 | C1 | -50.6 | 8.04 | 26.81 | 33 | 1 | 12 | 20230617 |
| 20230618 | 1710 | C2 | -50.7 | 8.04 | 26.41 | 33 | 2 | 10 | 20230617 |
| 20230618 | 1711 | C3 | -50.8 | 8.04 | 27.16 | 33 | 3 | 11 | 20230617 |
| 20230618 | 1712 | D1 | -49.7 | 8.02 | 26.94 | 33 | 0 | 12 | 20230617 |
| 20230618 | 1713 | D2 | -50.6 | 8.04 | 27.16 | 33 | 1 | 14 | 20230617 |
| 20230618 | 1715 | D3 | -50.7 | 8.04 | 27.01 | 33 | 3 | 11 | 20230617 |
Jill’s developmental time series sampling
We sampled for Jill’s developmental time series project at 9am, 2pm, 8pm, and again at 3am. See Jill’s notebook for details.
Spawning prep
Corals were set up as described in the previous night with nets put on the colonies at 18:45.
Our options for tonight, if material are available, are:
- Consolidate yesterdays larvae into n=1 conical per symbiont type and fill n=2 conicals per symbiont type tonight
- Keep yesterdays larvae in buckets and fill n=3 conicals per symbiont type tonight
- Dump yesterdays conicals and fill n=3 conicals per symbiont type tonight
We will make this decision once we see how spawning goes tonight.
Coral spawning!
The corals went bonkers tonight! We had a large and successful spawn. When we began to see many corals spawning we decided to move all of yesterday’s larvae into 5 gallon buckets and clean and reset the conicals for new gametes.
The conicals were drained at 2100 through a seive into 5 gallon buckets. There was 1 bucket for the D conicals pooled together and 2 buckets for the C conicals pooled together. These were covered with a lid and left outside for the night. They will stay outside in shaded areas.
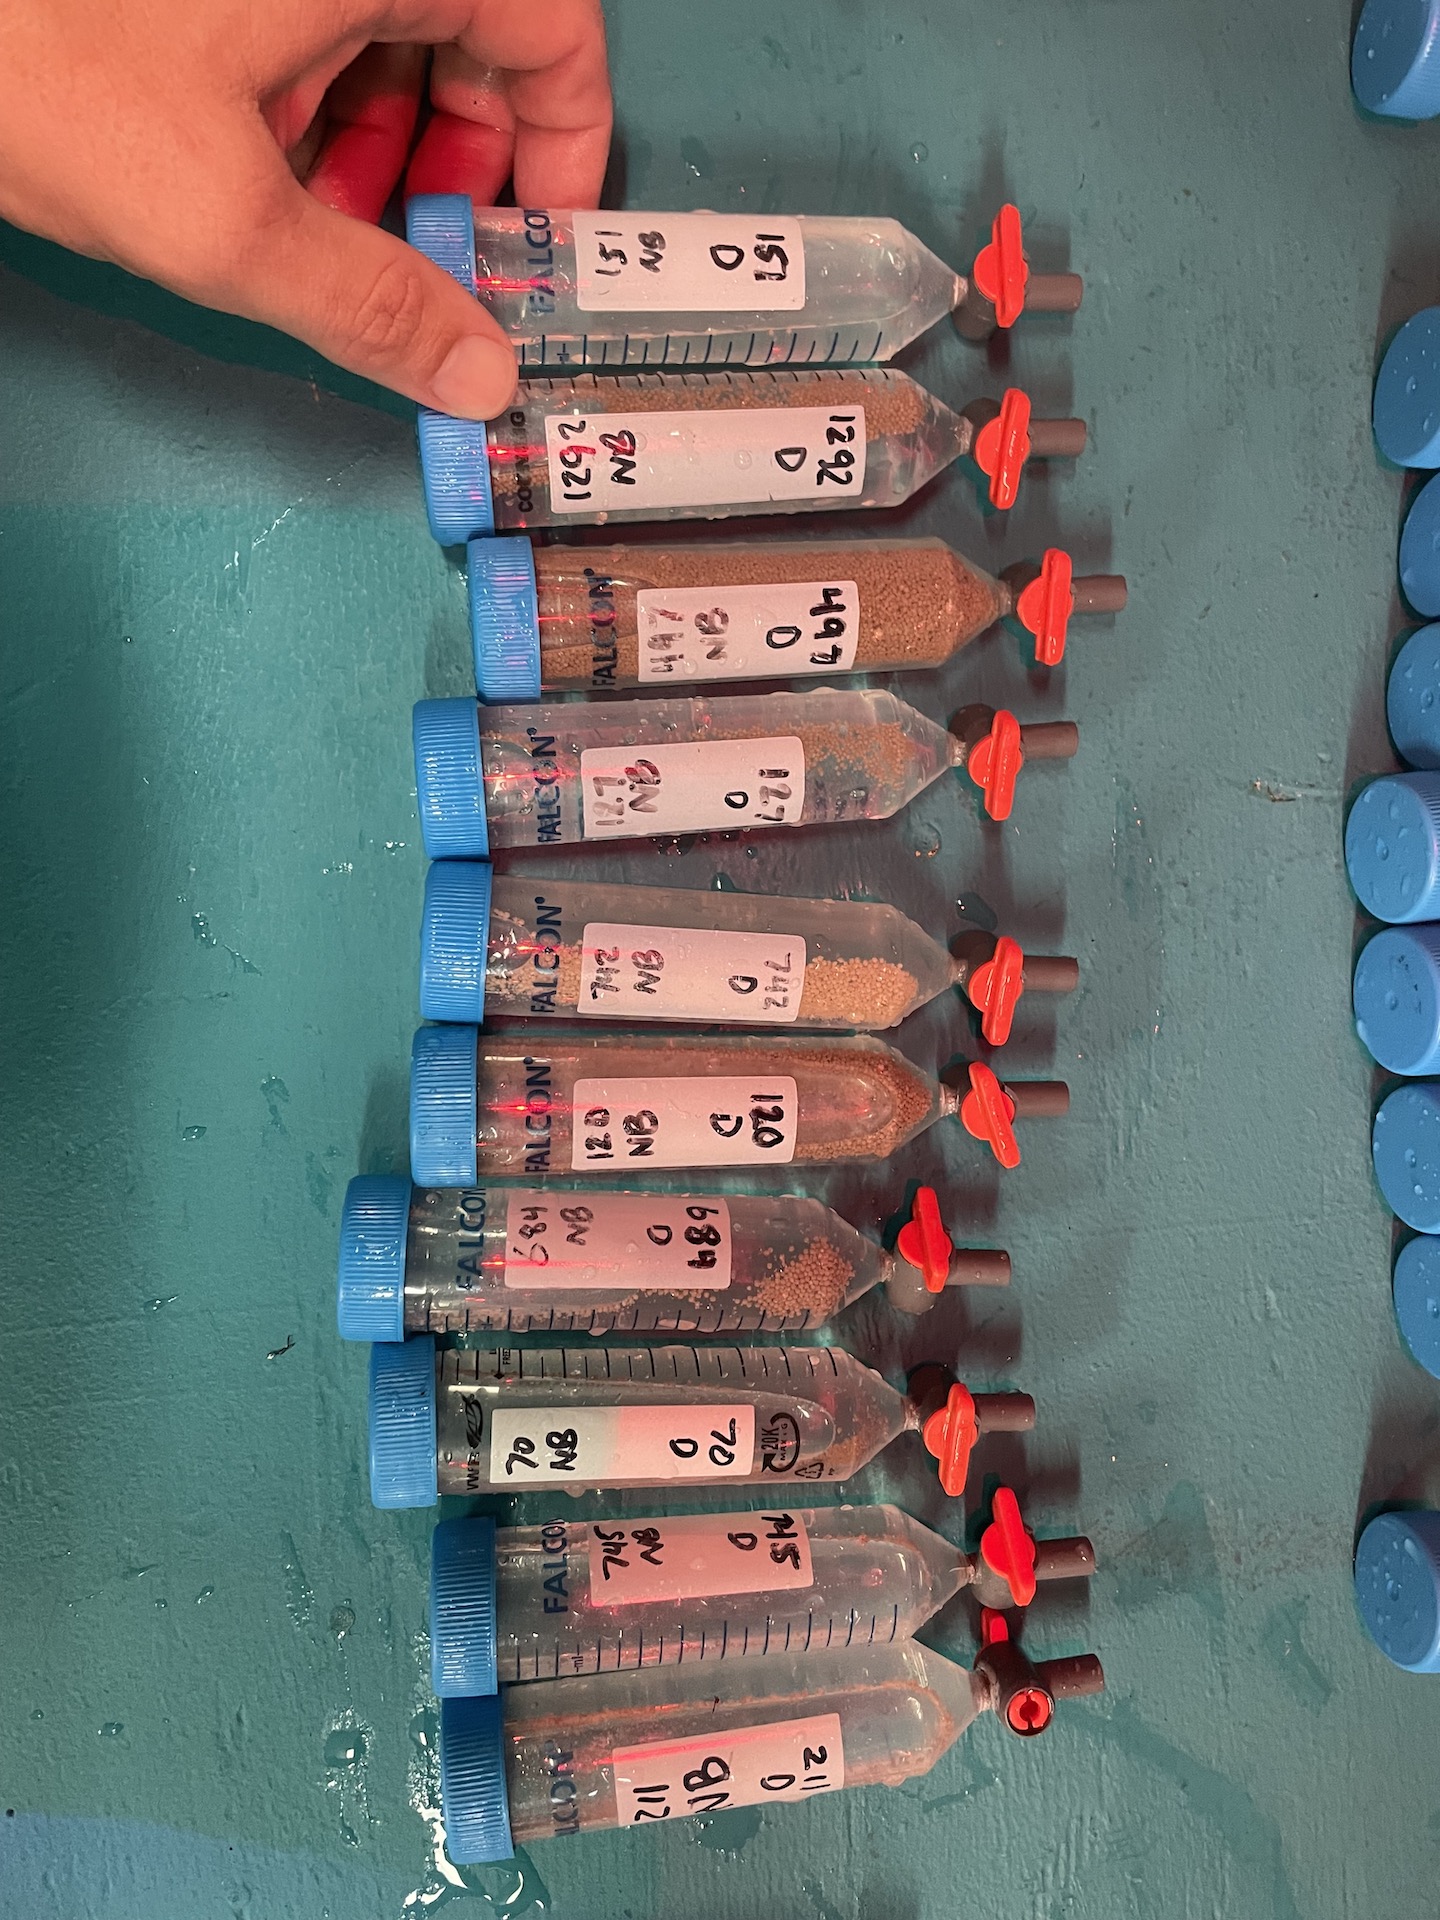
We had many parents spawn and contribute to the gamete pool tonight.
| Date | Parent ID | Bleaching | Symbiont | Volume in Pool | Time Pooled |
|---|---|---|---|---|---|
| 20230618 | 1221 | B | C | Equal across parents, no dominant parent | 21:30 |
| 20230618 | 1213 | B | C | Equal across parents, no dominant parent | 21:30 |
| 20230618 | 1263 | B | C | Equal across parents, no dominant parent | 21:30 |
| 20230618 | 141 | B | C | Equal across parents, no dominant parent | 21:30 |
| 20230618 | 95 | B | C | Equal across parents, no dominant parent | 21:30 |
| 20230618 | 258 | B | C | Equal across parents, no dominant parent | 21:30 |
| 20230618 | 565 | B | C | Equal across parents, no dominant parent | 21:30 |
| 20230618 | 1261 | B | C | Equal across parents, no dominant parent | 21:30 |
| 20230618 | 127 | NB | D | Equal across parents, no dominant parent | 21:30 |
| 20230618 | 497 | NB | D | Equal across parents, no dominant parent | 21:30 |
| 20230618 | 1292 | NB | D | Equal across parents, no dominant parent | 21:30 |
| 20230618 | 120 | NB | D | Equal across parents, no dominant parent | 21:30 |
| 20230618 | 151 | NB | D | Equal across parents, no dominant parent | 21:30 |
| 20230618 | 742 | NB | D | Equal across parents, no dominant parent | 21:30 |
| 20230618 | 211 | NB | D | Equal across parents, no dominant parent | 21:30 |
| 20230618 | 70 | NB | D | Equal across parents, no dominant parent | 21:30 |
| 20230618 | 684 | NB | D | Equal across parents, no dominant parent | 21:30 |
| 20230618 | 745 | NB | D | Equal across parents, no dominant parent | 21:30 |
Gametes collected from these colonies were all pooled together at 21:30 and allocated into falcon tubes (3-5 mL per tube). Tubes were gently rocked from 21:30-22:30 until bundles had broken up. Sperm water was removed at 22:30-22:45 and the remaining eggs and sperm water were added to conicals without water flow. Embryos were then allowed to sit in conicals for about 20-30 minutes. This gives an additional rinse to the eggs and a final chance for bundles to break and fertilization to occur.
4 mL of gametes were added to C conicals (more material available) and 2.5 mL added to D conicals.
Between 23:00 and 23:30, 90% of water was drained from the conical to remove any sperm. The banjo filter was then put on the conical and the water turned on at ~7-9 mL per 5 sec and allowed to fill slowly.
After this point, embryos are gently stirred, debris removed, and bubble bumped every ~1 h throughout the night by CRL members and Ariana.
17 June 2023 - early morning 18 June 2023
Checking Jill’s developmental time series test samples
At 3:00am Jill checked the wildtype developmental time series samples. She observed that the ambient embryos were developing and looked healthy. The high temperature samples were more opaque and had more mortality. This is likely because they were on the top shelf of the incubator. We will check the temperature loggers to see what the temperatures were on that shelf. We may adjust the temperatures down a degree if needed for tonight.
At 8:00am we looked at the embryos again and did a practice sample protocol. The protocol we tested was pouring all larvae into a cell strainer from one falcon tube and then taking out all larvae in a known volume of water. This volume of larvae will then be split in half - one sample for molecular and one for physiology. If this protocol works, we will drastically reduce the number of falcon tubes we need which will help maintain air flow in the incubators and reduce loading time.
Full details are in Jill’s notebook.
Calibrating temperature and pH probes
Ariana calibrated the pH probe and set up probes for daily measurements.
Digital thermometer: Traceable 4000 NS 200390599
- no calibration needed
Apogee light sensor: Apogee Model MQ-510 SN 3706
- no calibration needed
Thermoscientific Orion Star: A221 pH meter SN K12290
- Calibrated pH with tris. Note that this probe does NOT measure conductivity. We will need to use a refractometer for salinity measurements.
Salinity refractometer: DD Aquarium Solutions H2Ocean precision equipment
- This refractometer is the CRL’s and we will use it to check salinity daily. Records in ppt units.
Calibrated pH probe in Tris buffer (Batch T27 packaged 3/5/15 Dickson CO2 lab @ UCSD at 11:42.
| Date | Temp.Tris | mV.Tris |
|---|---|---|
| 20230617 | 23.69 | -64.2 |
| 20230617 | 25.03 | -62.6 |
| 20230617 | 25.98 | -61.4 |
| 20230617 | 26.64 | -60.4 |
| 20230617 | 27.40 | -59.5 |
| 20230617 | 28.24 | -58.4 |
| 20230617 | 28.96 | -57.4 |
| 20230617 | 29.73 | -56.4 |
| 20230617 | 30.17 | -55.8 |
| 20230617 | 30.57 | -55.5 |
| 20230617 | 31.25 | -54.2 |
| 20230617 | 31.74 | -53.6 |
| 20230617 | 32.08 | -53.1 |
| 20230617 | 32.40 | -52.5 |
| 20230617 | 32.67 | -52.3 |
Daily measurements
Ariana recorded daily measurements in empty, clean larval conicals and in parent holding tanks at 1230-1300.
| Date | Time | Tank | pH (mV) | pH (nbs) | temp (C) | sal (psu) | flow (mL per 5 sec) | light (PAR) | Tris date | Notes |
|---|---|---|---|---|---|---|---|---|---|---|
| 20230617 | 1251 | C1 | -52 | 8.06 | 26.12 | 34 | 20 | 1 | 20230617 | Before embryos added |
| 20230617 | 1253 | C2 | -51.9 | 8.06 | 27 | 34 | 24 | 0 | 20230617 | Before embryos added |
| 20230617 | 1254 | C3 | -52 | 8.06 | 26.46 | 34 | 21 | 1 | 20230617 | Before embryos added |
| 20230617 | 1255 | D1 | -51.9 | 8.06 | 26.98 | 34 | 25 | 2 | 20230617 | Before embryos added |
| 20230617 | 1257 | D2 | -51.8 | 8.06 | 26.56 | 34 | 20 | 0 | 20230617 | Before embryos added |
| 20230617 | 1258 | D3 | -51.9 | 8.06 | 26.86 | 34 | 22 | 1 | 20230617 | Before embryos added |
| 20230617 | 1303 | Parent NB1 | -57.1 | 8.15 | 27.86 | 33 | 350 | 597 | 20230617 | |
| 20230617 | 1304 | Parent NB2 | -58.6 | 8.18 | 27.99 | 33 | 400 | 574 | 20230617 | |
| 20230617 | 1306 | Parent B1 | -59.5 | 8.19 | 28.15 | 33 | 375 | 564 | 20230617 | |
| 20230617 | 1305 | Parent B2 | -57.6 | 8.16 | 28.06 | 33 | 350 | 610 | 20230617 |
Spawning and embryo rearing
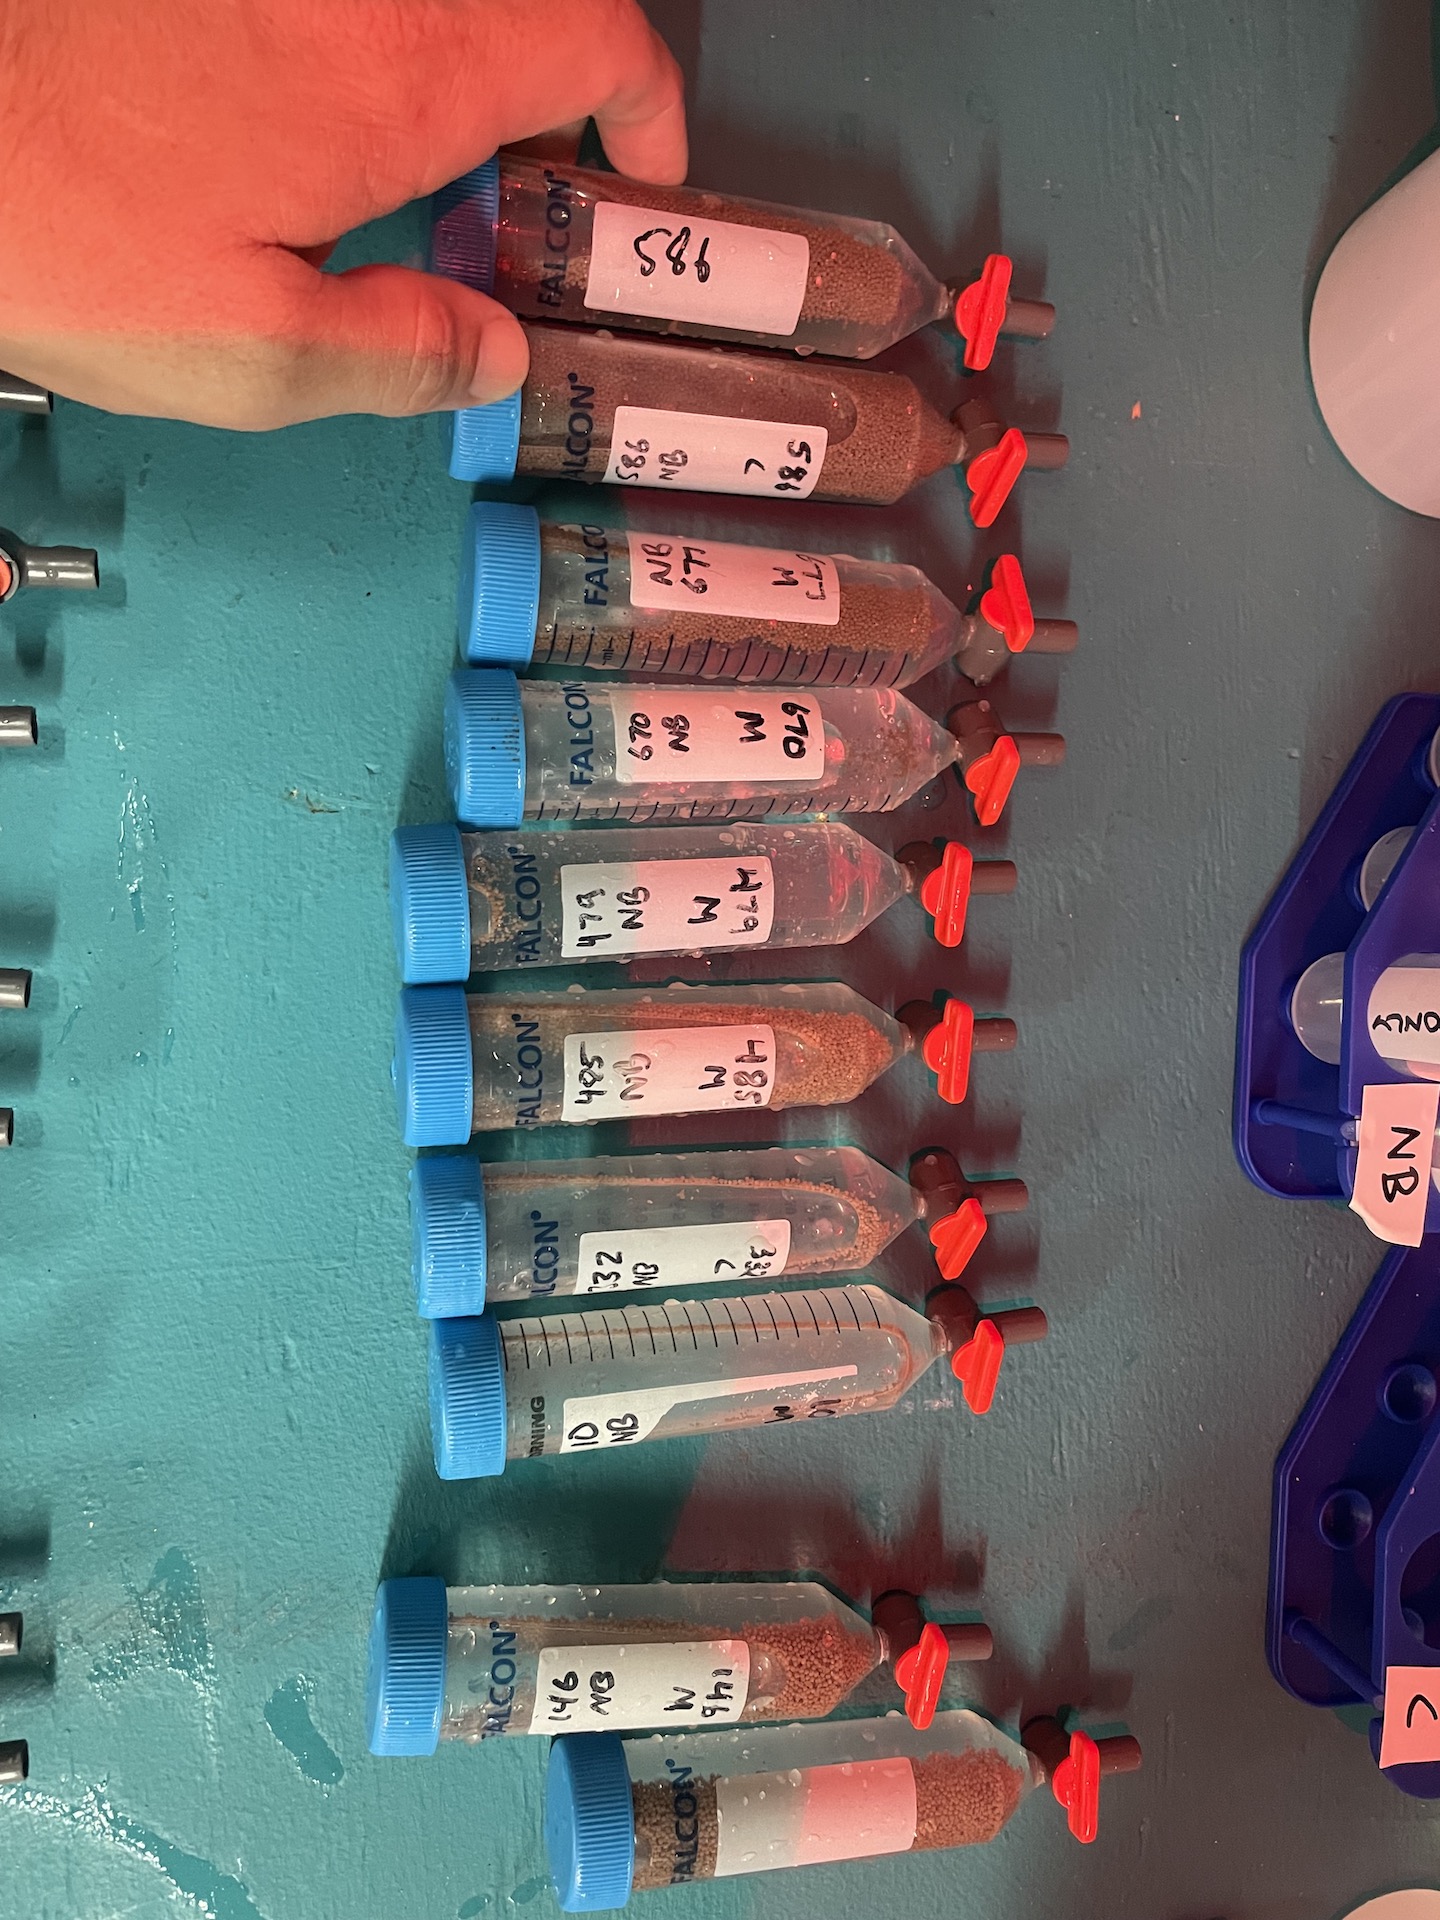
We netted the adult colonies at 18:45 as described for previous nights. 3 C colonies and 3 D colonies spawned with sufficient amount to use in pooled fertilization.
This picture shows how the gametes are captured in floating falcon tubes with stop valves. When there are 2-5 mL of gametes, the tubes are removed and capped and brought into the lab for pooling. Some parents produced more than others and their relative contribution to the pool is recorded below. Note that tonight the C dominated coral pool included two bleached phenotypes and one non-bleached phenotype.
Ideally, we would have n=5 or more parents contribute to the pool in relatively equal proportions and we would not have a mix of bleaching phenotypes in the same symbiont phenotype. Tonight these were the only parents that produced enough for pooled fertilization. We will rear these embryos through tomorrow. If tomorrow’s spawn is better we can replace them and if not we still have material for our experiment!
| Date | Parent ID | Bleaching | Symbiont | Volume in Pool | Time Pooled |
|---|---|---|---|---|---|
| 20230617 | 632 | B | C | 20% | 21:15 |
| 20230617 | 586 | NB | C | 60% | 21:15 |
| 20230617 | 1213 | B | C | 20% | 21:15 |
| 20230617 | 742 | NB | D | 33% | 21:15 |
| 20230617 | 70 | NB | D | 33% | 21:15 |
| 20230617 | 684 | NB | D | 33% | 21:15 |
The gametes from parents were pooled at 21:15 after collection from spawning and distrubuted into falcon tubes with 5 mL of gametes of either C or D symbiont pools. These were then gently rocked by hand until 22:30-22:45 when all bundles were broken and sperm and egg had time to fertilize.
Interestingly, I noticed that the colors of bundles from C and D were distinctly different. C bundles were consistently dark brown and D bundles were a mix of light brown to dark brown.
This was really interesting!
After fertilization, the sperm water was removed and embryos were rinsed with 1 µm FSW. Embryos were then added to n=3 conicals for each symbiont type: conicals C1, C2, C3, D1, D2, and D3. Embryos were divided approximately equally for each pool across the three conicals by FD at 22:00-22:30.
The conicals were then drained ~90% to provide an additional embryo rinse. Water was then turned on at ~7-8 mL per 5 seconds (84-96 mL per min) and allowed to fill. The banjo filters were placed in each conical. This was done between 22:40 and 22:55.
Note that due to the amount of gametes available the C coral conicals are more dense than the D corals. Tomorrow we will do a count estimate to see how many larvae are in each conical.
Every 60 minutes or so Ariana will check the cultures, stir/swirl the embryos, check water flow, and bubble bump the embryos off of the banjo filter. Conicals were fully refilled by 00:15.
Cultures looked clean and healthy all through the night and into the early morning.
Environmental measurements
Ariana and Jill recorded environmental measurements in the larval conicals.
| Date | Time | Tank | pH (mV) | pH (nbs) | temp (C) | sal (psu) | flow (mL per 5 sec) | light (PAR) | Tris date | Notes | ||||||||||||||||
|---|---|---|---|---|---|---|---|---|---|---|---|---|---|---|---|---|---|---|---|---|---|---|---|---|---|---|
| 20230618 | 0049 | C1 | -50.1 | 8.03 | 26.68 | 34 | 8 | 0 | 20230617 | Night measurement, no PAR; after embryos added | ||||||||||||||||
| 20230618 | 0051 | C2 | -50.2 | 8.03 | 26.61 | 34 | 7 | 0 | 20230617 | |||||||||||||||||
| 20230618 | 0052 | C3 | -50.2 | 8.03 | 26.73 | 34 | 7.5 | 0 | 20230617 | |||||||||||||||||
| 20230618 | 0047 | D1 | -49.2 | 8.01 | 26.56 | 34 | 7.5 | 0 | 20230617 | |||||||||||||||||
| 20230618 | 0050 | D2 | -49.7 | 8.02 | 26.65 | 34 | 6 | 0 | 20230617 | |||||||||||||||||
| 20230618 | 0052 | D3 | -50.5 | 8.04 | 26.74 | 34 | 8 | 0 | 20230617 |
Developmental time series sampling
Jill and Ariana loaded tubes for Jill’s project and conducted sampling of fertilized egg and 4 hour post fertilization time points. See Jill’s notebook for details.
16 June 2023
Set up
Jill and Ariana arrived at HIMB and worked on unpacking supplies and preparing equipment. Ariana filled liquid nitrogen at University of Hawaii at Manoa in the dry shipper. The dry shipper was fully charged and then filled with liquid to act as a dewar for our field work.
The lab space was cleaned and organized.
Spawning protocols and overview
We expect that spawning may occur tonight (June 16), tomorrow (June 17), or Sunday (June 18). We will be doing the following activities tonight if spawning occurs.
We will first place nets over the parent colonies. The Coral Resilience Lab (CRL) has collected coral colonies with known symbiont communities and we will collect gametes from those that are dominated (>90%) by either Cladocopium or Durusdinium according to previous ITS2 sequencing in the CRL. Symbiont community of the parents is passed to the offspring as indicated by previous CRL data. These colonies are kept in flow through tanks until spawning.
Before spawning (about 8pm) we will place nets over the colonies with buoyant collection cups. During the spawning window (20:45-21:15), the colonies will release gametes that will float into the collection cups. Those cups will then be brought into the lab where we will pool gametes within parent symbiont type and allow for eggs and sperm to separate and fertilize. This will be conducted in falcon tubes with approximately 5 mL of gametes in 45 mL of filtered seawater (1 µm FSW).
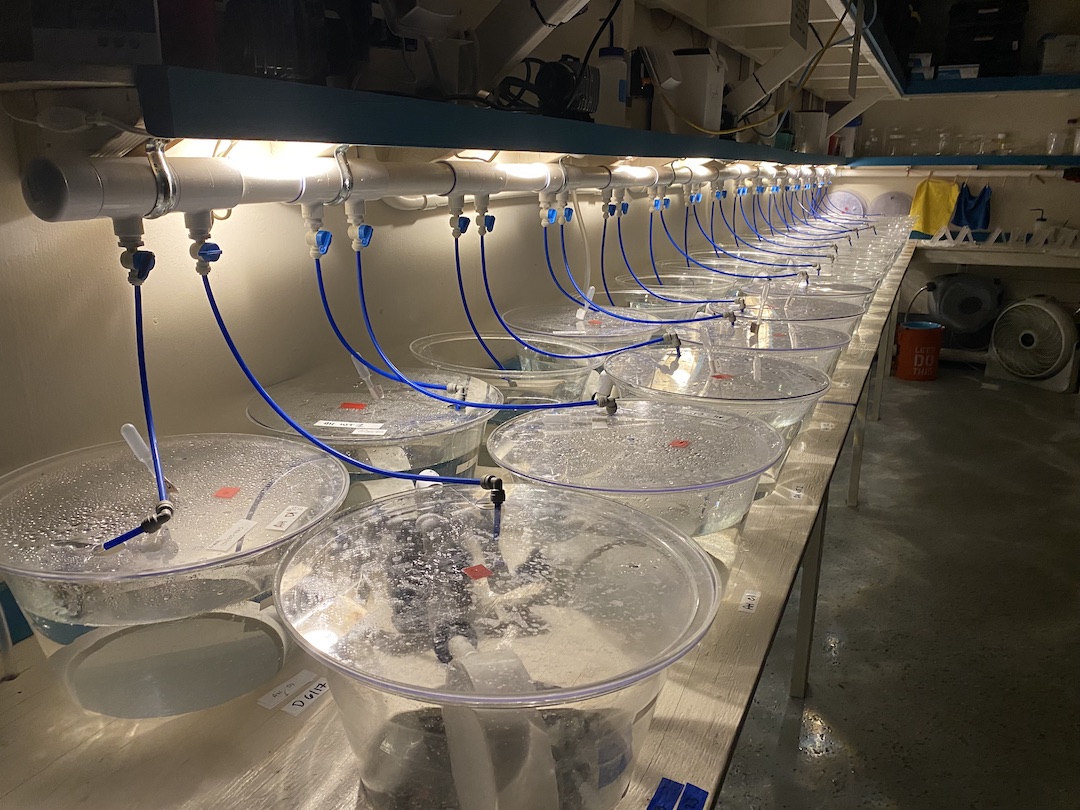
After about 1 hour of fertilization (~23:00), one falcon tube of fertilized eggs will be added into 1 20 L conical rearing containers in the CRL. These conicals are equiped with flow through FSW (1 µm) and banjo filters (123 µm mesh).
Before adding to the conicals, the sperm and water will be removed with a seriological pipette and rinsed once with FSW. The fertilized eggs will then be gently poured into the conicals.
We will use n=3 conicals for Cladocopium dominated larvae (C) and n=3 for Durudinium dominated larvae (D).
During the first few days of rearing, the larvae will have constant “babysitting” by CRL and our researchers. Every hour, embryos will be checked to remove dead material (using a transfer pipette), clean the surface of the water (using a gentle wipe of a kim wipe across the surface), and check water flow and gently “bubble bump” the embryos off the bottom of the conical using a tube attached to a bulb.
If needed after a few days of development, we will evenly re distrubute the embryos across the conical tanks prior to the start of experiments.
During spawning, we will record which parents contributed to each pool and in which proportions.
Jill Ashey will also be conducting spawning research and will be collecting a developmental time series for molecular and physiological measurements. Full details will be recorded in her notebook.
Logger launch
Hobo Tidbit loggers (n=6) were deployed in two incubators to check incubator accuracy. We placed one logger on each of three shelves in two incubators, one set at 30°C and one set at 27°C. After running for 1.5 hours, we checked the temperature loggers. We found that the average of the 30°C was 30.68° and the average temprature of the 27°C incubator was 26.87°C. But there was variation by 0.8-1.1°C between shelves, with the top shelf being the warmest and the lowest shelf the coolest. This is becuase the incubators were filled with falcon tubes for developmental sampling, so there was limited airflow. We will reduce the number of falcon tubes in the incubators and rotate the falcon tubes between shelfs during the sampling time series to account for these effects.
Preparing incubators
Incubators were plugged in, set up,
Jill’s project - developmental time series
We prepared supplies for Jill’s project today including labeling tubes and boxes, preparing falcon tubes, and discussing sampling protocols. Full details are recorded in her notebooks.
Spawning
Overall spawning was light tonight, as expected. This is a good sign that spawning will likely happen on Saturday or Sunday nights. Here are some more details:
Wildtype: Developmental time series
CRL’s field team went to Reef 13 in Kaneohe Bay to collect gametes from wildtype spawning slicks. They reported that spawning was light and they were able to collect some gametes for preliminary testing. We used two falcon tubes of gametes (5 mL gametes per tube in 40 mL FSW) for density testing for Jill’s developmental time series. Falcon tubes were allowed to incubate on the bench top until all bundles were broken at approximately 11pm. We then loaded falcon tubes at different densities (n=3 per density level) by adding 10, 50, 100, 200, and 500 µL of concentrated fertilized eggs to each tube with 40 mL of FSW. We calculated the number of embryos added by counting the number of embryos in three 5 µL samples from the concentrated embryos.
There were an average of 75 embryos in 5 µL sample, which is equal to 1,500 in 100 µL and 15,000 in a 1 mL sample. This is very close to estimates provided by CRL (estimated 14,000 in 1 mL concentrated fertilized egg sample). On our gradient, we therefore added 150, 750, 1,500, 3,000, and 7,500 embryos to our tubes.
CRL has previously reared embryos in falcon tubes and recommended adding 100-200 µL to each falcon tube and resting it on its side to provide the greatest surface area. CRL did one water change within 12-24 h after fertilization and obtained viable embryos after 4 days.
We will check these tubes at 4 hours post fertilization (3am) and 9 hours post fertilization (8am) for viability. Tomorrow we will also practice the sampling procedure for collecting molecular and physiology samples from tubes at each time point.
C and D colonies
For our project on symbiont community identity in larvae, we have n=15 parents dominated by Durusdinium (and are bleaching resistant - AKA non-bleached phenotype) and n=13 parents dominated by Cladocopium (and are bleaching sensitive - AKA bleached phenotype). We placed nets over the colonies at 18:45pm that are equipped with funnels and falcon tubes with stoppers that are made buoyant by foam attachments.
We then monitored for spawning from 20:45pm-21:15pm. Two colonies released a light to moderate amount of bundles. We did not use any material from these colonies tonight. We will look for more spawning tomorrow!