


Revising E5 timeseries results - restructuring figures, filtering, and haplotypes
THis post details updates to the E5 time series analysis. The GitHub repository for this paper can be found here. Check out the README for this project in the GitHub repository.
1. Re-running univariate metrics
I first updated analyses by filtering univariate response to complete cases to match multivariate approaches.
This filtering reduced the number of observations from 448 to 379 to remove colonies that did not have all physiological responses measured. Now, the data in the univariate models are the same as the data in the multivariate modeling. We can now make interpretations of multivariate results in the context of the univariate drivers.
I also updated color palletes in univariate plots and pushed revised figures.
Largely, this did not change interpretations of our data or results. There were some minor changes in significance of effects, especially for effects that were marginally significant.
Here are the new host response plots:

Here are the new symbiont response plots:
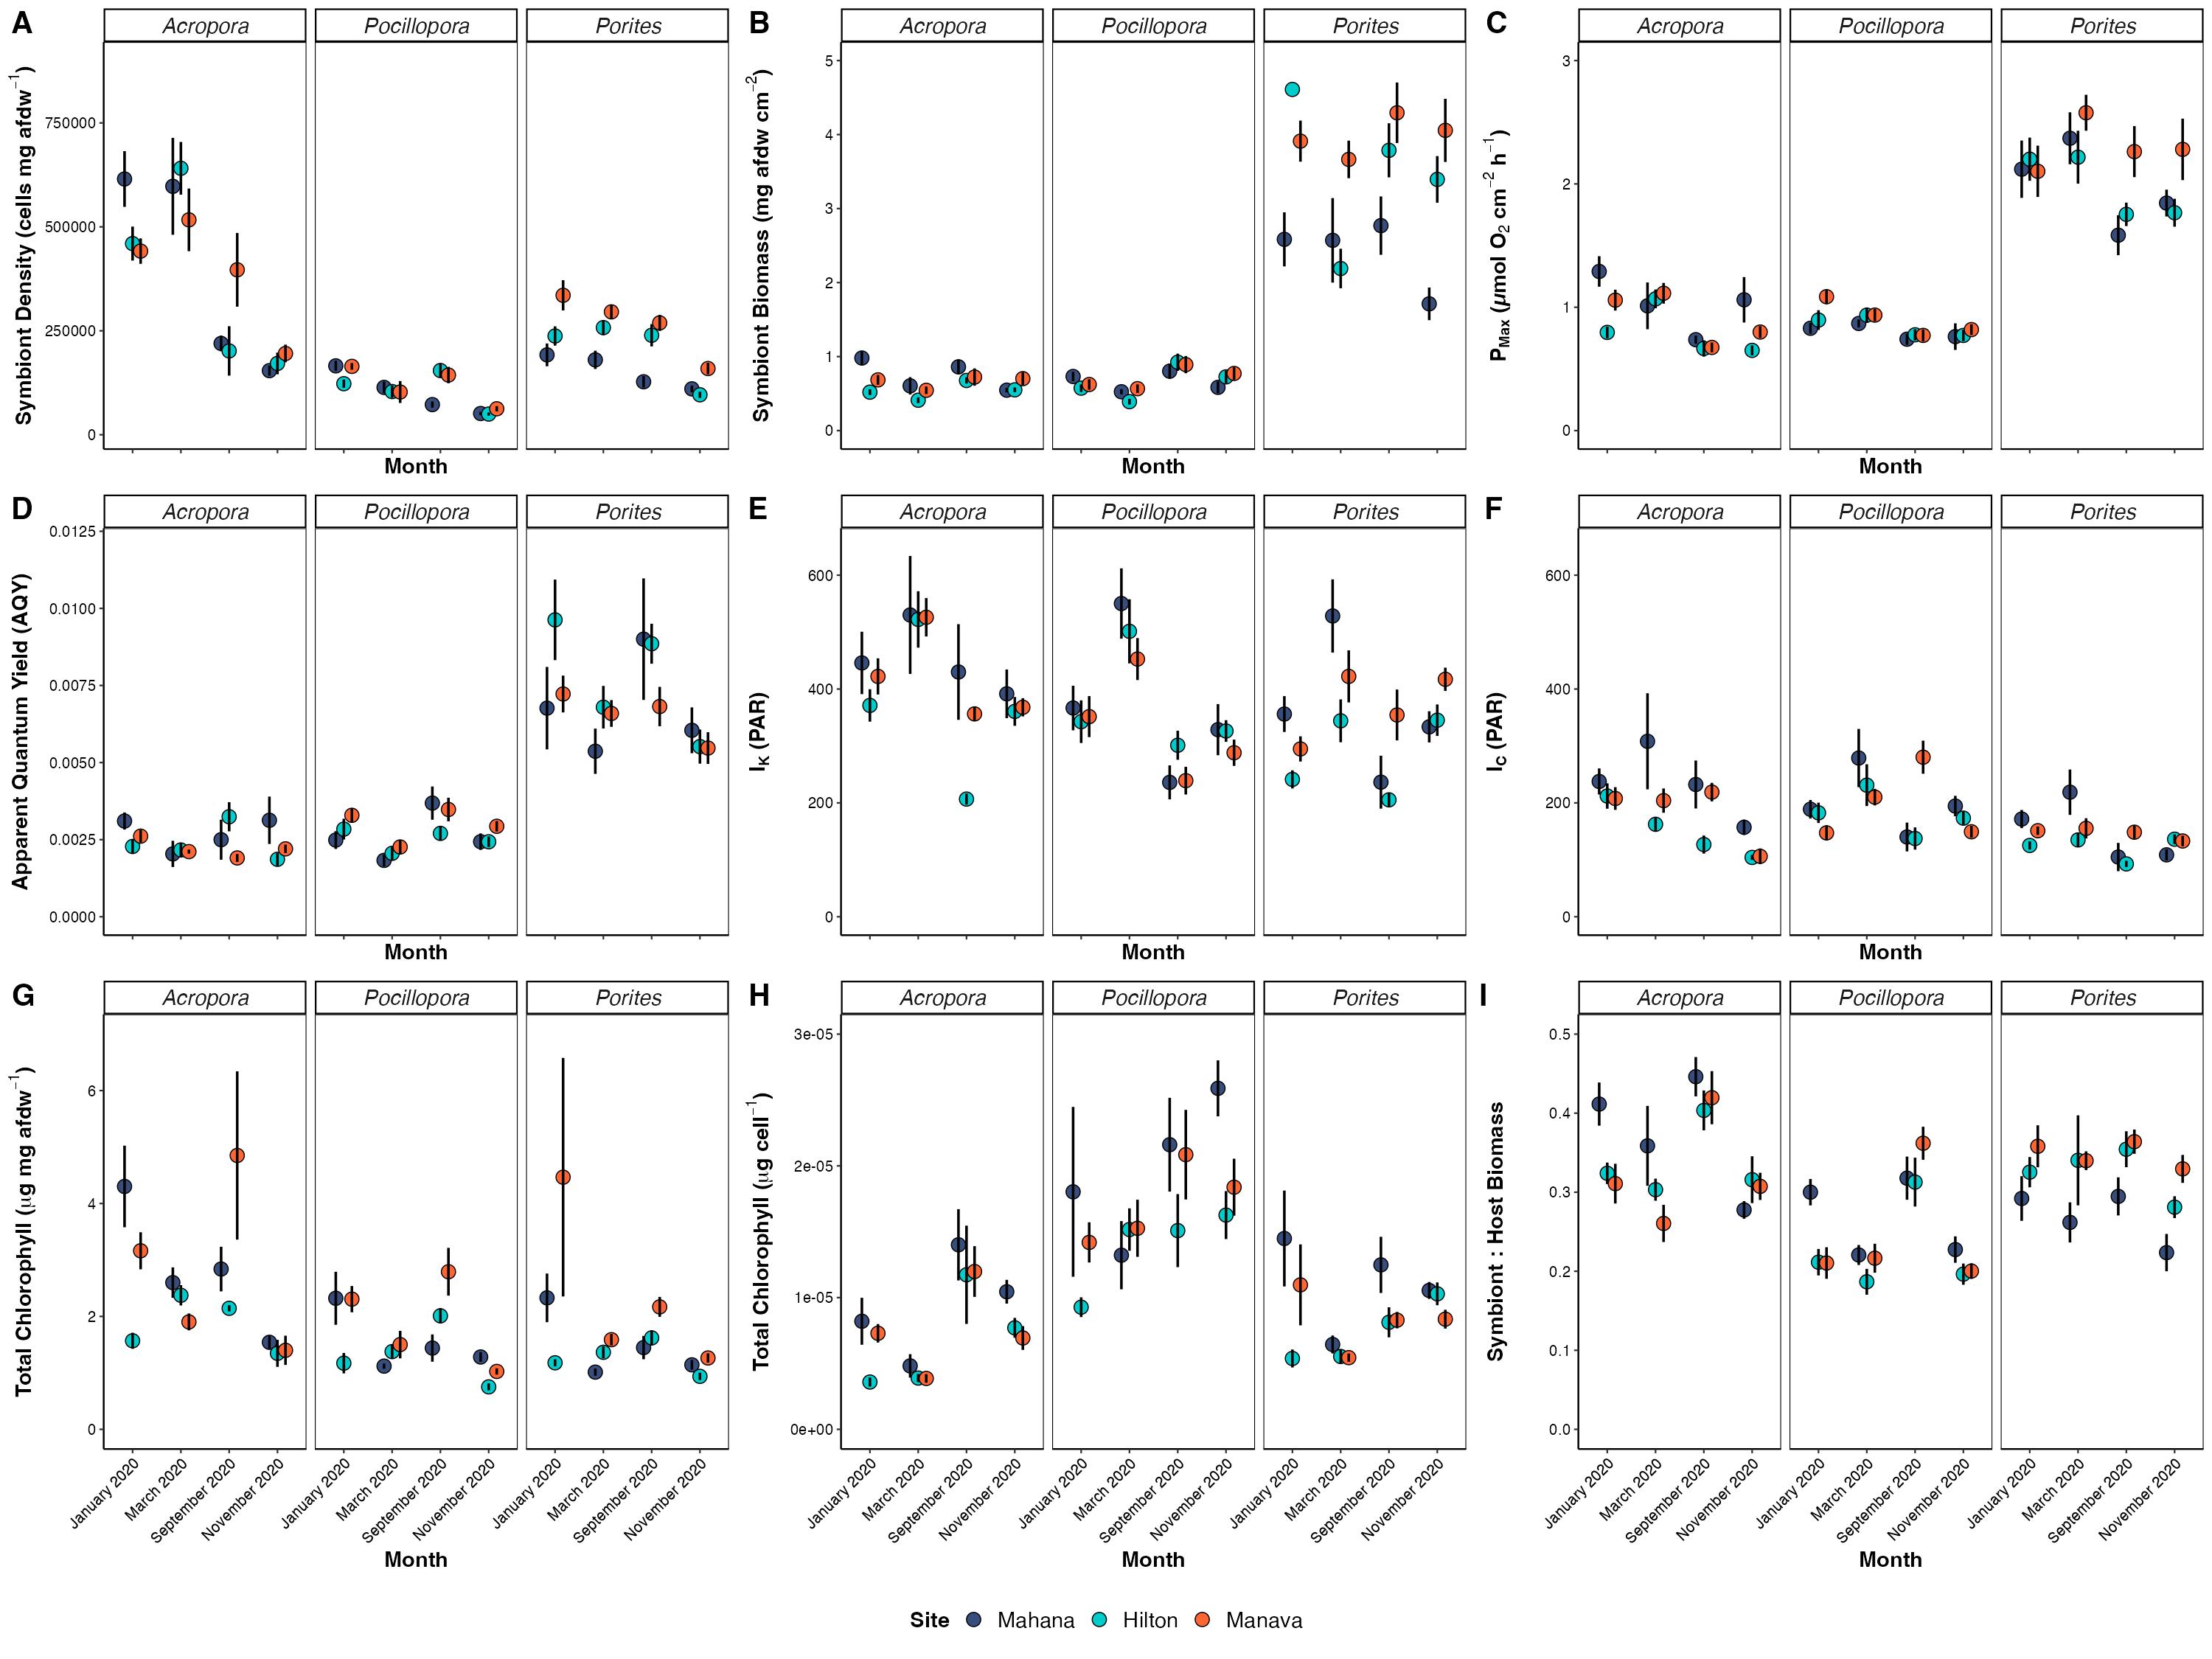
These revisions do not change any of our conclusions. I will need to just edit the manuscript text to revise any changes in p-values. I updated model output values in supplementary tables for the manuscript.
Here are a list of the significance in main effects that changed - if not noted, there was no change in the significance of main effects.
Full model outputs (species, site, and time and their interactions as main effects):
- AQY: time x species and site x species are now p<0.05 when they were marginal or close before (p=0.05-0.1)
- Rd: time x site is significant now at p=0.006 when previously it was at p=0.070
- Ik: time x species now significant at p=0.034 when previosly at p=0.064 and time x site x species is not significant at p=0.111 when it used to be at p=0.038
- Ic: site x species now significant at p=0.025 when previously it wasn’t at p=0.063
- Host protein: time x site x species not significant (p=0.064) when it used to be at p=0.012
- Total chl per cell: time x site is no longer significant (p=0.061) when it was before (p=0.029) and time x species is now significant (p=0.042) when it wasn’t before (p=0.087).
Species-specific model outputs (site and time and interaction as main effects with a separate model for each species):
- Porites host biomass - time and time x site are significant now when it was not before
- Pocillopora symbiont biomass previously had significant time x site, but now this is not significant
- Pocillopora symbiont:host biomass effect of site is no longer significant (but site x time remains)
- Pocillopora cell specific chl used to have site significant and now it isn’t at p=0.06
- Pocillopora protein time x site is not significant
- Acropora Pmax no longer significant for site
- Pocillopora AQY site effect not significant, marginal at p=0.061
2. Ran PCAs by new haplotype/species ID’s
Hollie recently completed the first round of haplotype/species identification for Porites and Pocillopora samples for the E5 timeseries. Data can be found on GitHub here. We have multiple haplotypes in Porites and Pocillopora that are cryptic species. We are now going to analyze how these identifications influence our multivariate physiological data and our symbiont ITS2 data to determine the next steps in our analysis.
PCA’s of holobiont responses
Generated new PCA’s of holobiont responses (host and symbiont combined) to look at differences by haplotypes/species from DNA sequencing.
I will show plots with all haplotypes together and then separated to look at Pocillopora and Porites individually.


There appears to be minimal differences between Pocillopora species/haplotypes, but more of a difference between Porites species (evermanni and lobata).
We still need to run the PocHistone RFLP to distinguish between P. meandrina and P. grandis.
I also separated responses by host and symbiont to see if differences are more pronounced in either partner.
PCA’s of host responses


Minimal differences in Pocillopora, if any in the host.
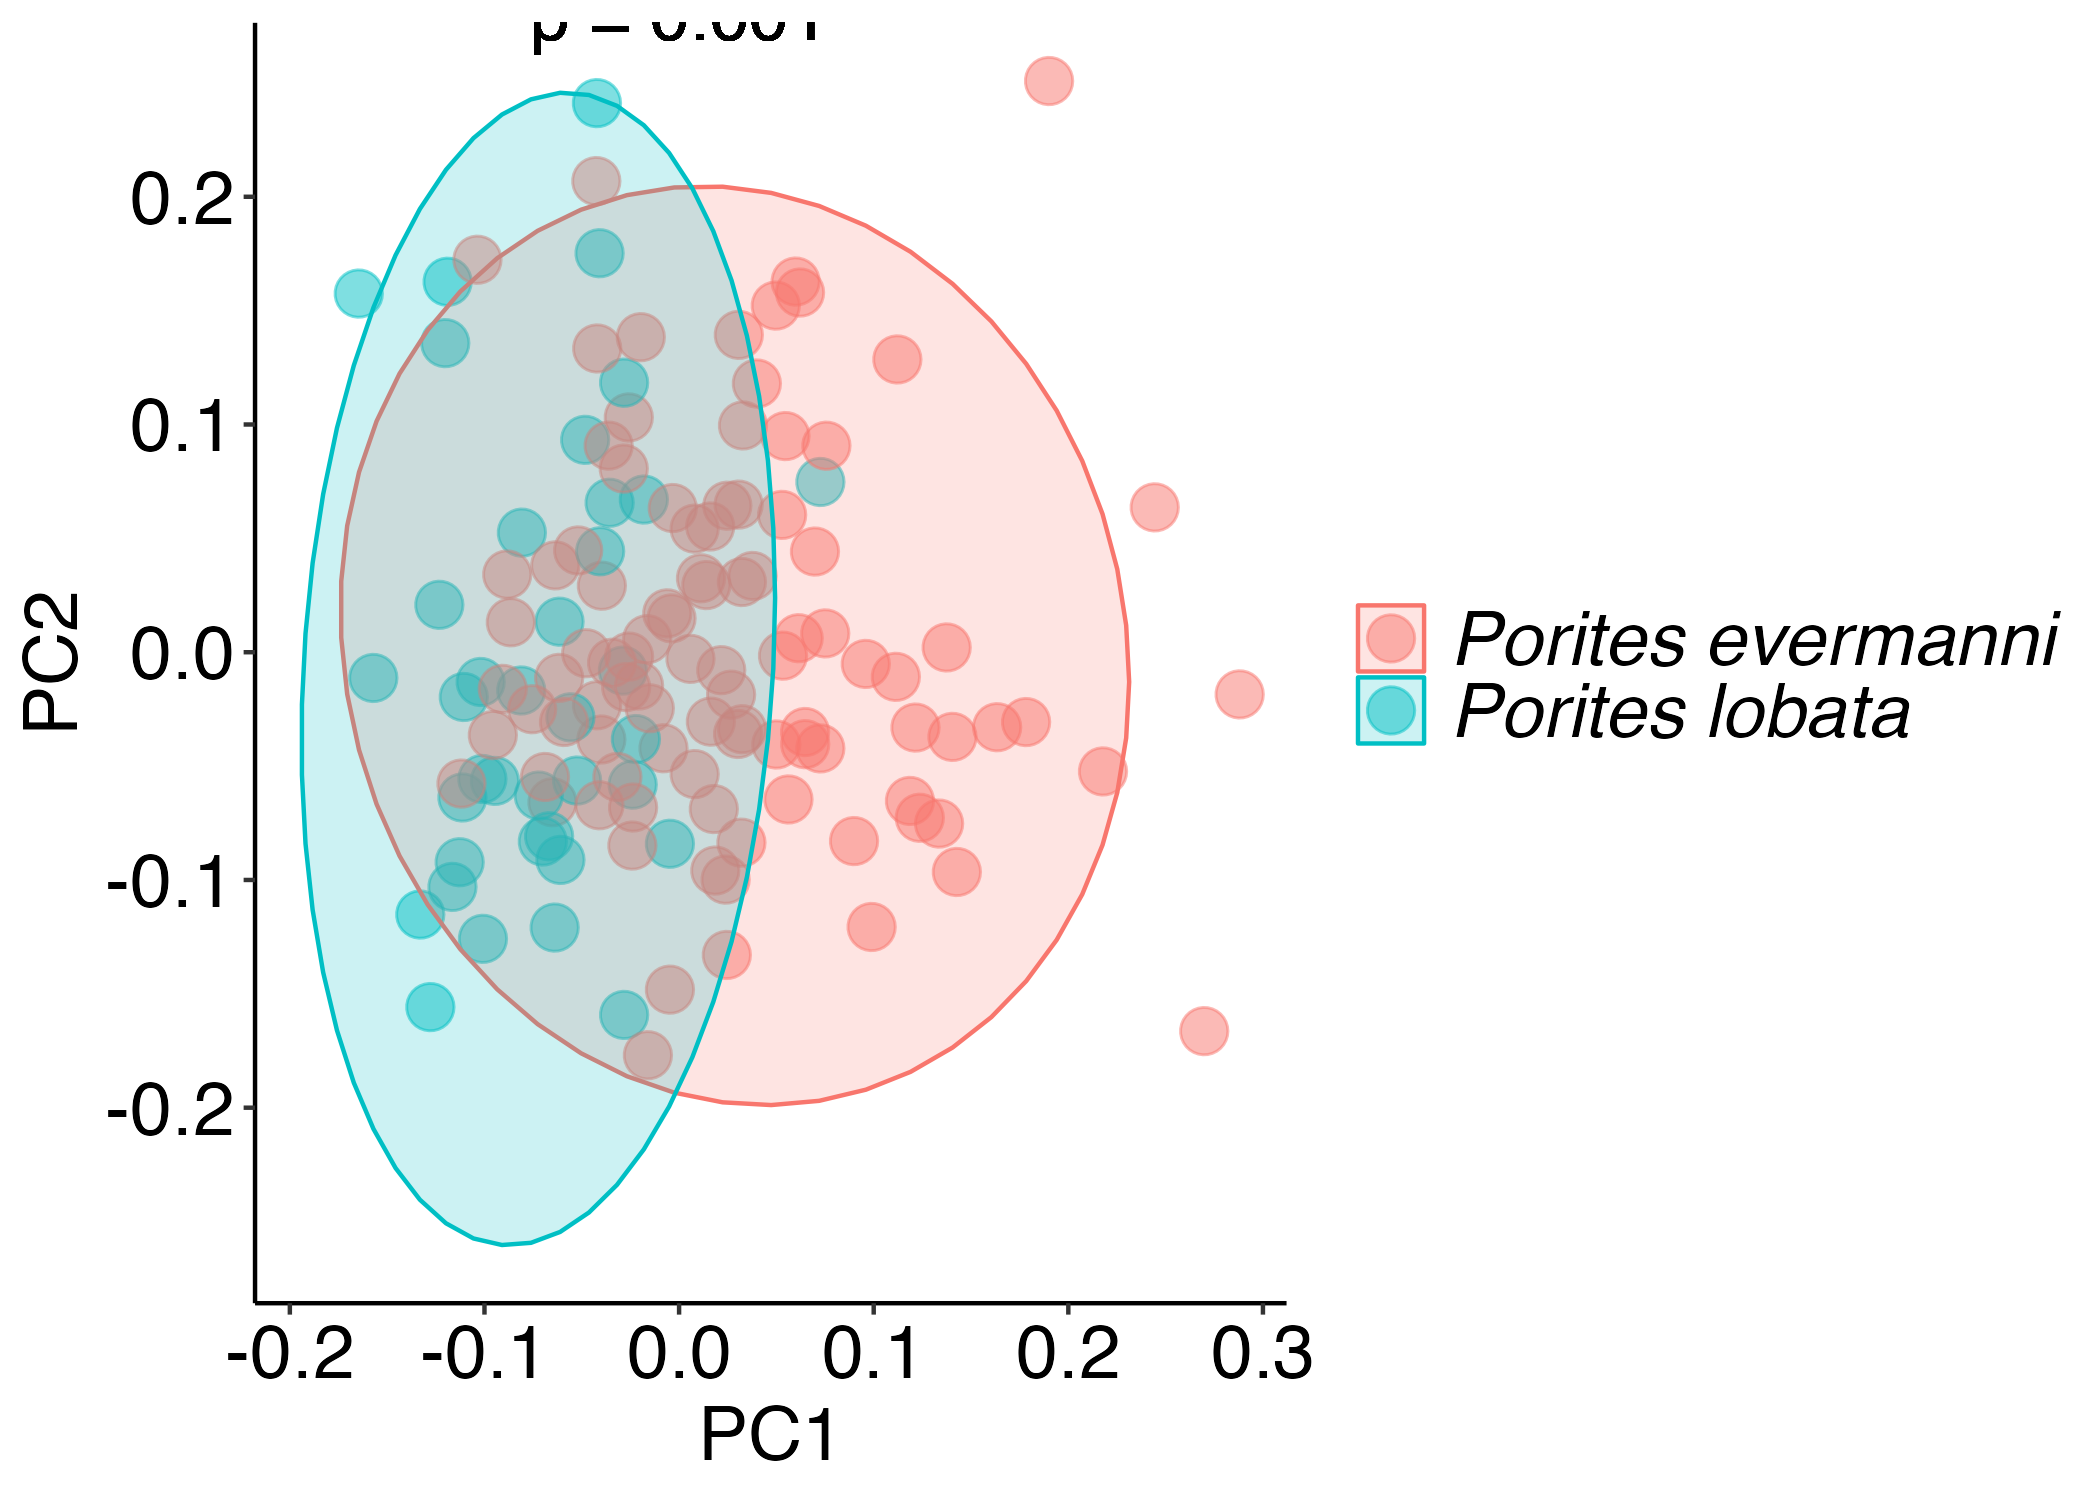
There is still a difference between Porites haplotypes in host physiology (p=0.001).
PCA’s of symbiont responses


Significant but small differences in symbiont responses by haplotype.
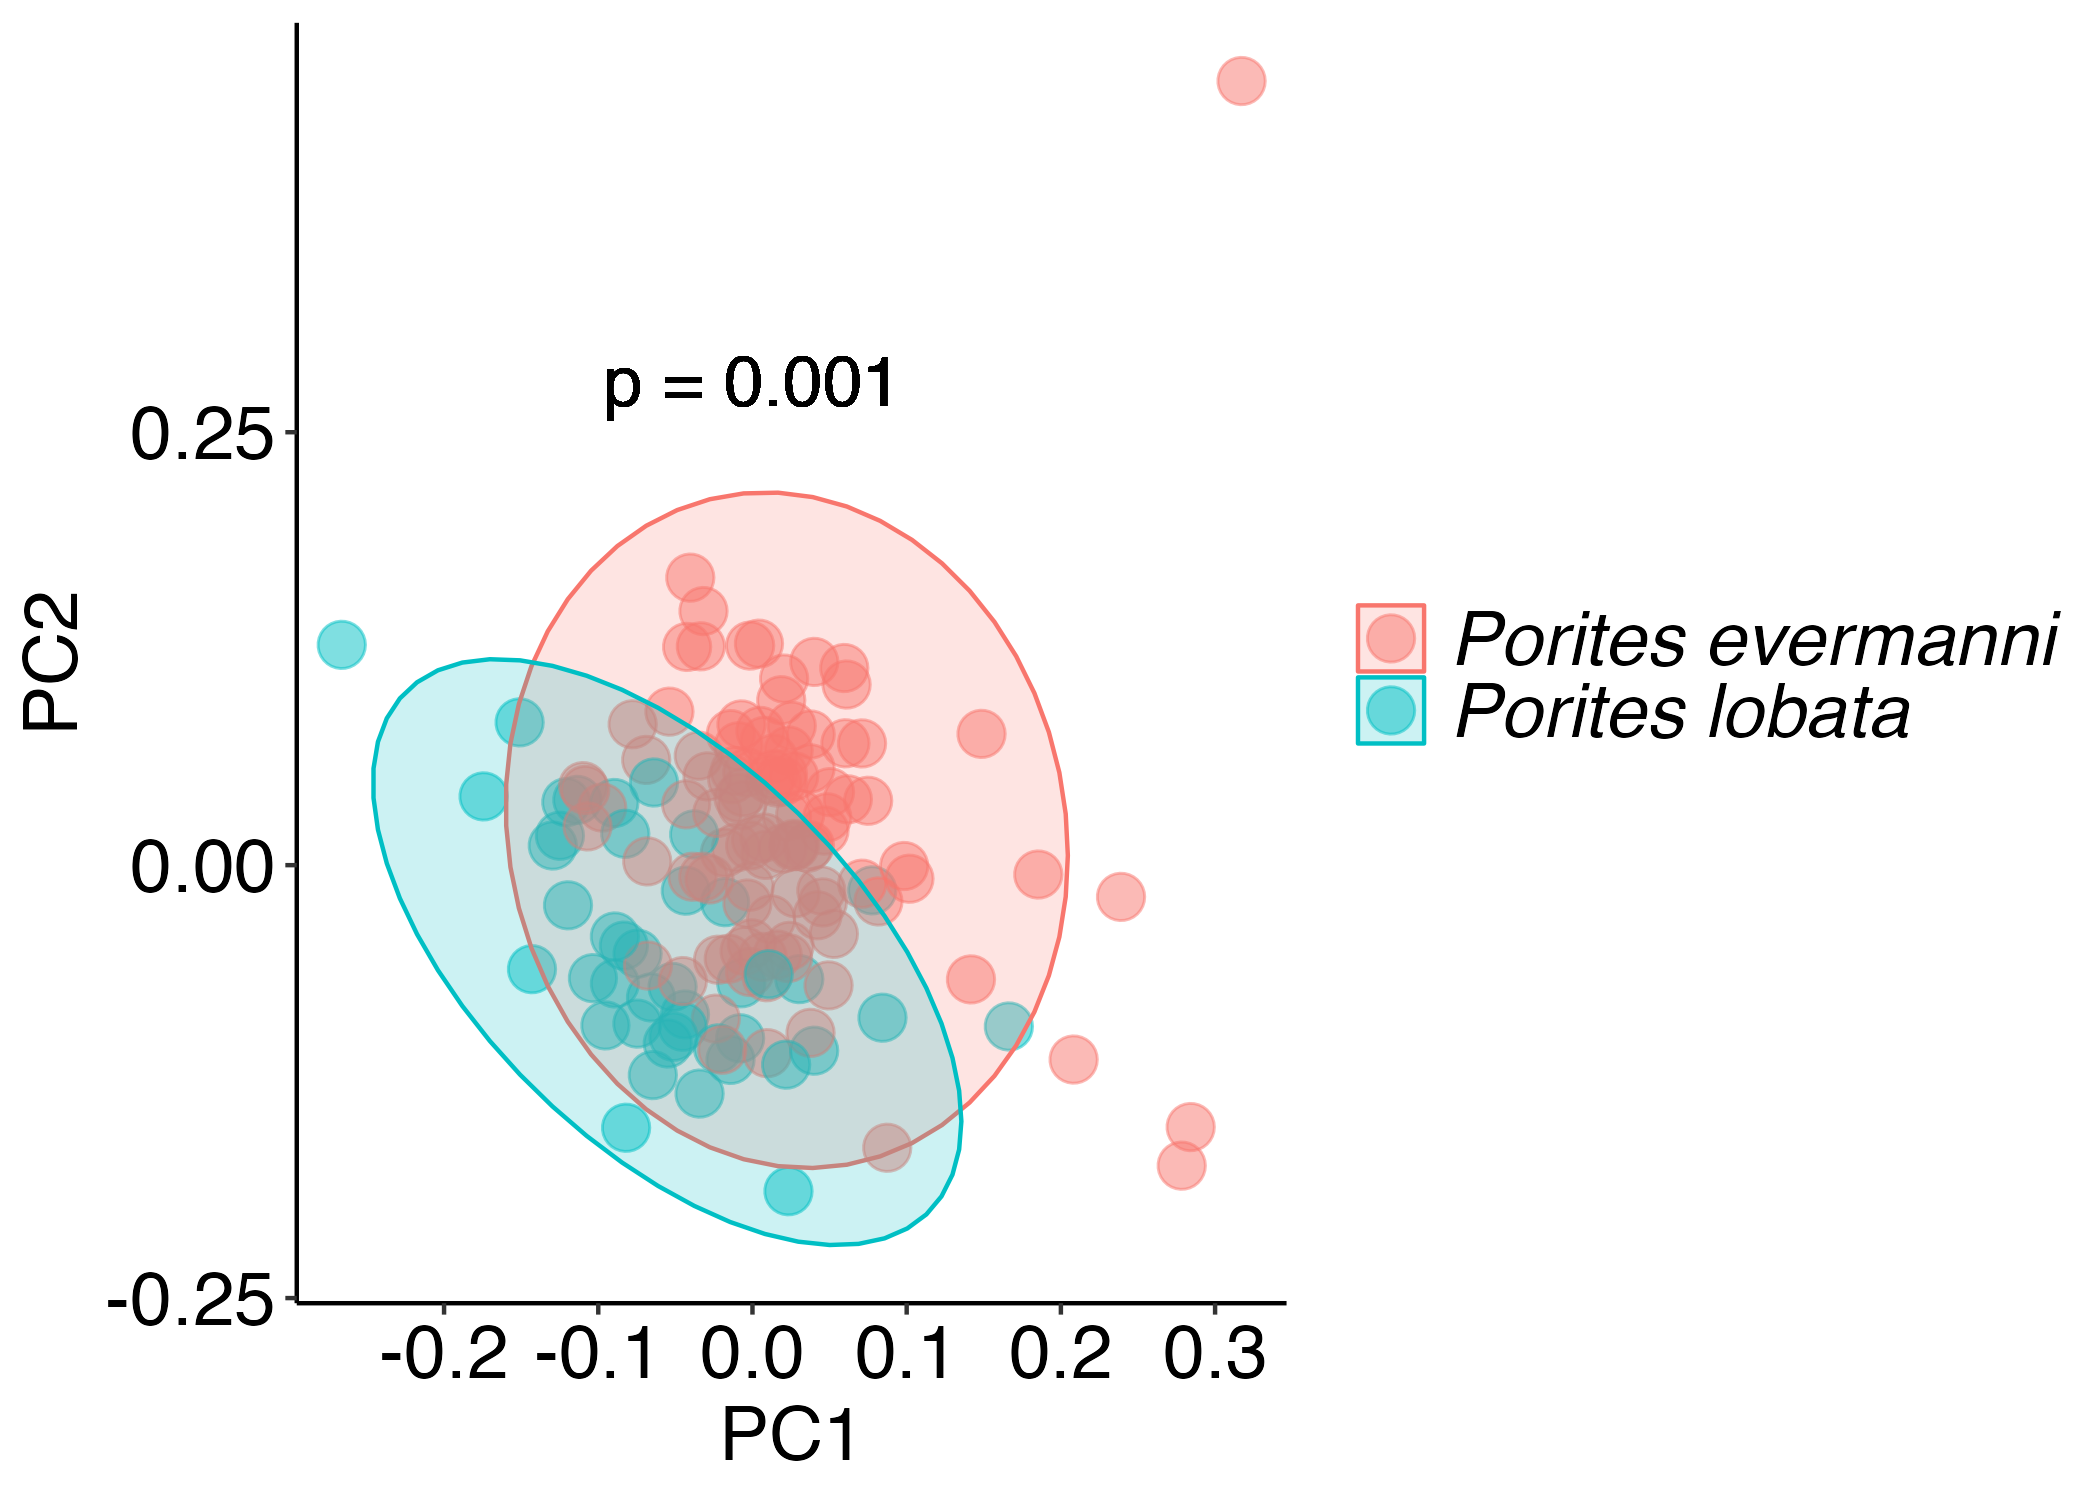
Stronger differences by haplotype in Porites for symbiont responses.
Given differences in symbiont physiology between haplotypes, we may see differences in ITS2 communities. I’ll check that next.
3. Look at ITS2 differences by species/haplotype
I next looked at relative abundance of ITS2 profiles in each haplotype. As a reminder, here are the results of ITS2 communities at the genus level from previously analysis:

I then generated new plots faceted by haplotype for Pocillopora and Porites. I also ran a revised model to test for effects of haplotype on ITS2 profile relative abundance.
Pocillopora
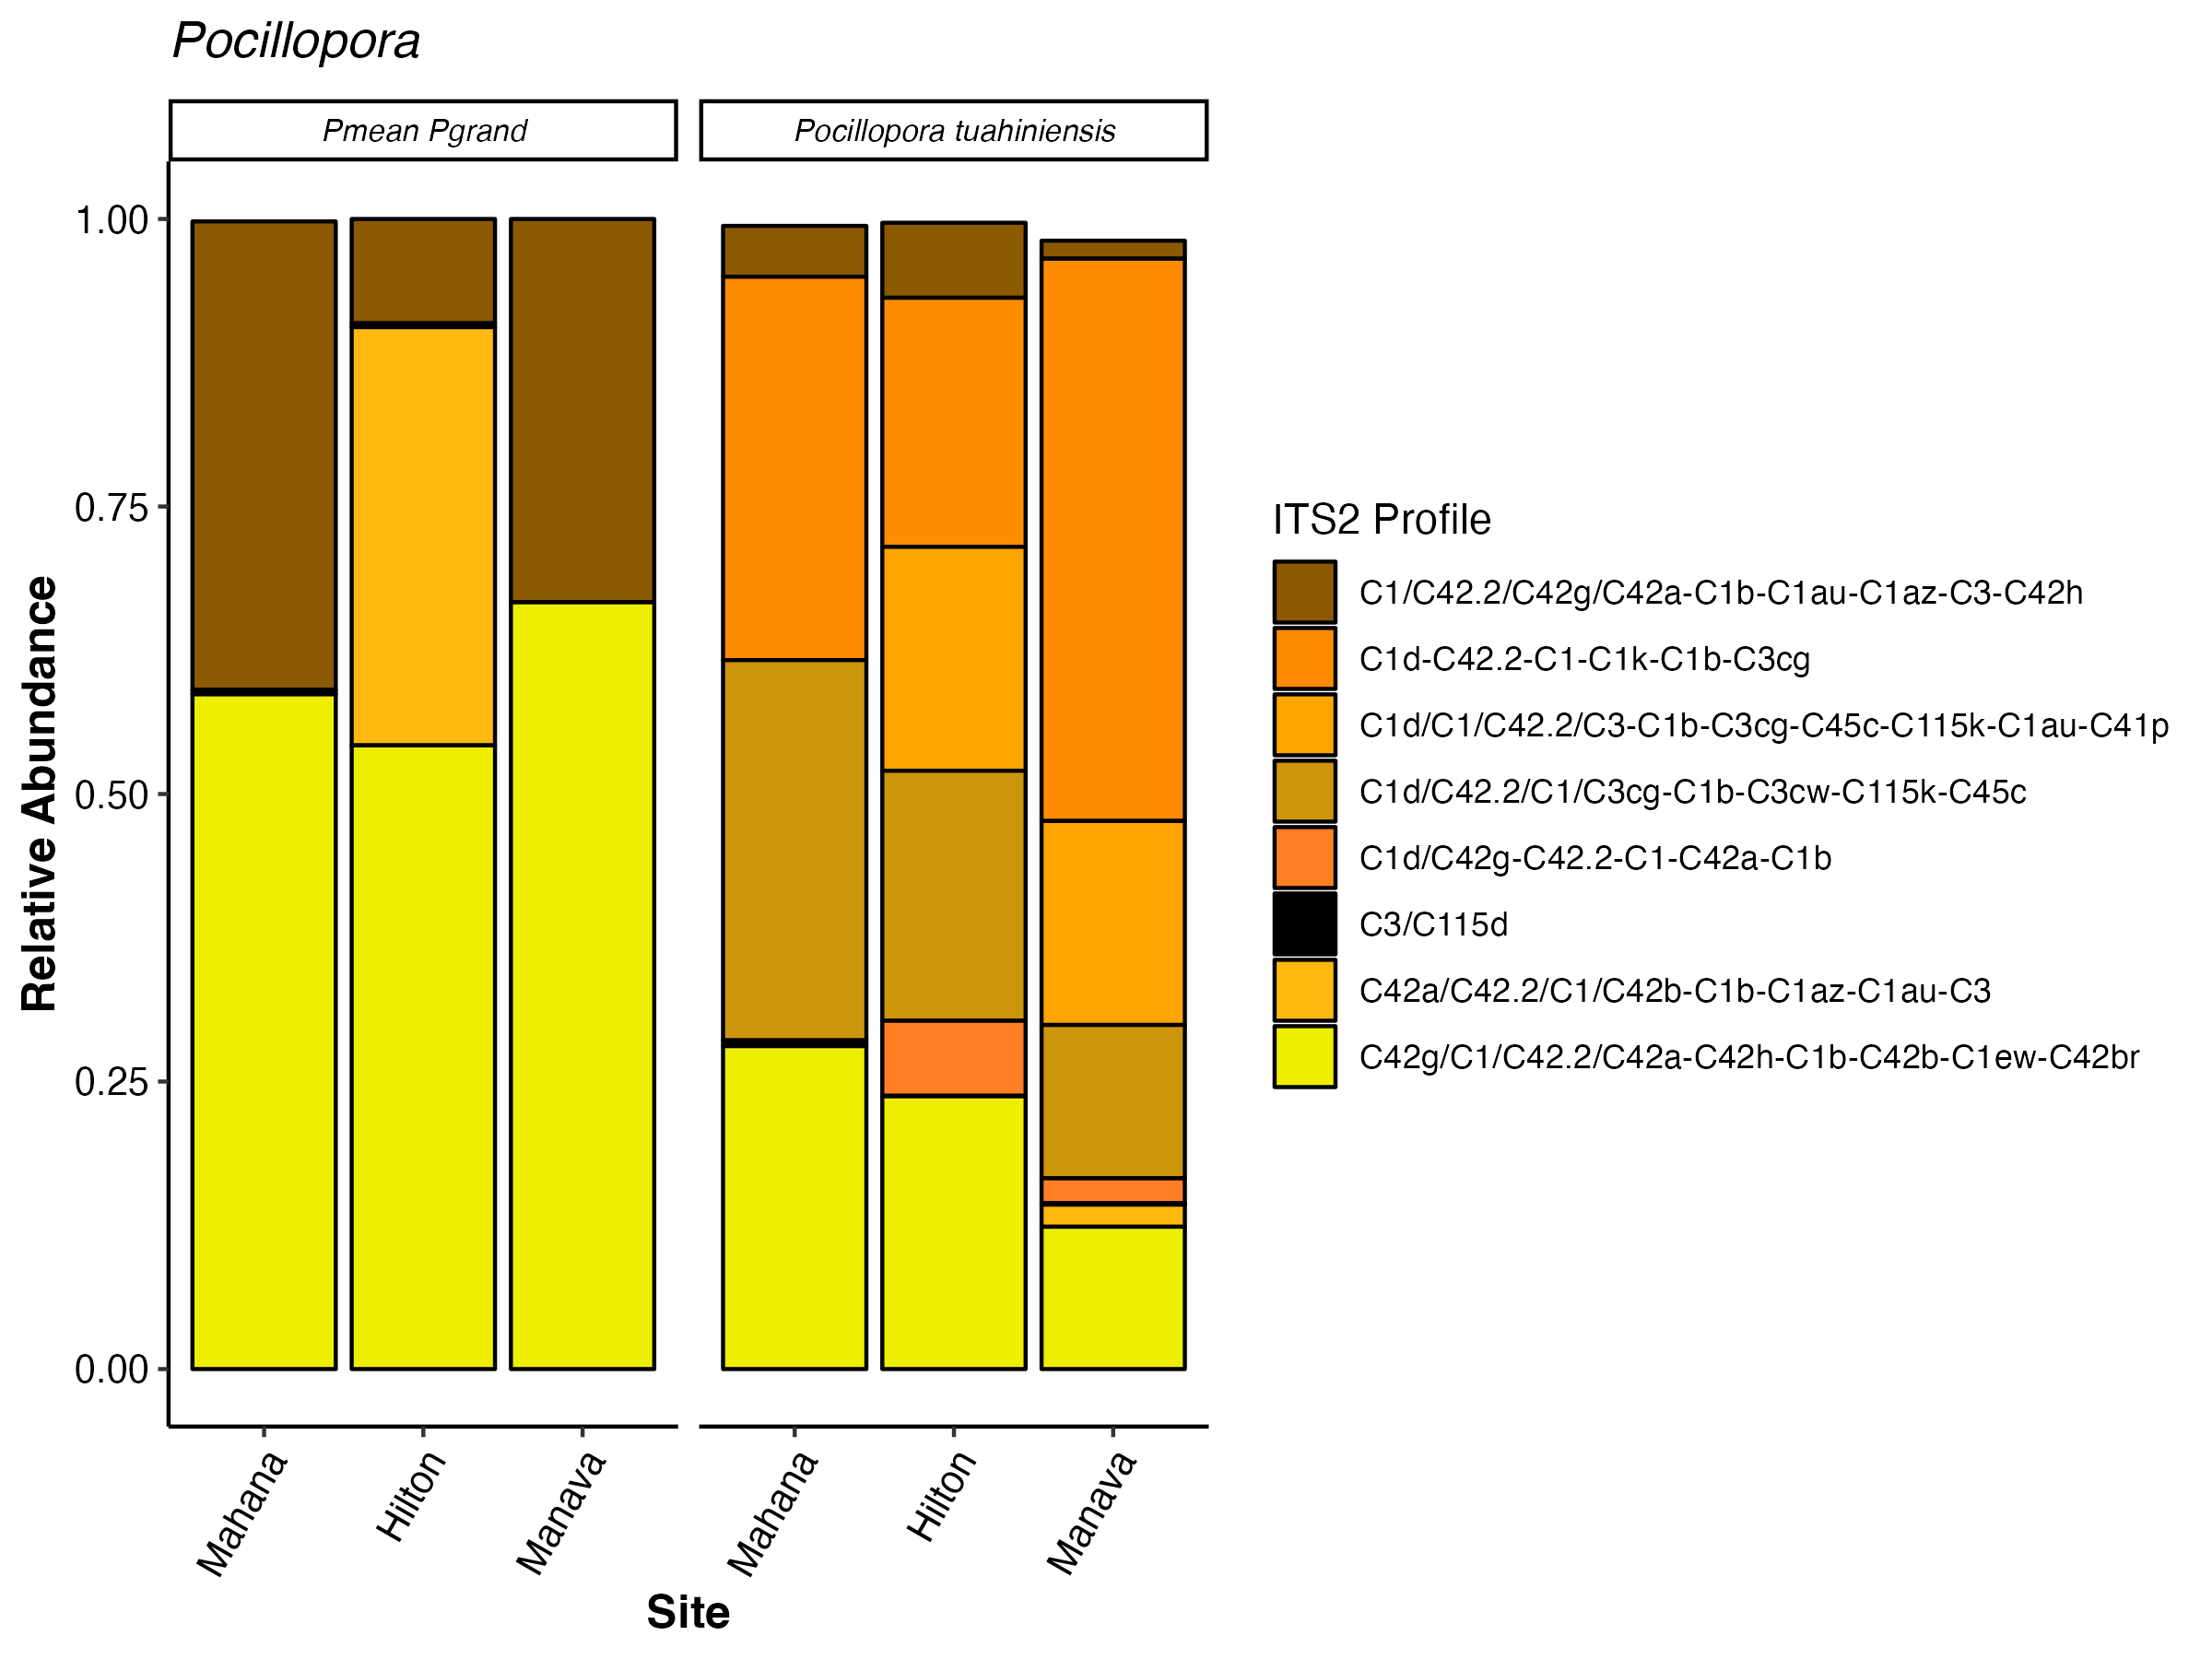
There are very clear visual differences in ITS2 profiles between the two haplotype categories we currently have. P. meandrina/P. grandis have greater proportions of the C1 profile and C42g profile than P. tuahiniensis. P. tuahiniensis has a greater proportion of the C1d-C42.2 profile as well as the C1d/C42.2 profile than the other haplotype category.
Here are the model results. There is an interaction of profile x haplotype and profile x site. There are differences in ITS2 profiles between sites as before and this is not modulated by haplotype. The interaction of profile x haplotype shows that haplotypes host different ITS2 communities.
aov(Abundance~site*Profile*haplotype, data=.)

                        Df Sum Sq Mean Sq F value   Pr(>F)
site                     2  0.000  0.0000   0.000   1.0000
Profile                 13  7.064  0.5434  15.179  < 2e-16 ***
haplotype                1  0.000  0.0000   0.000   0.9996
site:Profile            26  1.659  0.0638   1.783   0.0105 *
site:haplotype           2  0.000  0.0000   0.000   1.0000
Profile:haplotype       13  3.314  0.2549   7.120 6.93e-13 ***
site:Profile:haplotype  26  0.641  0.0246   0.688   0.8760
Residuals              546 19.545  0.0358
Porites

There are some very interesting and clear visual differences in ITS2 profiles by haplotype. We can see that the dominant C15-C15kl-C15he-C15vz profile in Porites evermanni is not present in Porites lobata. Further, the dominant ITS2 profiles in lobata are rare or not found in evermanni, including C15-C15l-C15bm-C15n and C15-C15l-C15n-C15bb-C15.8.
Note that we do not have any Porites lobata at the Manava site, so we will be limited in making site comparisons.
These results show that there is a site x profile effect and site x haplotype effect, like we saw in Pocillopora. There are differences in ITS2 profiles between sites as before and this is not modulated by haplotype. The interaction of profile x haplotype shows that haplotypes host different ITS2 communities.
aov(Abundance~site*Profile*haplotype, data=.)

                        Df Sum Sq Mean Sq F value  Pr(>F)
site                     2  0.000  0.0000    0.00   1.000
Profile                 18 11.794  0.6552   33.45 < 2e-16 ***
haplotype                1  0.000  0.0000    0.00   0.999
site:Profile            36  3.145  0.0874    4.46 1.4e-15 ***
site:haplotype           1  0.000  0.0000    0.00   0.999
Profile:haplotype       18  5.818  0.3232   16.50 < 2e-16 ***
site:Profile:haplotype  18  0.145  0.0080    0.41   0.986
Residuals              722 14.143  0.0196
Overall, ITS2 communities are very different by haplotype. Next, we will need to decide how to proceed with multivariate data and include haplotype as a source of explained variance in RDA analyses.
4. Revising variance partioning to include haplotype
I then revised the variance partioning analysis to include haplotype along with site and time in explaining multivariate physiological variance. Here are the results.
In this analysis, I included categories that explained over 1% of the variance. Note that for Porites, a term called “Site&Haplotype” is present. This is because one of the haplotypes is not present at one site, and therefore the model cannot fully separate these terms.

I’ll need to fix the labels to make it more clear to see the percentages, but this gives us something to work with.
The main new result is that haplotype explains a larger portion of the variance in Porites than is explained by site. Previously, we saw higher site variance in this species. This was likely driven by haplotype, which we can see more clearly now. Haplotype is minor for Porites, which makes sense with the PCA results above.