


Analyzing Acropora larval metabolism experiment respirometry data
This post details analysis of respirometry data for the Acropora pulchra larval metabolism experiment in Moorea in Oct 2022.
Notebook posts for this project can be found here.
Dataset overview
We exposed Acropora pulchra larvae to 4 days of thermal stress in larval tank systems in Moorea, French Polynesia in October 2022. Larvae were expoesd to either high (+2-2.5°C) or ambient temperature. Within each temperature, tanks were either dosed with symbionts or not. However, larvae in the dosed tanks did not take up symbionts. Therefore, this is primarily a temperature experiment.
Throughout the experiment, we sampled for gene expression, metabolomics, and respirometry on days 0, 2, and 4 of temperature exposure.
Here, I am conducting the initial analysis of respirometry data.
Extracting respiration rates
Oxygen evolution was measured first in the light (20 min at ~500 PAR). The purpose of this was to measure photosynthesis in anticipation of symbiont uptake. This light period will also standardize the light environment to account for any differences in light enhanced respiration.
Oxygen consumption (respiration) was calculating using LoLinR using localized linear regressions. The script for rate extraction can be found on GitHub.
For each sample, the calculations looked like this:
This calculation shows the slope calculated of oxygen consumption during the dark (respiration) period.
However, because no symbionts were taken up, photosynthesis and respiration rates were similar, indicating no oxygen production (described later below). I also calculated respiration rates using teh entire measurement period.
In this example, you can see the start of the measurement period is highly variable. This is the light measurement period. Since there was no photosynthesis, we will use data truncated from only the dark period as in the first example above.
Respiration rates were recorded in the software as percent air saturation. During rate extraction, % air saturation was converted to umol/L (oxygen concentration) using the convert_DO function in the respR package using the internal temperature and measured salinity.
Rates were standardized to well volume and normalized per larva - calculated as nmol oxygen per larva per minute and are on GitHub here.
Visualizing respiration rates
First, I extracted internal temperature measurements from the SDR data and calcuated the mean temperature for each run. We set the incubators at either 27C or 30C, but there is naturally variation between the water in the plate and the incubator air temperature.
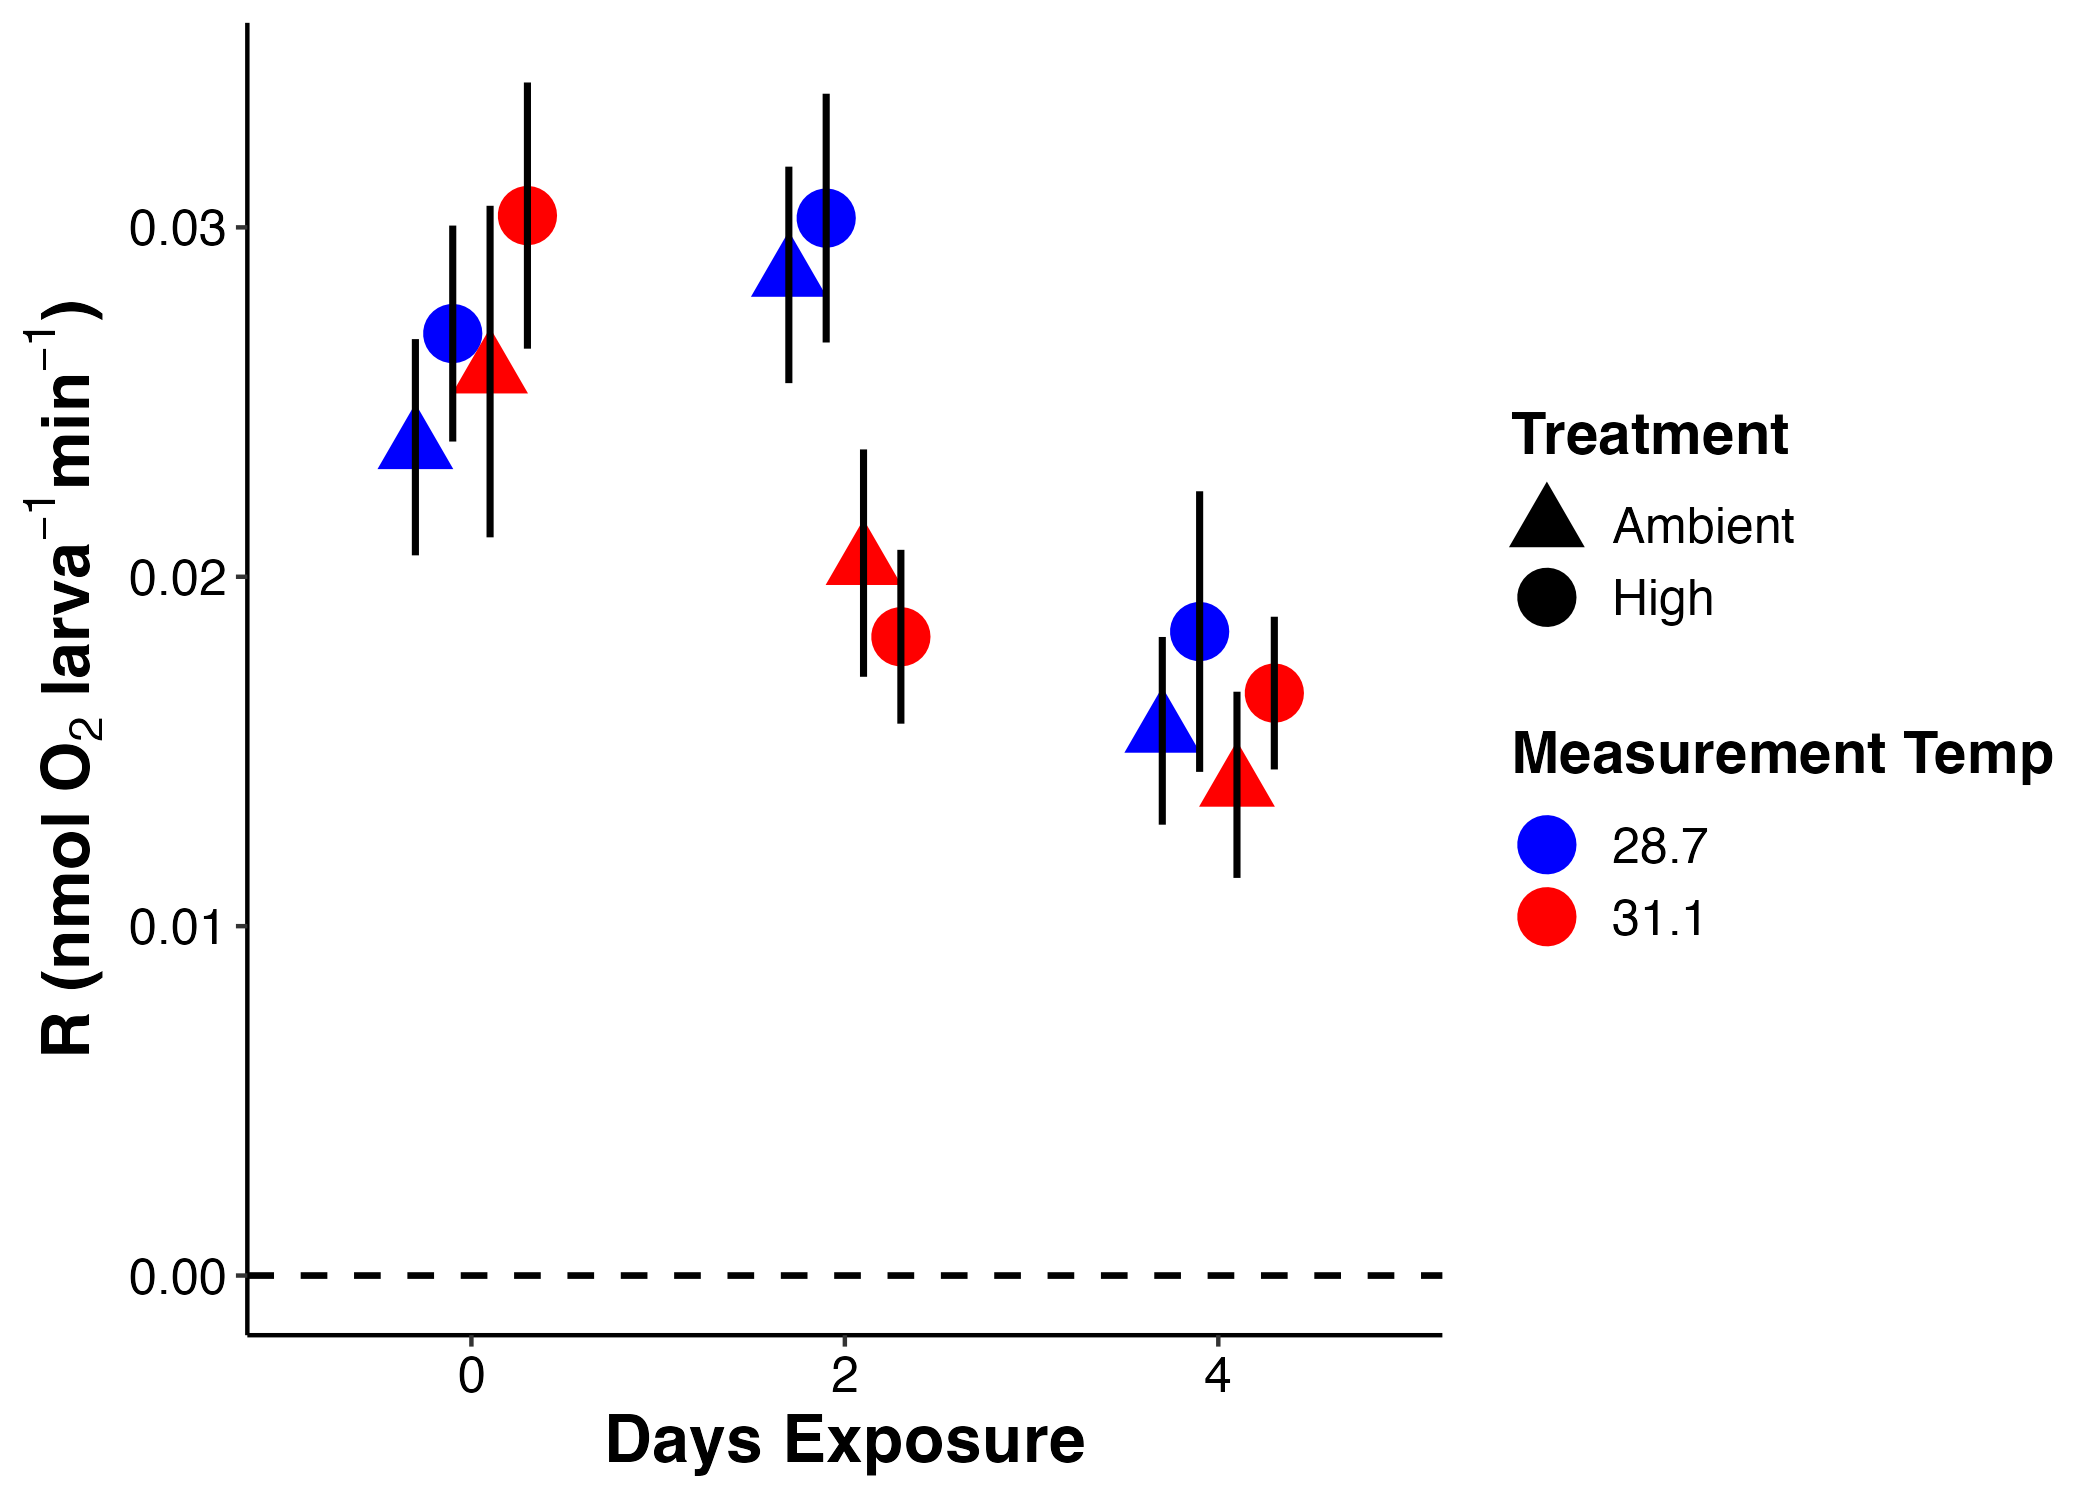
I then visualized respiration rates across treatment groups on each day of exposure at each measurement temperature.
I also visualized this plot as a boxplot.

Finally, I plotted the data with measurement temperature across the x-axis to see if there is a pattern across run specific temperatures.

Overall, respiration appears to decrease across the course of the experiment. There is not a difference in respiration between rearing temperature treatments. On day 2 of the experiment, there appears to be lower respiration rates at the higher measurement temperature, but this difference is not apparent on days 0 or the final day of the experiment.
Finally, I analyzed the data with a mixed effects model.
Rmodel1<-lmer(log(1+R.nmol.org.min)~Actual.Temp*Treatment.Temp*Days.Exposure + (1|Tank), data=PRdata)
Type II Analysis of Variance Table with Satterthwaite's method
                                            Sum Sq   Mean Sq NumDF   DenDF F value    Pr(>F)
Actual.Temp                              0.0015303 0.0015303     1 245.789  5.1029   0.02476 *
Treatment.Temp                           0.0001362 0.0001362     1   9.609  0.4542   0.51623
Days.Exposure                            0.0082078 0.0041039     2 244.522 13.6848 2.325e-06 ***
Actual.Temp:Treatment.Temp               0.0000055 0.0000055     1 245.848  0.0182   0.89270
Actual.Temp:Days.Exposure                0.0006164 0.0003082     2 244.579  1.0278   0.35935
Treatment.Temp:Days.Exposure             0.0009712 0.0004856     2 244.549  1.6193   0.20016
Actual.Temp:Treatment.Temp:Days.Exposure 0.0003725 0.0001863     2 244.615  0.6211   0.53821
---
Signif. codes:  0 ‘***’ 0.001 ‘**’ 0.01 ‘*’ 0.05 ‘.’ 0.1 ‘ ’ 1
As expected, day of exposure was significant as was measurement temperature. There is no effect of rearing treatment.