Analyzing Environmental Data - Acropora larval metabolism 2022
This post details environmental measurements analysis for the 2022 Acropora larval metabolism experiment from the Moorea 2022 Field Expedition.
Notebooks detailing this experiment can be found here.
The GitHub repo for this project can be found here.
Overview
During this experiment, we collected daily measurements and deployed temperature and light loggers during embryo and larval rearing and a 5-day temperature exposure.
This post includes figures and analysis of this environmental data.
Temperature Loggers
Temperature was recorded during the study every 10 minutes in larval tanks by Hobo pendant loggers.
Pendant logger temperature readings were calibrated to a group mean of high precision Hobo loggers using an offset method on 25 September 2022.
Temperature during the study is shown in this figure below:
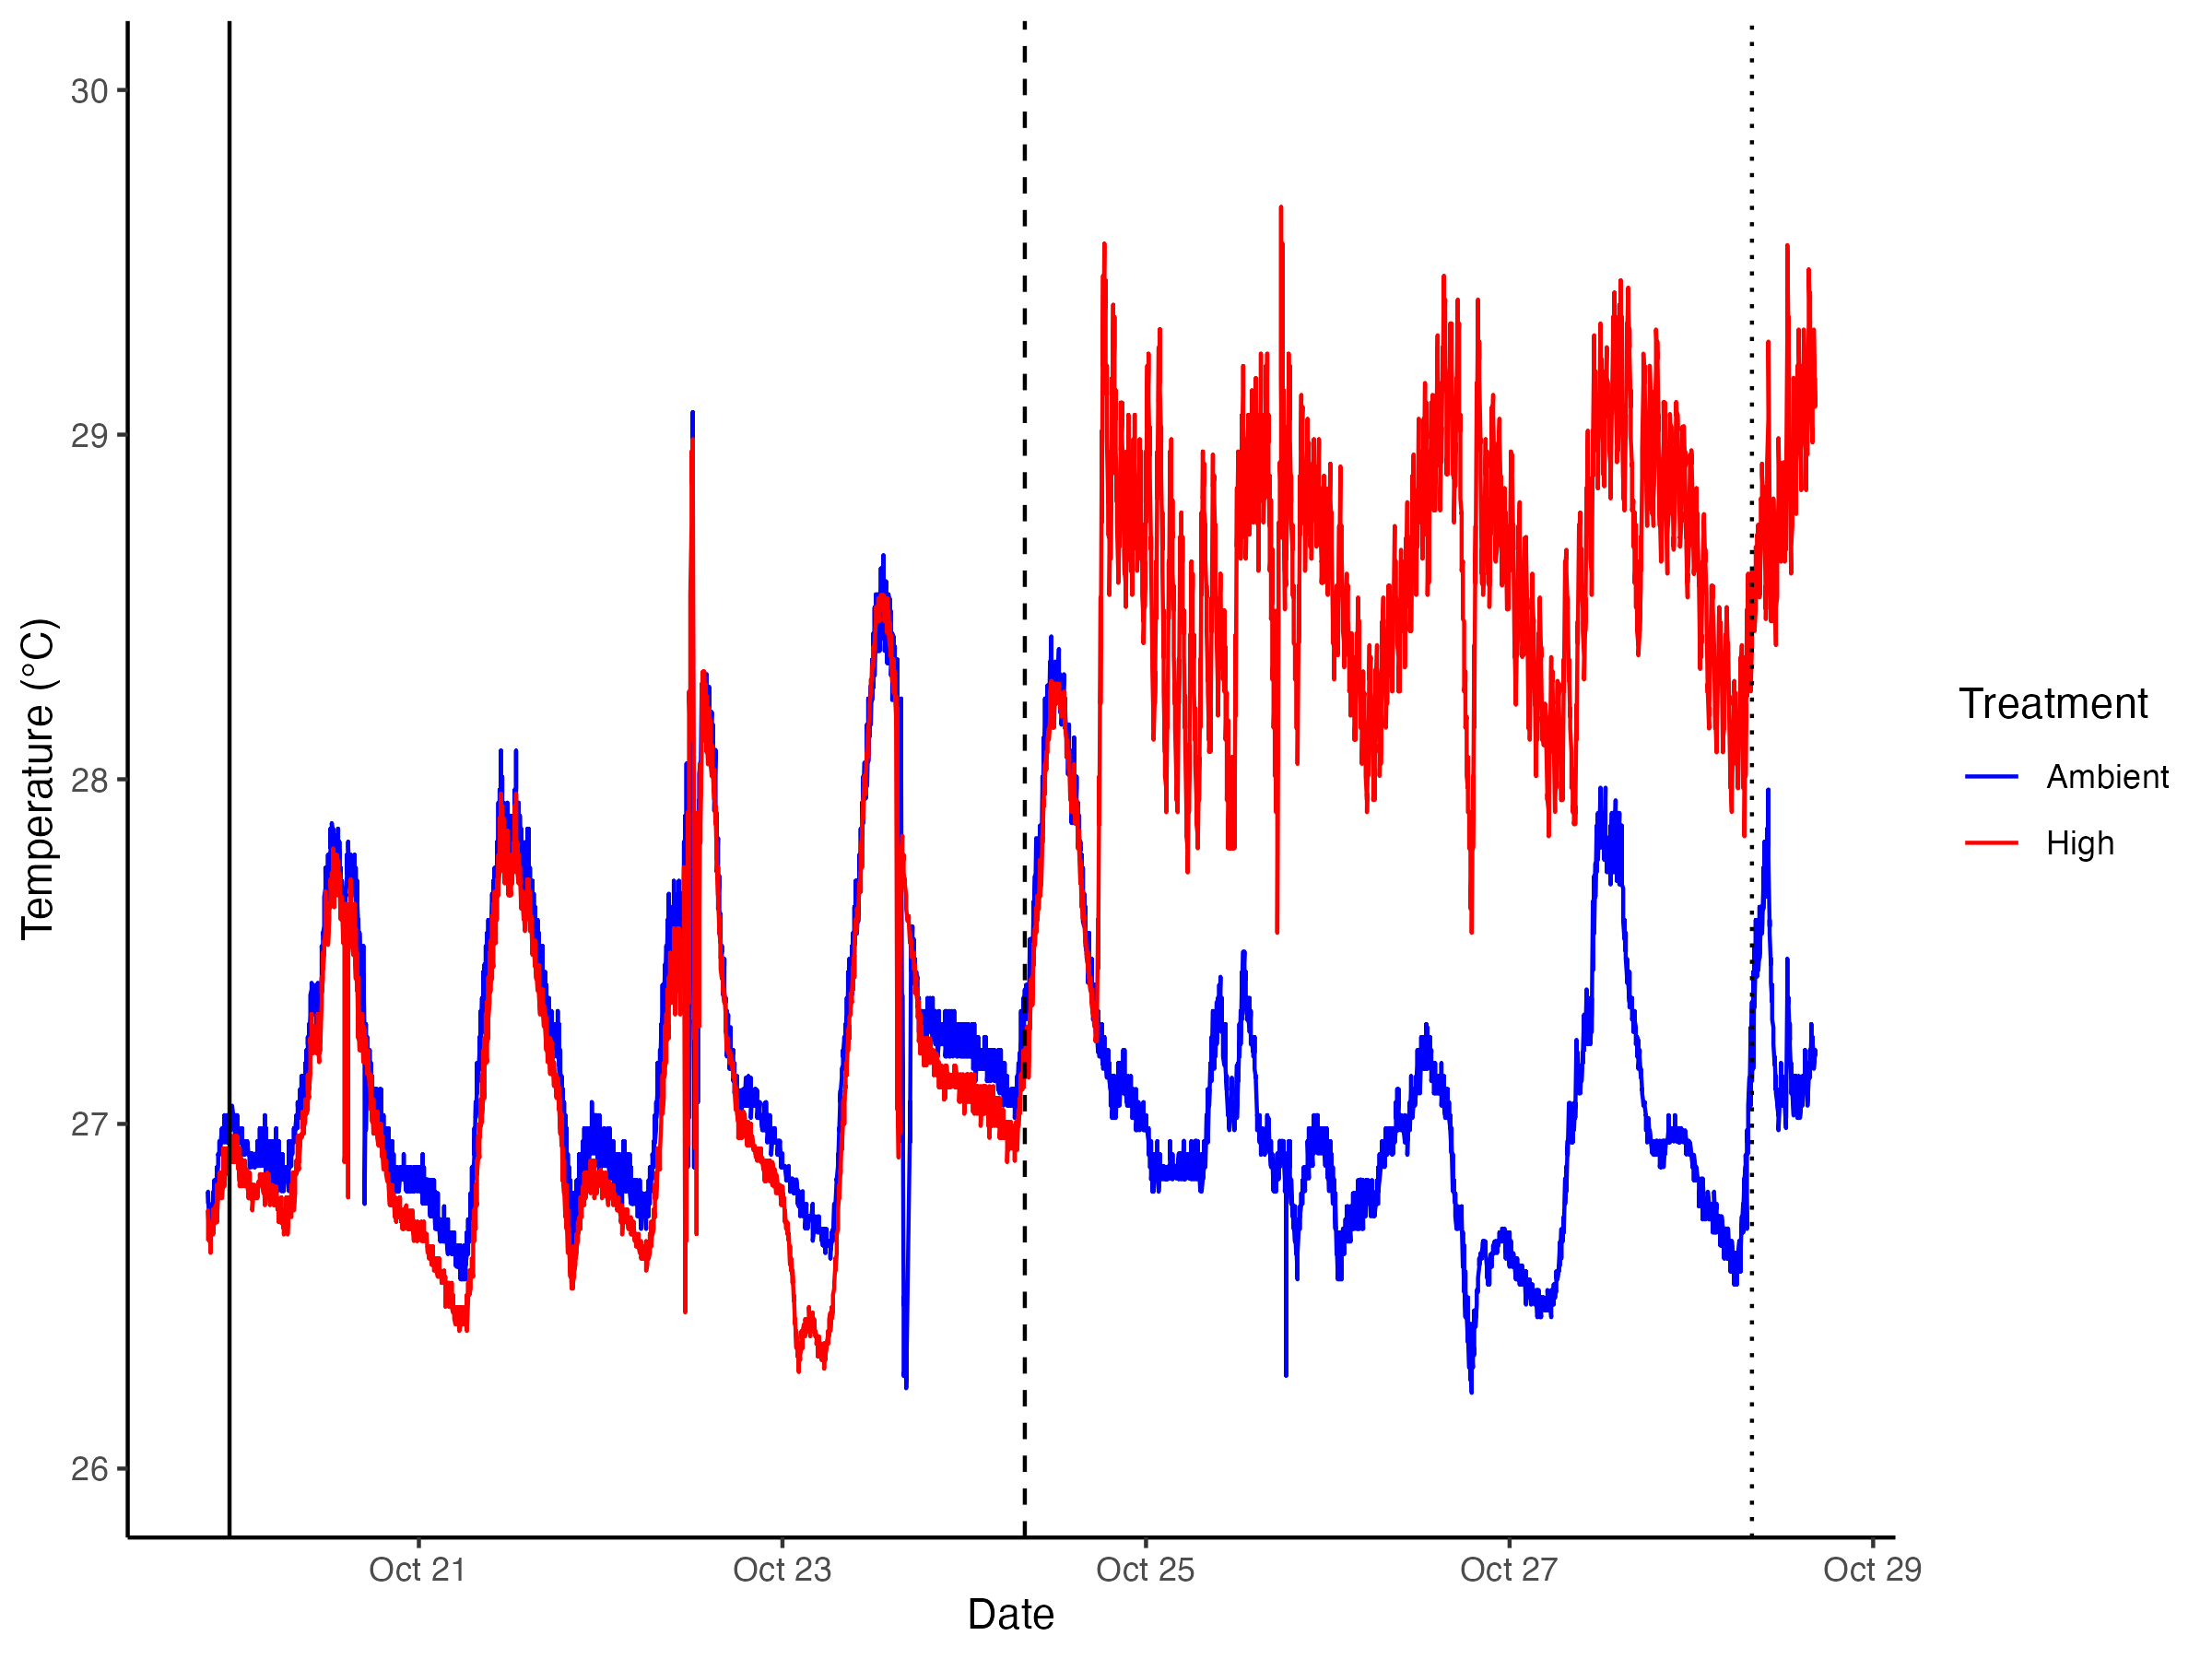
The solid line indicates the night of spawning that the cohort for this study was reared from. During embyro rearing to the larval stage, there was no temperature manipulation.
The dashed line indicates the start of temperature treatment and larval exposure.
Finally, the dotted line indicates the time of final sampling for this experiment.
Samples for this experiment were collected on days 1 (initial), 3 (mid), and 5 (final) of larval exposure.
As we can see from this data, the high temperature treatment was elevated above ambient by 1.5-2°C.
We can see a smooth projection of this temperature data in the figure below.
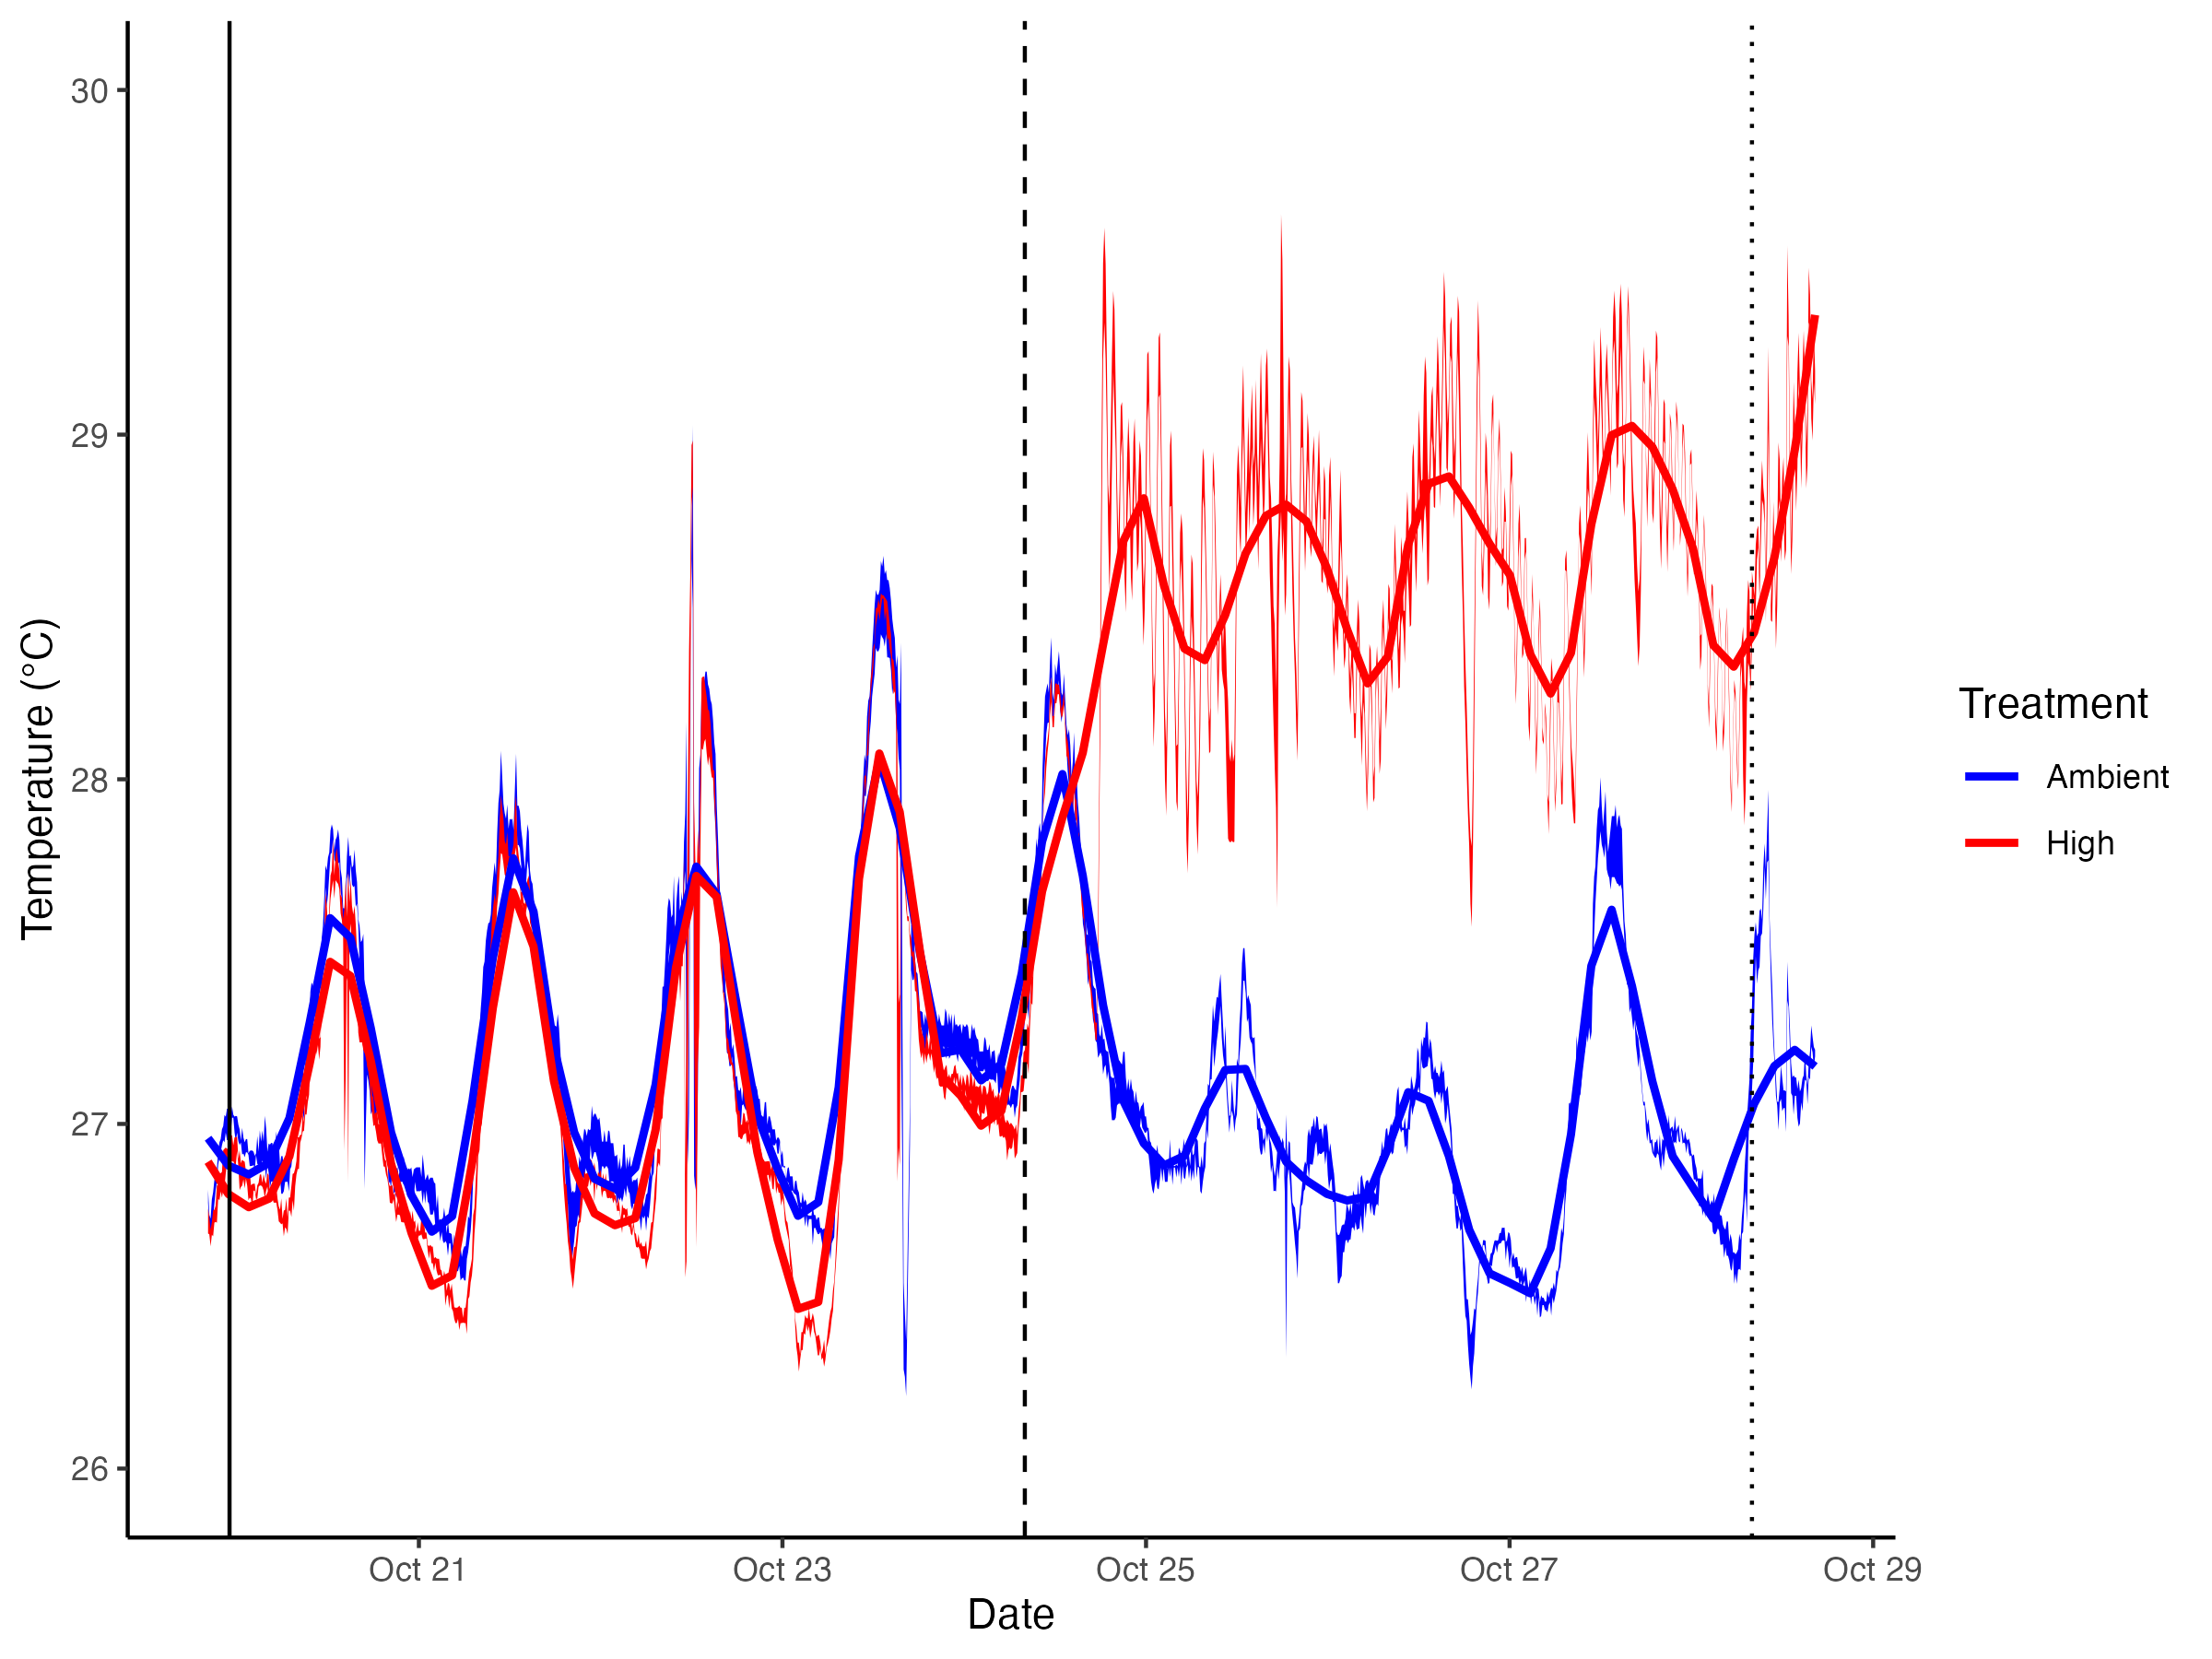
There was variation in the ambient temperature profiile, so the high temperature treatment does not directly match the diel profile of the ambient treatment.
Light Loggers
Light was also recorded by the Hobo pendant loggers. Loggers were calibrating by calculating an offset to the group mean of all pendant loggers (n=18 loggers).
Light values were recorded in Lux and converted to PAR/PPFD using the Apogee conversion factor of 0.0185 for sunlight.
Light over the course of the study is shown below.
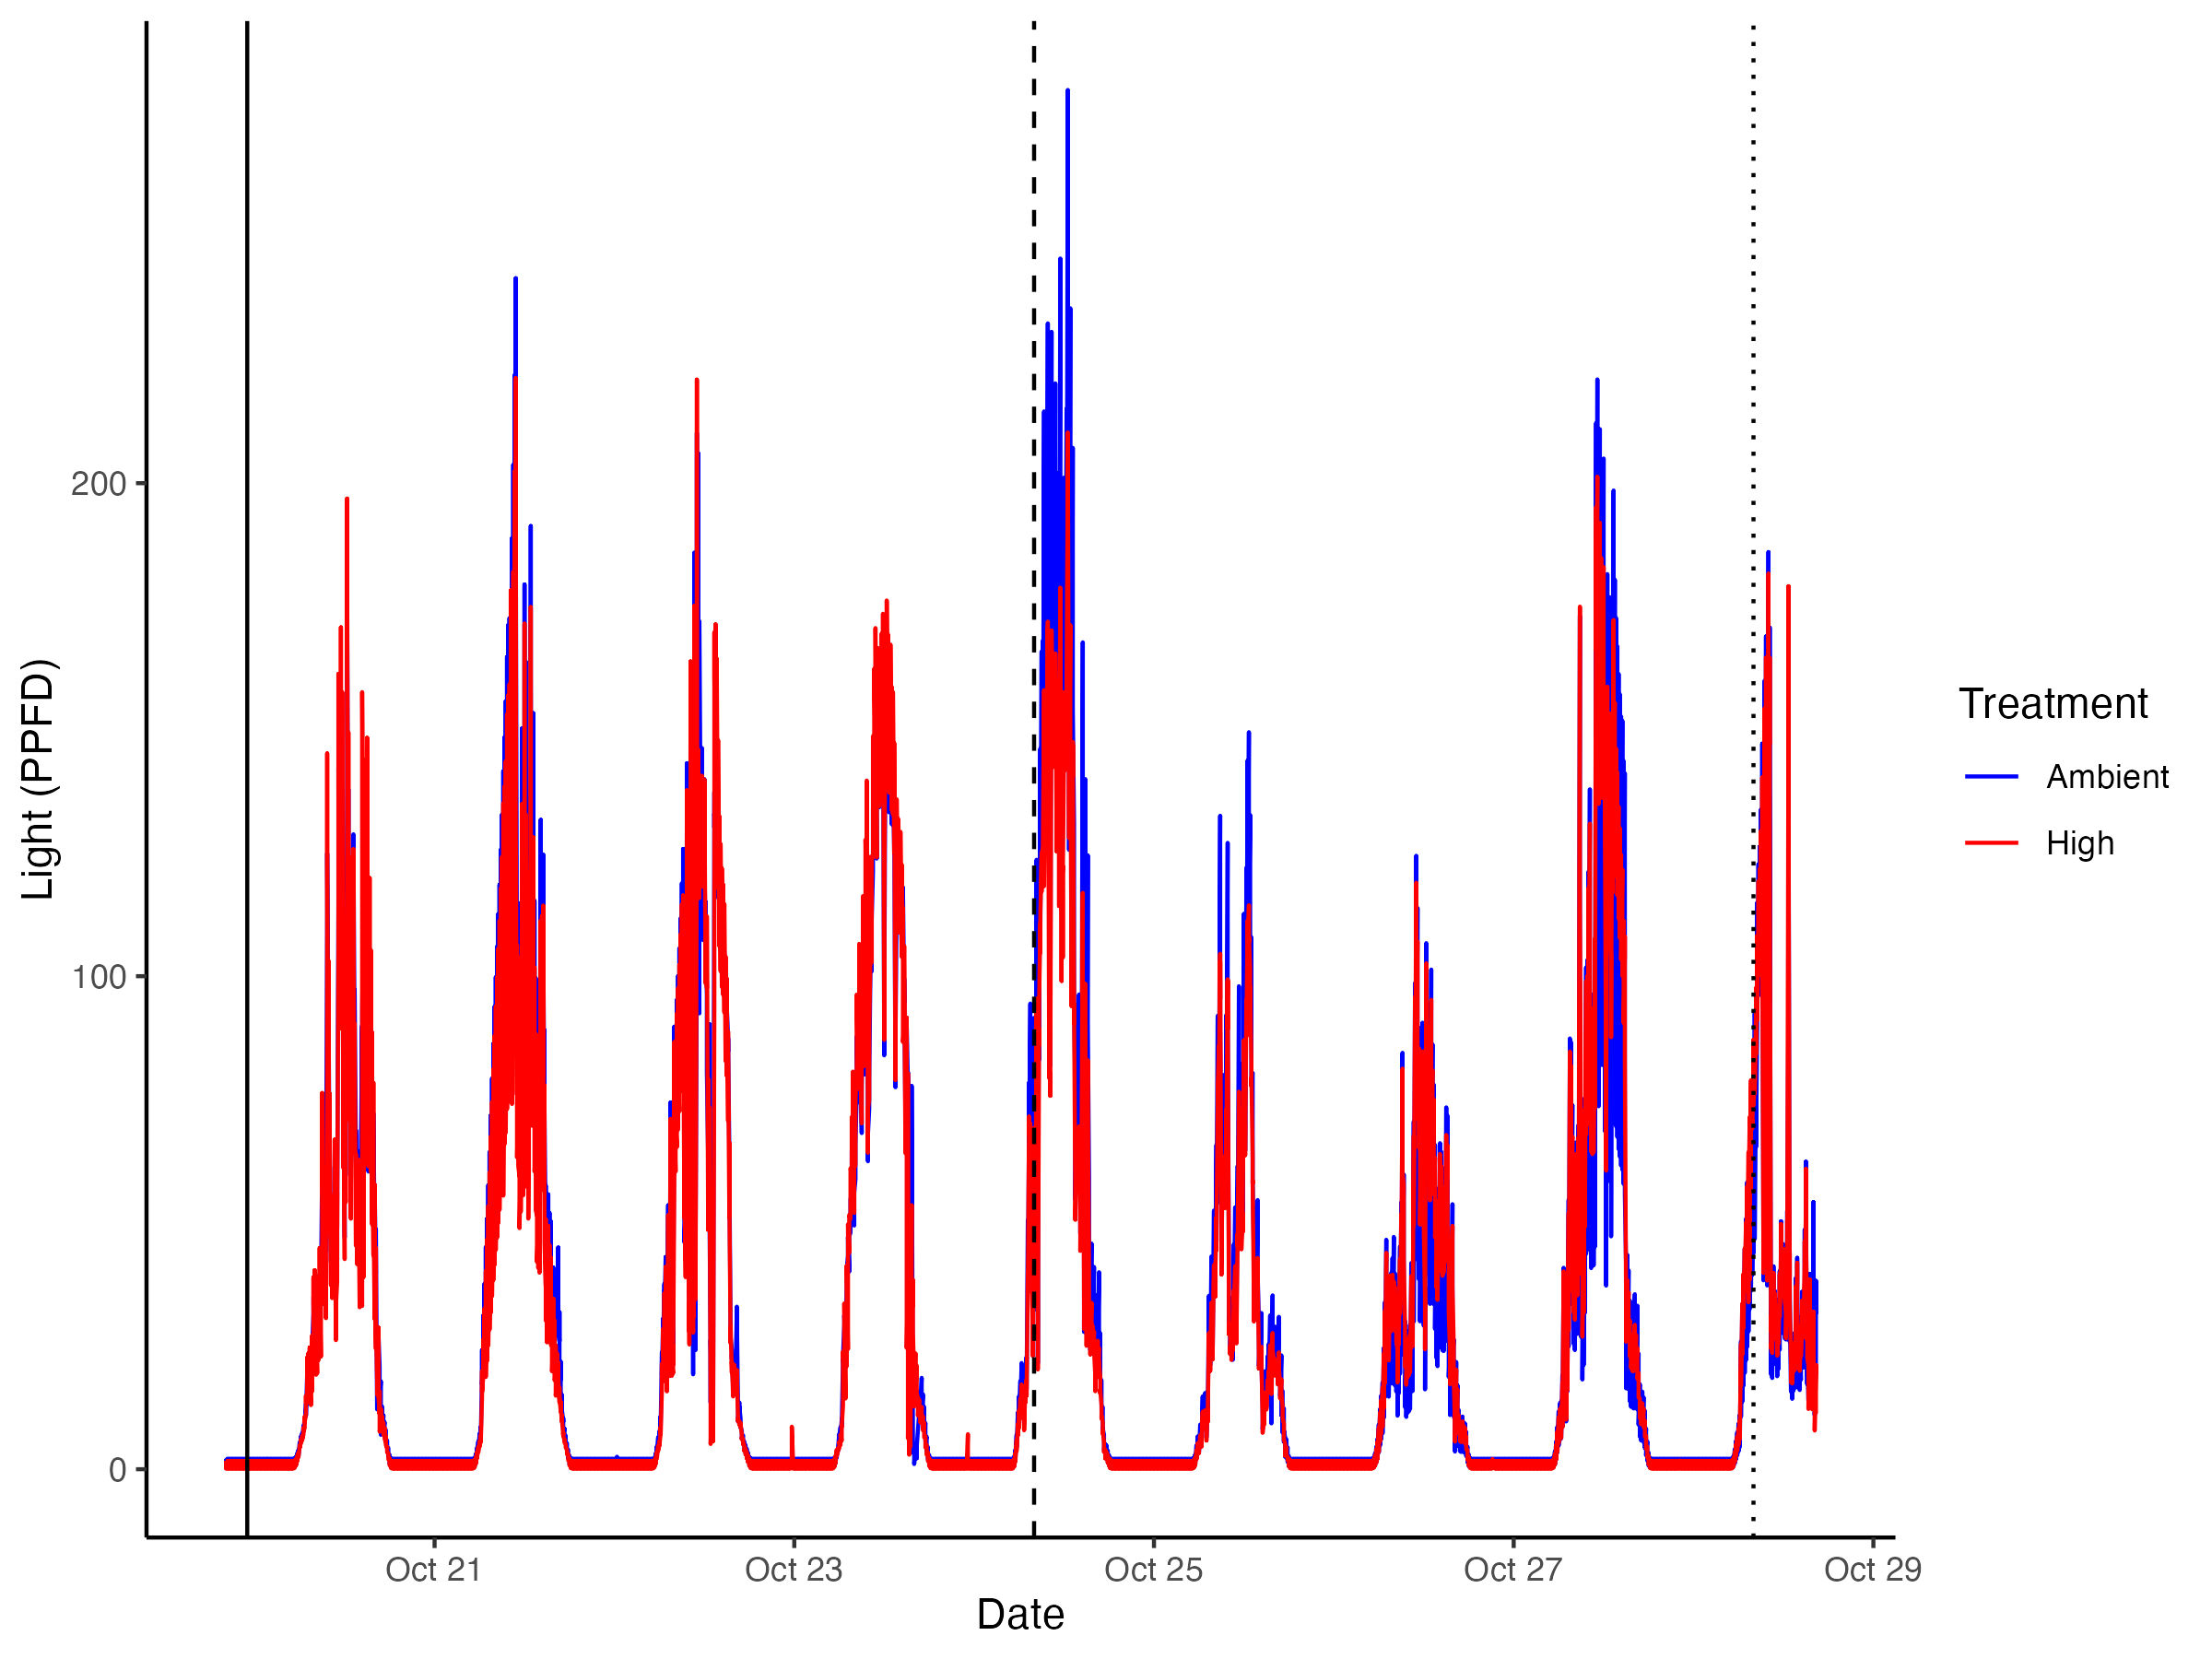
Light values peaked between 100-200 PAR during the day in larval tanks.
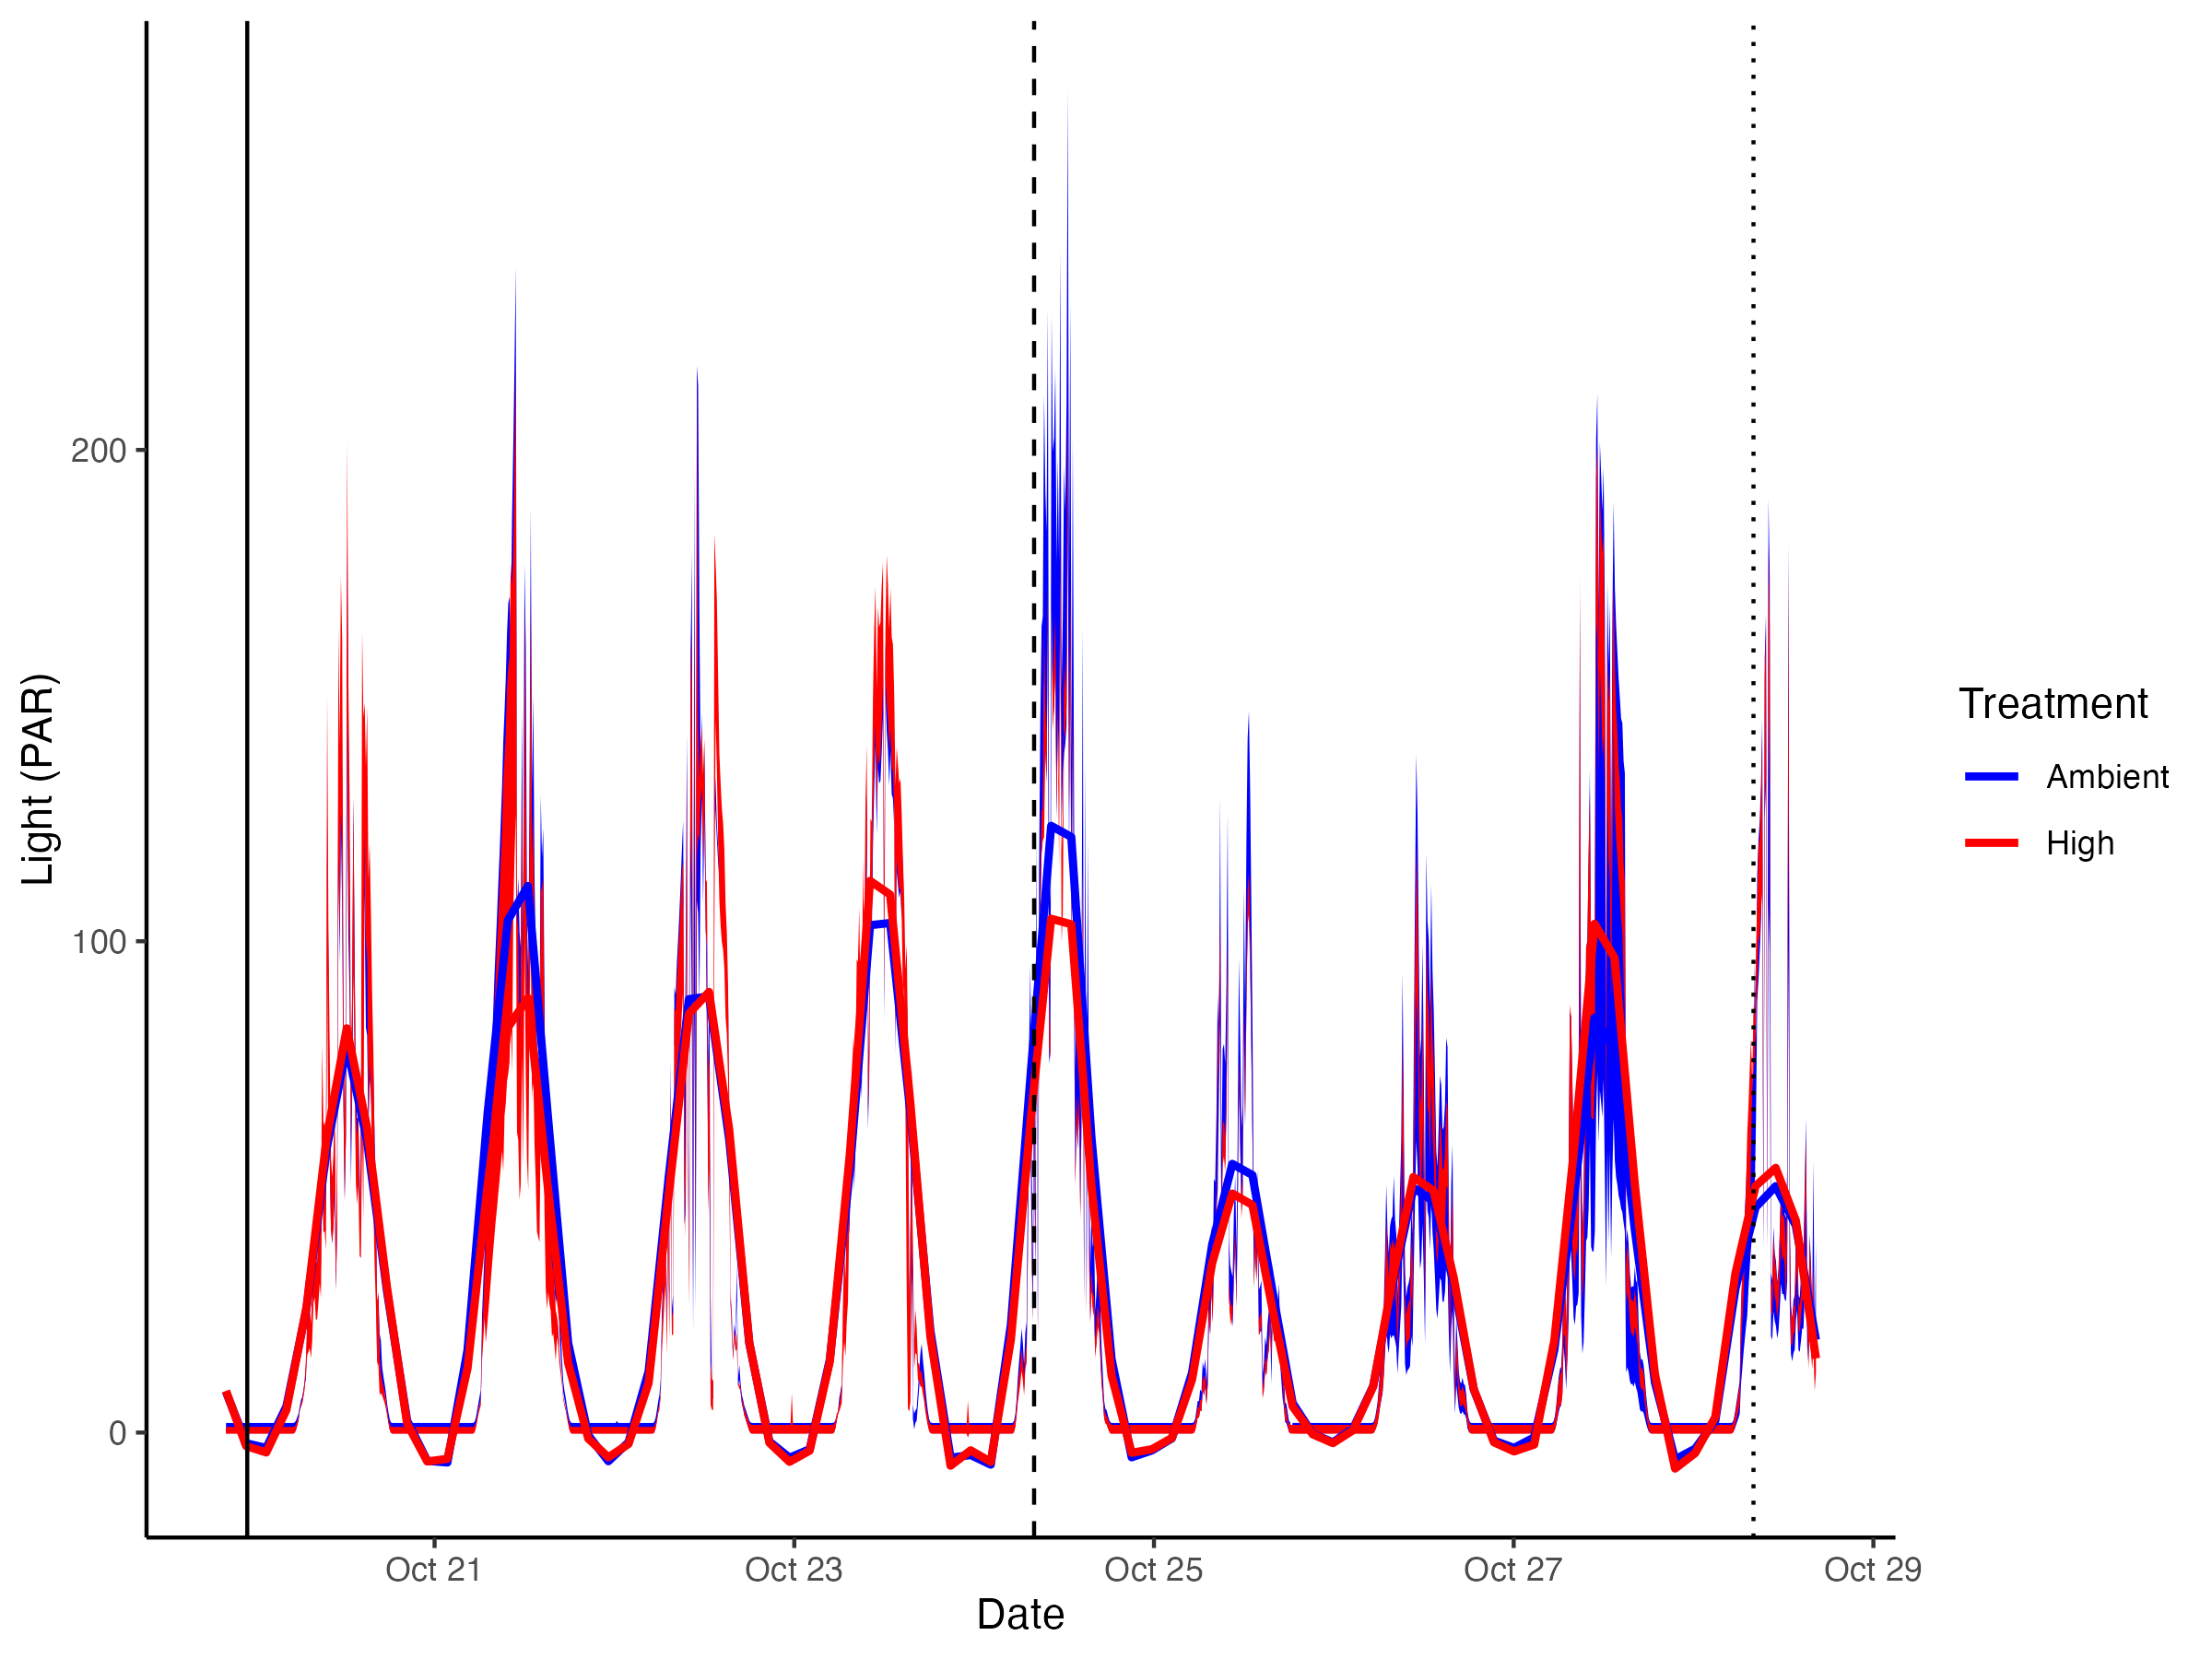
Light was similar between temperature treatments.
Daily Measurements
We collected daily meaurements for temperature, pH, light, and salinity in all larval tanks. Generally, these measurements were taken in the afternoon so the light values recorded during daily measurements are low (<50 PAR).
Daily measurements are shown in the figure below.
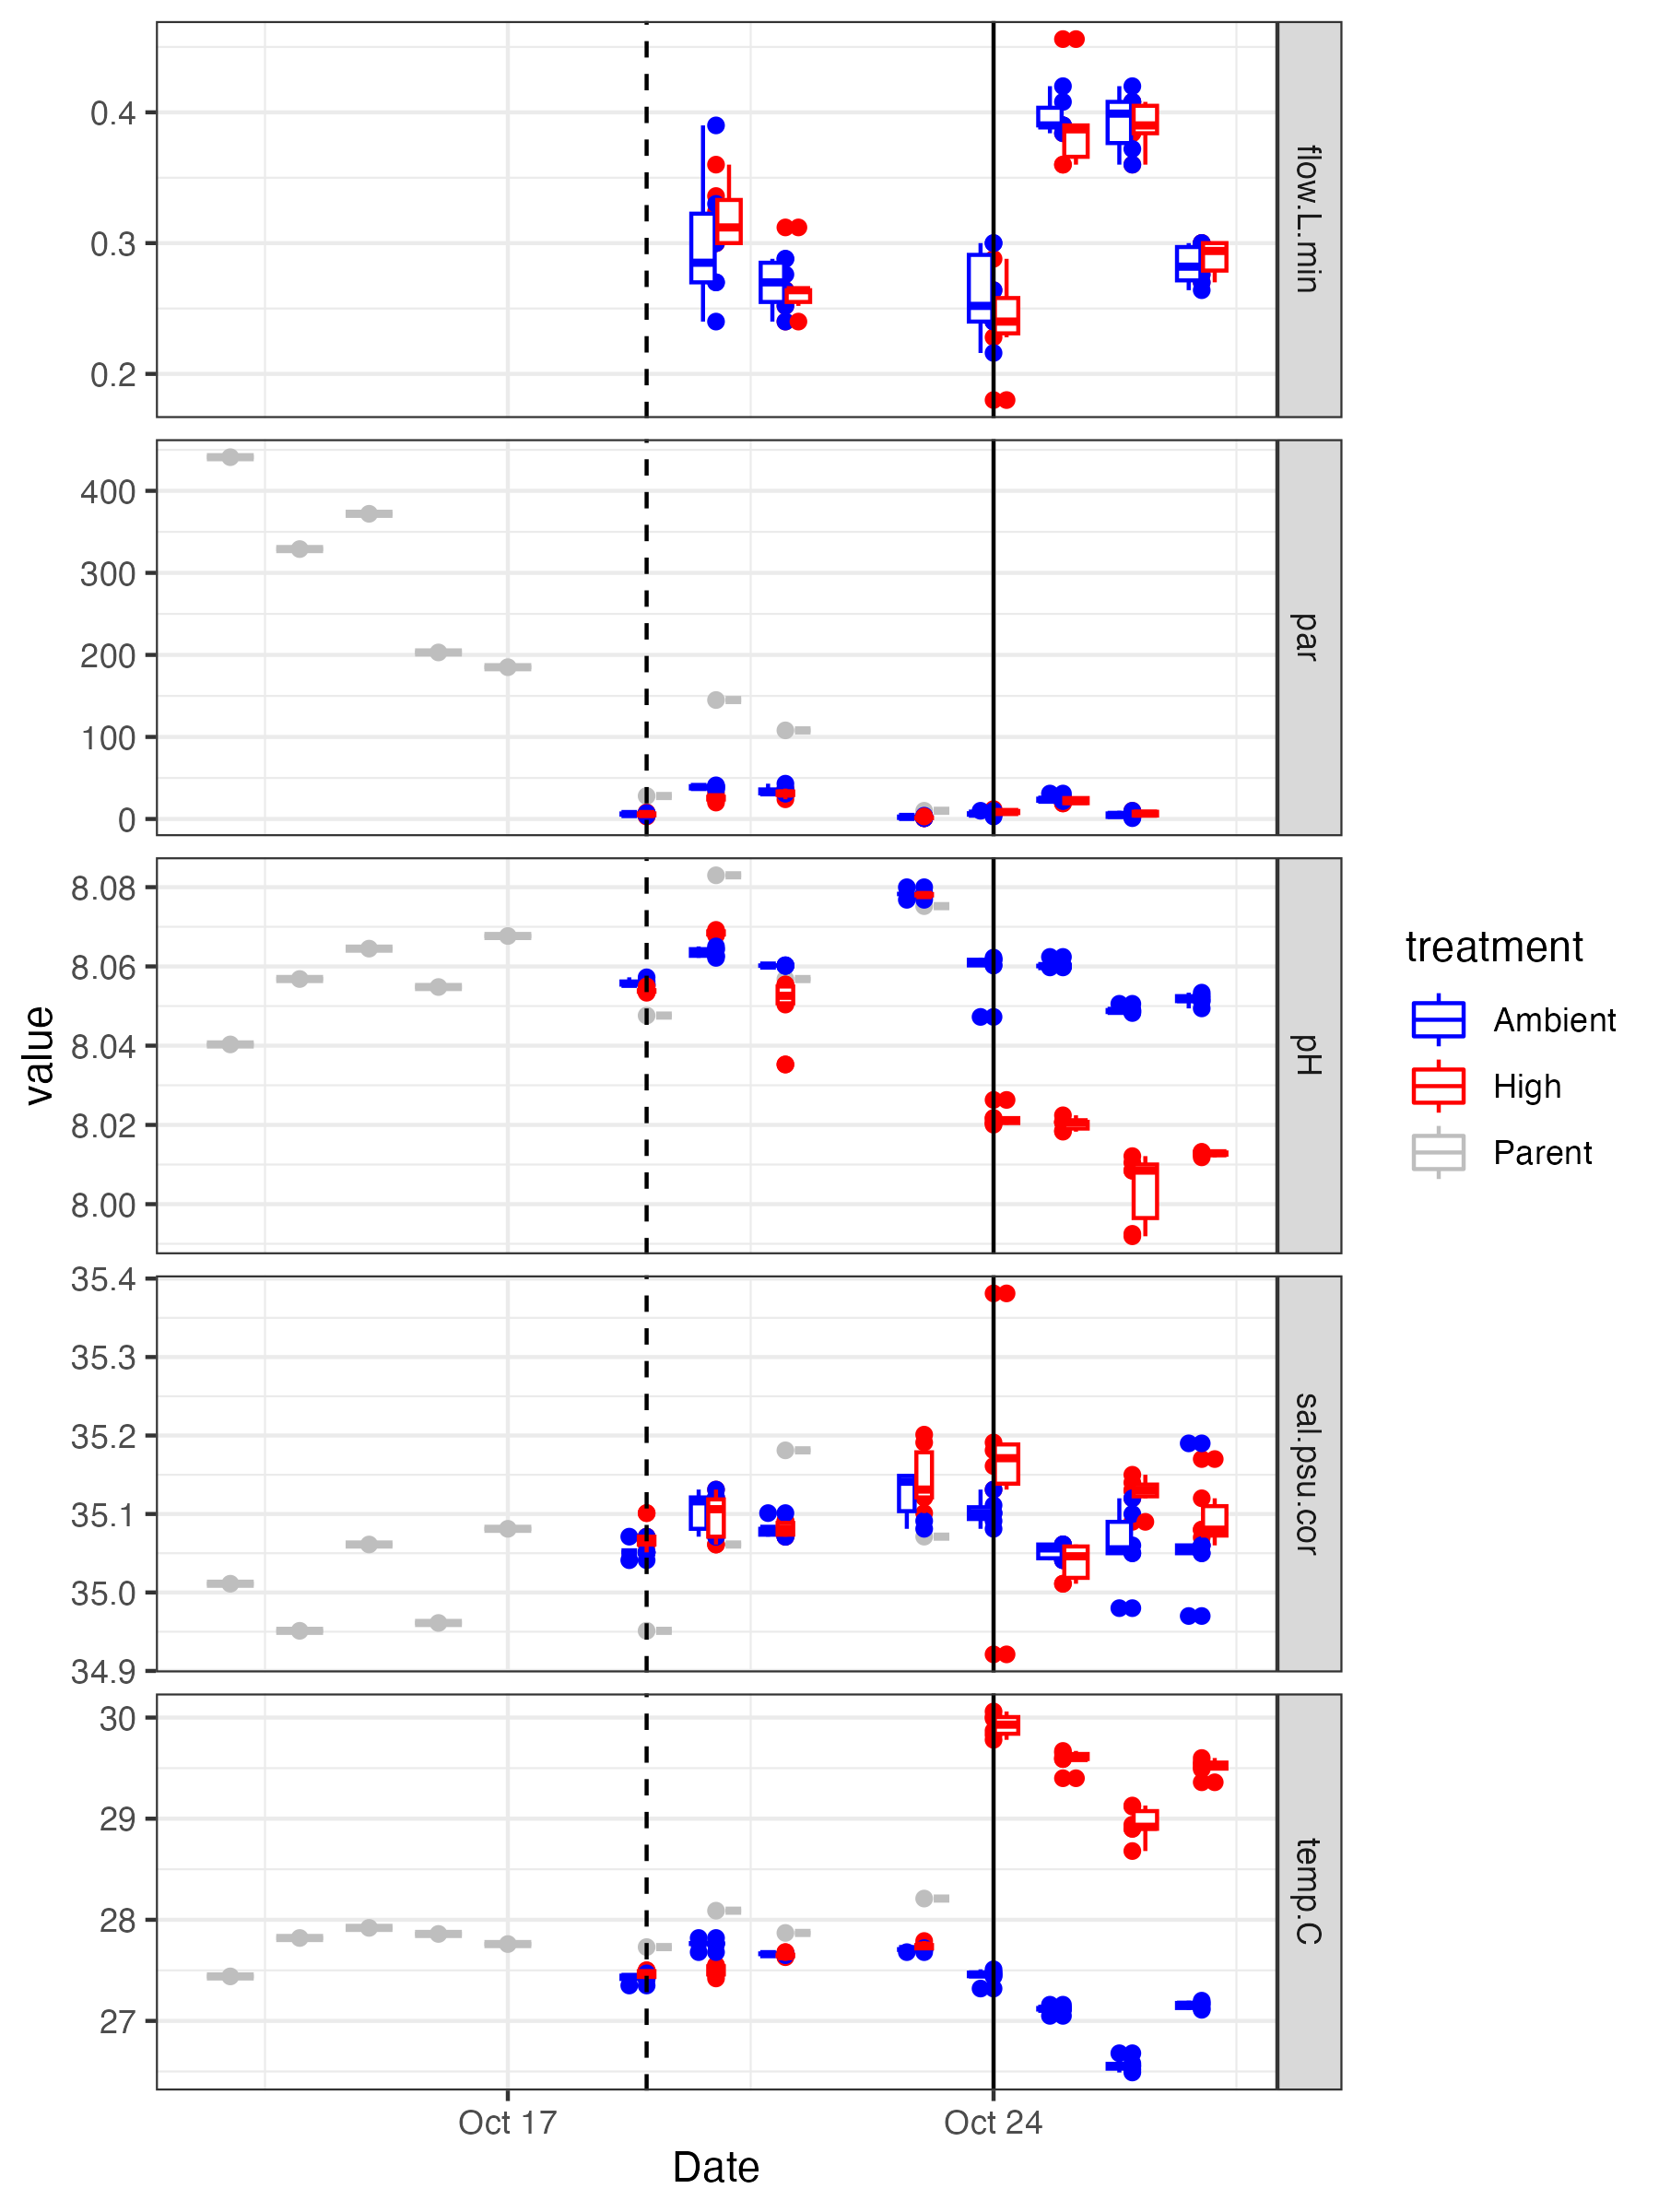
This figure also shows daily measurements collected in the adult parent tanks during the spawning period (gray).
The dotted line indicates the night of fertilization and start of embryonic rearing. The solid line indicates the start of larval exposure to elevated temperature.
Flow, light, and salinity were not different between treatments during the exposure period.
Temperature was clearly different between treatments with a mean difference of 2.4°C higher in the high temperature treatments. Note that these daily measurements were taken during peak temperature each day, so the high temperature treatment is at its maximum daily difference from ambient.
Further, pH was different between temperature treatments. However, this difference was small (0.04 units in total pH).
This is potentially due to increased water ionization at higher temperatures and therefore more hidrogen ions and/or due to higher respiration of larvae at these higher temperatures.
A summary of variables measured is shown in this table. For each metric, mean and standard deviation (sd) is shown. Values are shown for parents, embryo/larval rearing, and larval exposure periods.
| period | treatment | flow mean | flow sd | par mean | par sd | pH mean | pH sd | sal mean | sal sd | temp mean | temp sd |
|---|---|---|---|---|---|---|---|---|---|---|---|
| Spawning | Parent | NA | NA | 306 | 109.95 | 8.05 | 0.01 | 35.01 | 0.05 | 27.76 | 0.18 |
| Embryo Rearing | Ambient | 0.28 | 0.04 | 20.33 | 16.90 | 8.06 | 0.01 | 35.09 | 0.034 | 27.63 | 0.13 |
| Embryo Rearing | High | 0.29 | 0.03 | 15.95 | 13.19 | 8.06 | 0.01 | 35.09 | 0.03 | 27.58 | 0.12 |
| Embryo Rearing | Parent | NA | NA | 72.75 | 64.29 | 8.06 | 0.01 | 35.06 | 0.09 | 27.97 | 0.21 |
| Exposure | Ambient | 0.33 | 0.06 | 11.94 | 9.59 | 8.05 | 0.01 | 35.06 | 0.04 | 27.06 | 0.32 |
| Exposure | High | 0.32 | 0.07 | 12.55 | 7.80 | 8.01 | 0.01 | 35.10 | 0.08 | 29.49 | 0.37 |


