


Comparing TagSeq between genome assembly V1 and V2
This post details analysis of TagSeq data from previous alignment to M. capitata version 1 assembly and version 2 assembly.
Comparing TagSeq results between M. capitata genome assembly versions 1 and 2
Recently, a new version of the M. capitata genome was made available from Rutgers University at http://cyanophora.rutgers.edu/montipora/. To see how this new version impacts our alignment with our TagSeq data, I am running the bioinformatics pipeline used previously with the new version that is available here. The purpose of this analysis is to see whether the clear lifestage comparisons found in previous analysis are still present when working with the new assembly.
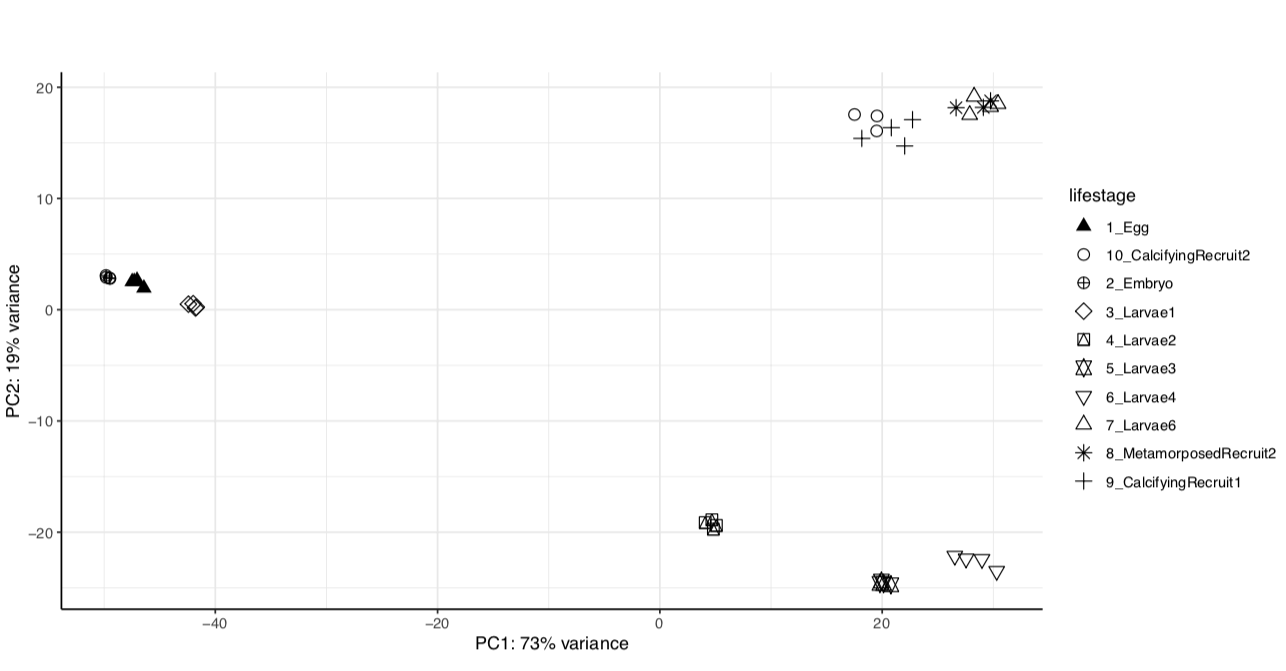
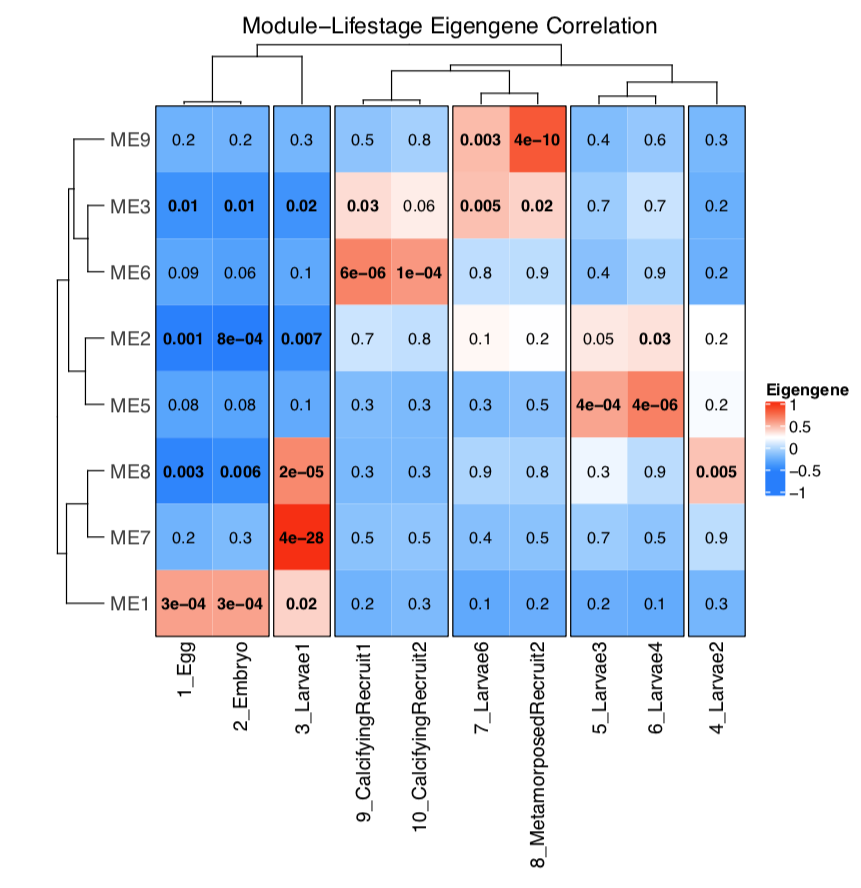
Previously, our analysis shows clear lifestage separation in our gene expression data obtained through TagSeq sequencing and WGCNA analysis.
Bioinformatics Pipeline
I am using a bioinformatics pipeline code adapted for a revised approach available (linked above) in my GitHub that uses the following general steps. Previous analysis did the QC, trimming, and filtering steps. We are starting up at the alignment step.
- Align sequences to the reference (V2) with HISAT2 and generate .bam files for each sample.
- Generate gene abundance tables and gtf files for each sample with StringTie2
- Generate gene count matrix with prepDE
After running this pipeline we get a new gene count matrix.
Results of revised analysis with genome V2
We have the same strong lifestage groupings in both versions of the genome assembly.
Version 1:
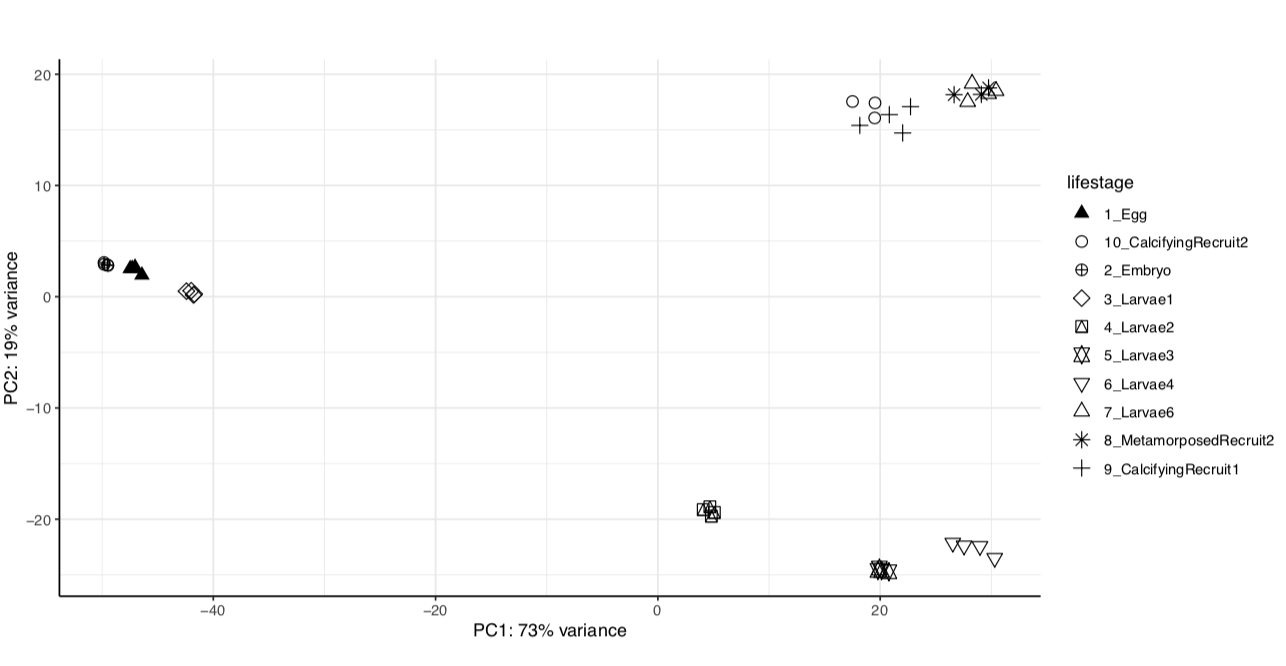
Version 2:
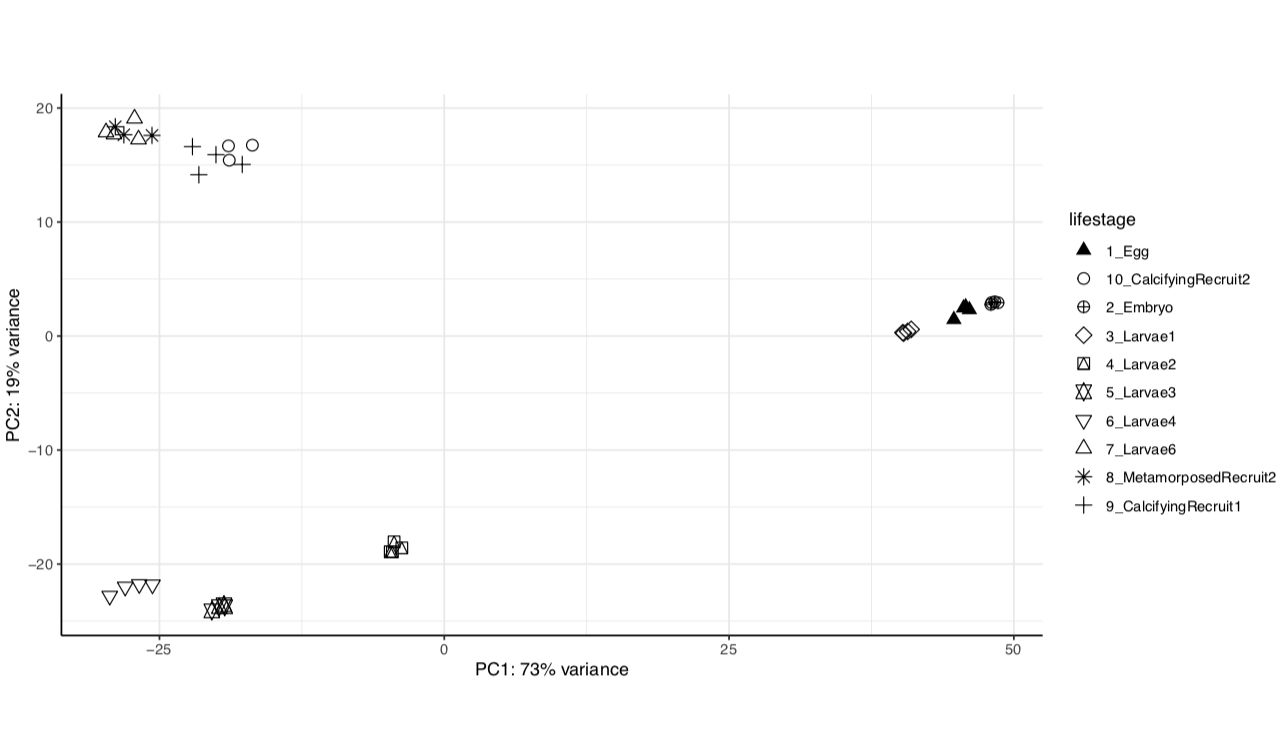
From these we see that the same percent variance is accounted for in each version and the groupings follow the same pattern. We can proceed with using the newer version of the genome assembly, which will require functional annotation.