


E5 Environmental Timeseries Analysis Part 1
This post details environmental time series QC and plotting for the E5 Rules of Life project.
Overview
All scripts and figures can be found on the E5 GitHub repo.
The purpose of this analysis is to generate a full time series of data for temperature, pH, and light (PAR) for the E5 project. This data spans across 4 time point periods and 3 sites in Moorea.
Obtaining data from each respective time point
For each part of the time series (4 periods), we have data from Hobo temperature loggers (temperature), pH loggers (temperature and pH), light loggers (PAR), and conductivity loggers. Conductivity is not used as these data were not reliable.
First, I QC’d the data sets and scripts for each time point and then generated an output file for each metric for each time point.
Combining and curating the full time series
These files from each time point were then loaded into the integration_environmental.Rmd file (time series analysis folder in our Git repo) and I used rbind to join them together. Note that the exact time stamps are not going to match across all loggers, so this file will generate NA’s for any missing time points. This does not cause any problems for downstream analyses.
I then generated a figure of the joined data files across the entire time series with the raw data. The data looked like this:
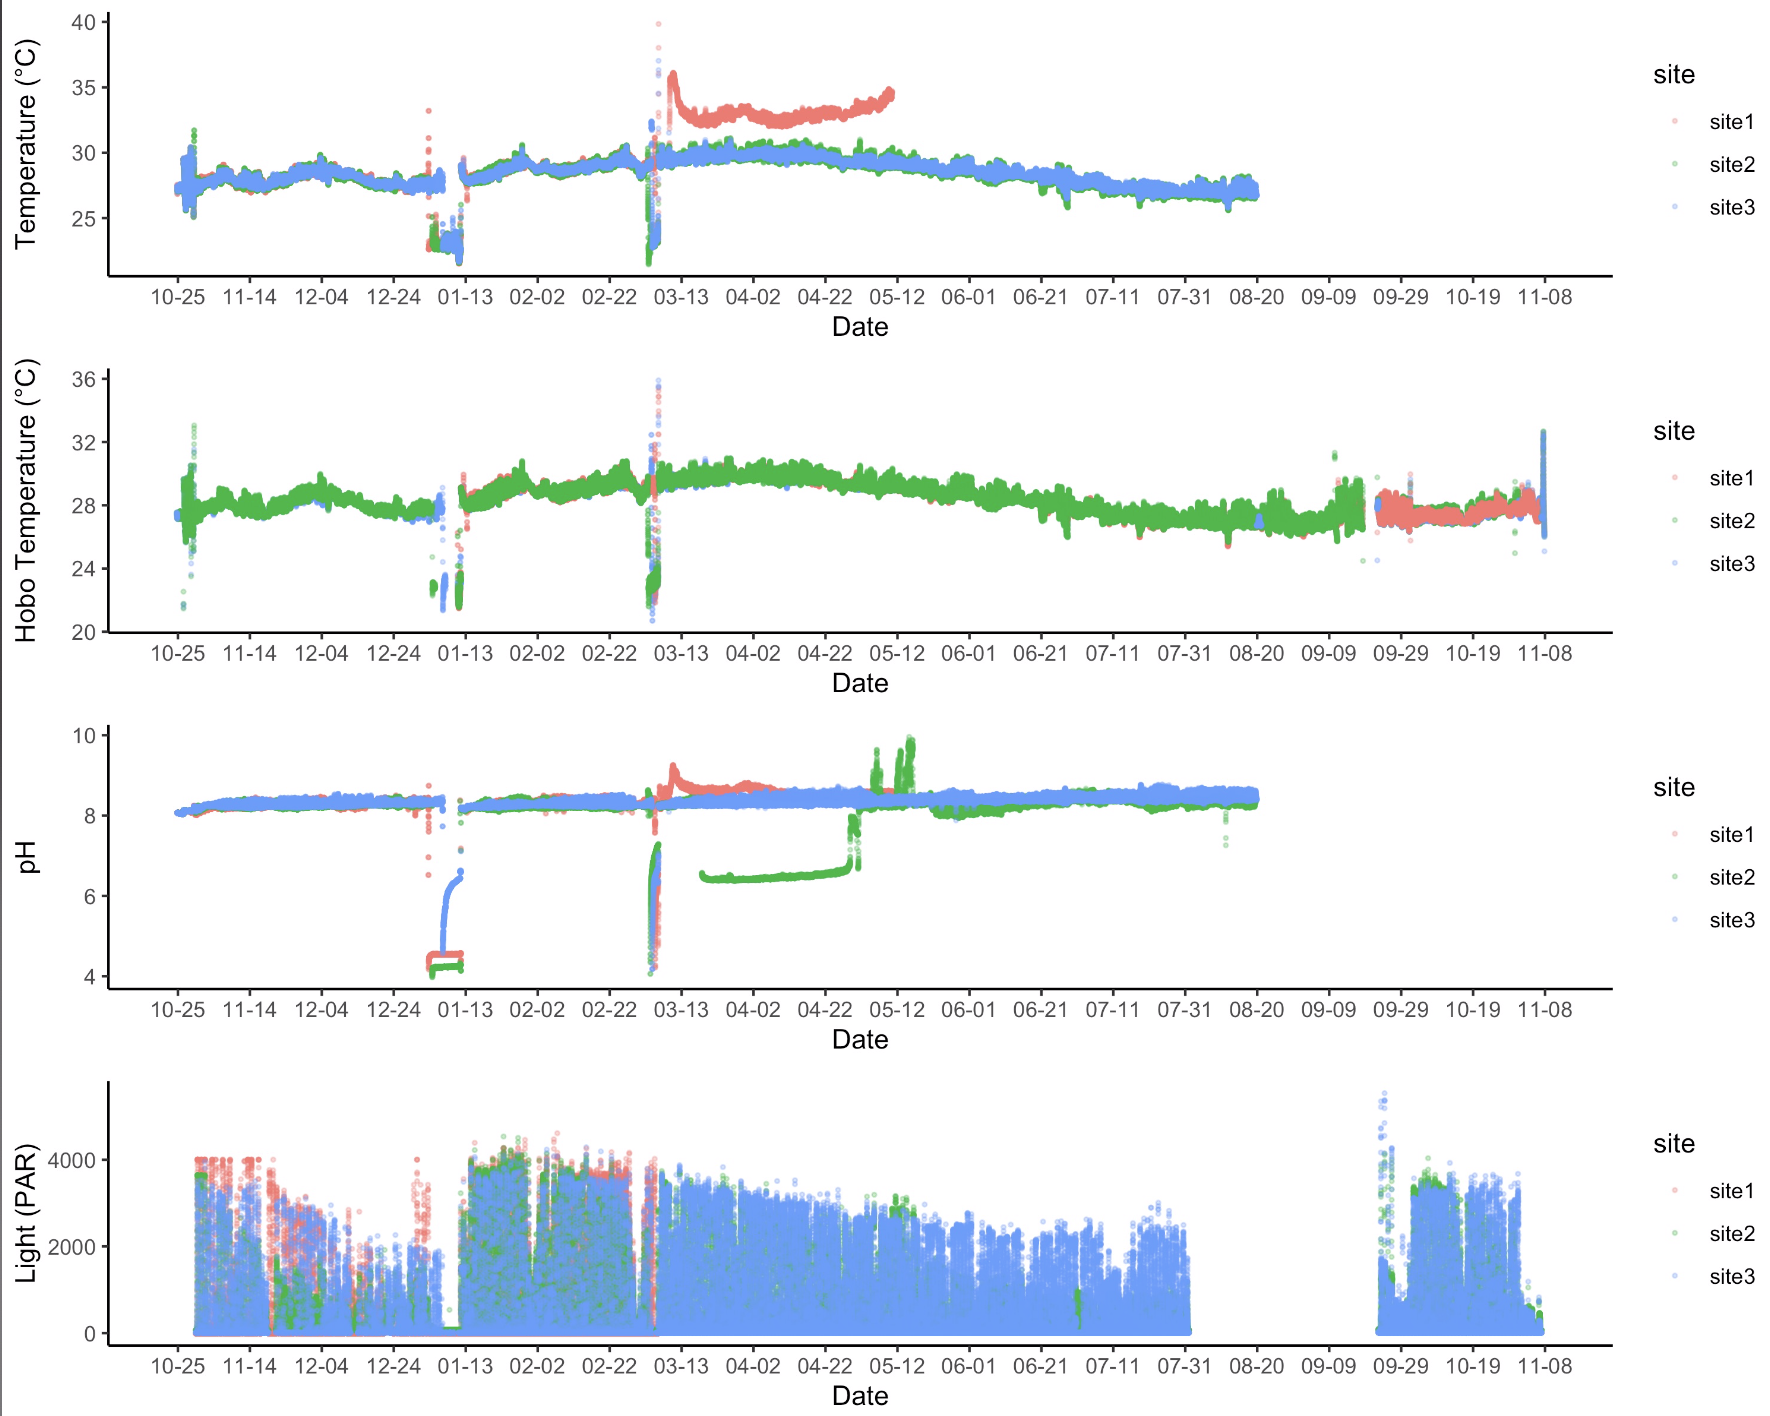
Here are some observations of these data:
- The top panel shows temperature obtained from the pH/temp loggers. We notice that this data set does not extend into TP4. We need to check to see if these data are available for TP4, they are currently not in the repo. We also notice there are several dips in these data that likely reflect offloading/deployment dates. For temperature (top panel) and pH (third panel), there is a “jump” in the data with the probes reading higher values following the jump. These data will need to be removed.
- The second panel is temperature from the Hobo loggers. This is our most complete dataset. However, there is no data for site 1 from time point 1 for the Hobo loggers. We need to check to see if these data are available for site 1, they are currently not in the repo. If these data are not available, we can try to combine the temperature datasets for missing values (see clean data below).
- pH data has several periods of probe errors that will need to be removed (e.g., site 2 dip during time point 2).
- Light data was deployed 3 times in this time series (not present for TP3). We can see after deployment that there is a gradual decline in light values, likely due to biofouling. We can instead pull light data from the first portion of each deployment for representative light measurements across sites.
QC and cleaning data sets
I removed data from the above time periods (probe errors, deployments, etc.) to generate a “clean” dataset. This is what the data look like after QC:
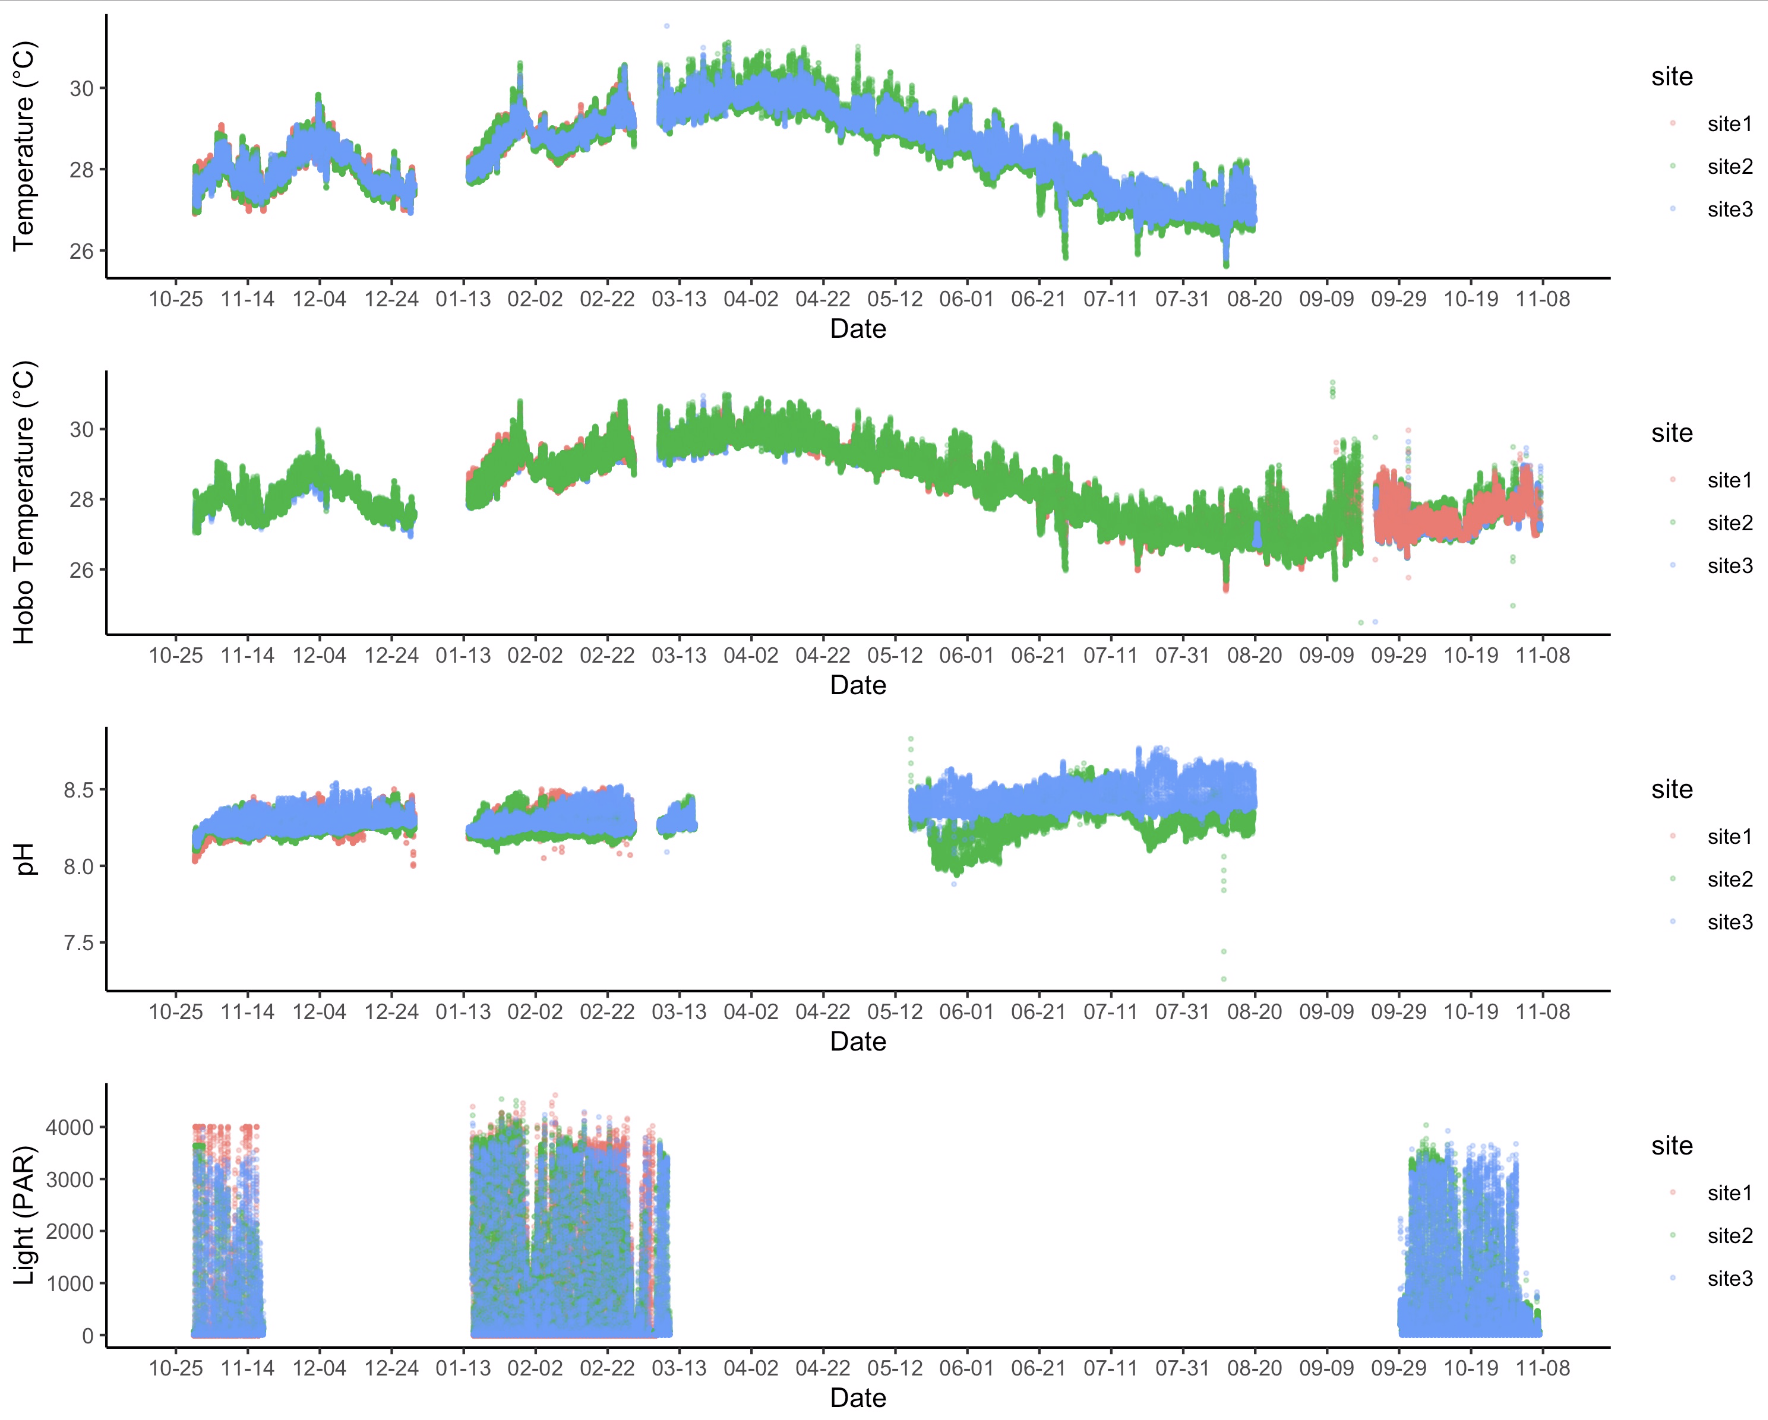
The QC has removed periods of probe error, deployments, and other issues and we can now work with this dataset. I generated summary statistics that are available in the output folder.
Additional outstanding question: For timepoint 3, is site 2 pH data “real” or a probe artifact? We know that the probe appears to malfunction before this point (see raw data above) and the values are lower than for site 3 than I would expect based on earlier points in the time series.
Although we are missing large portions of the time series, this data should give us a representative understanding of how the conditions across the sites vary.
Temperature data sets
The Hobo data set is definitely the most complete. To see if we could fill the gaps from data collected from pH loggers, I ran a correlation between these measurements.
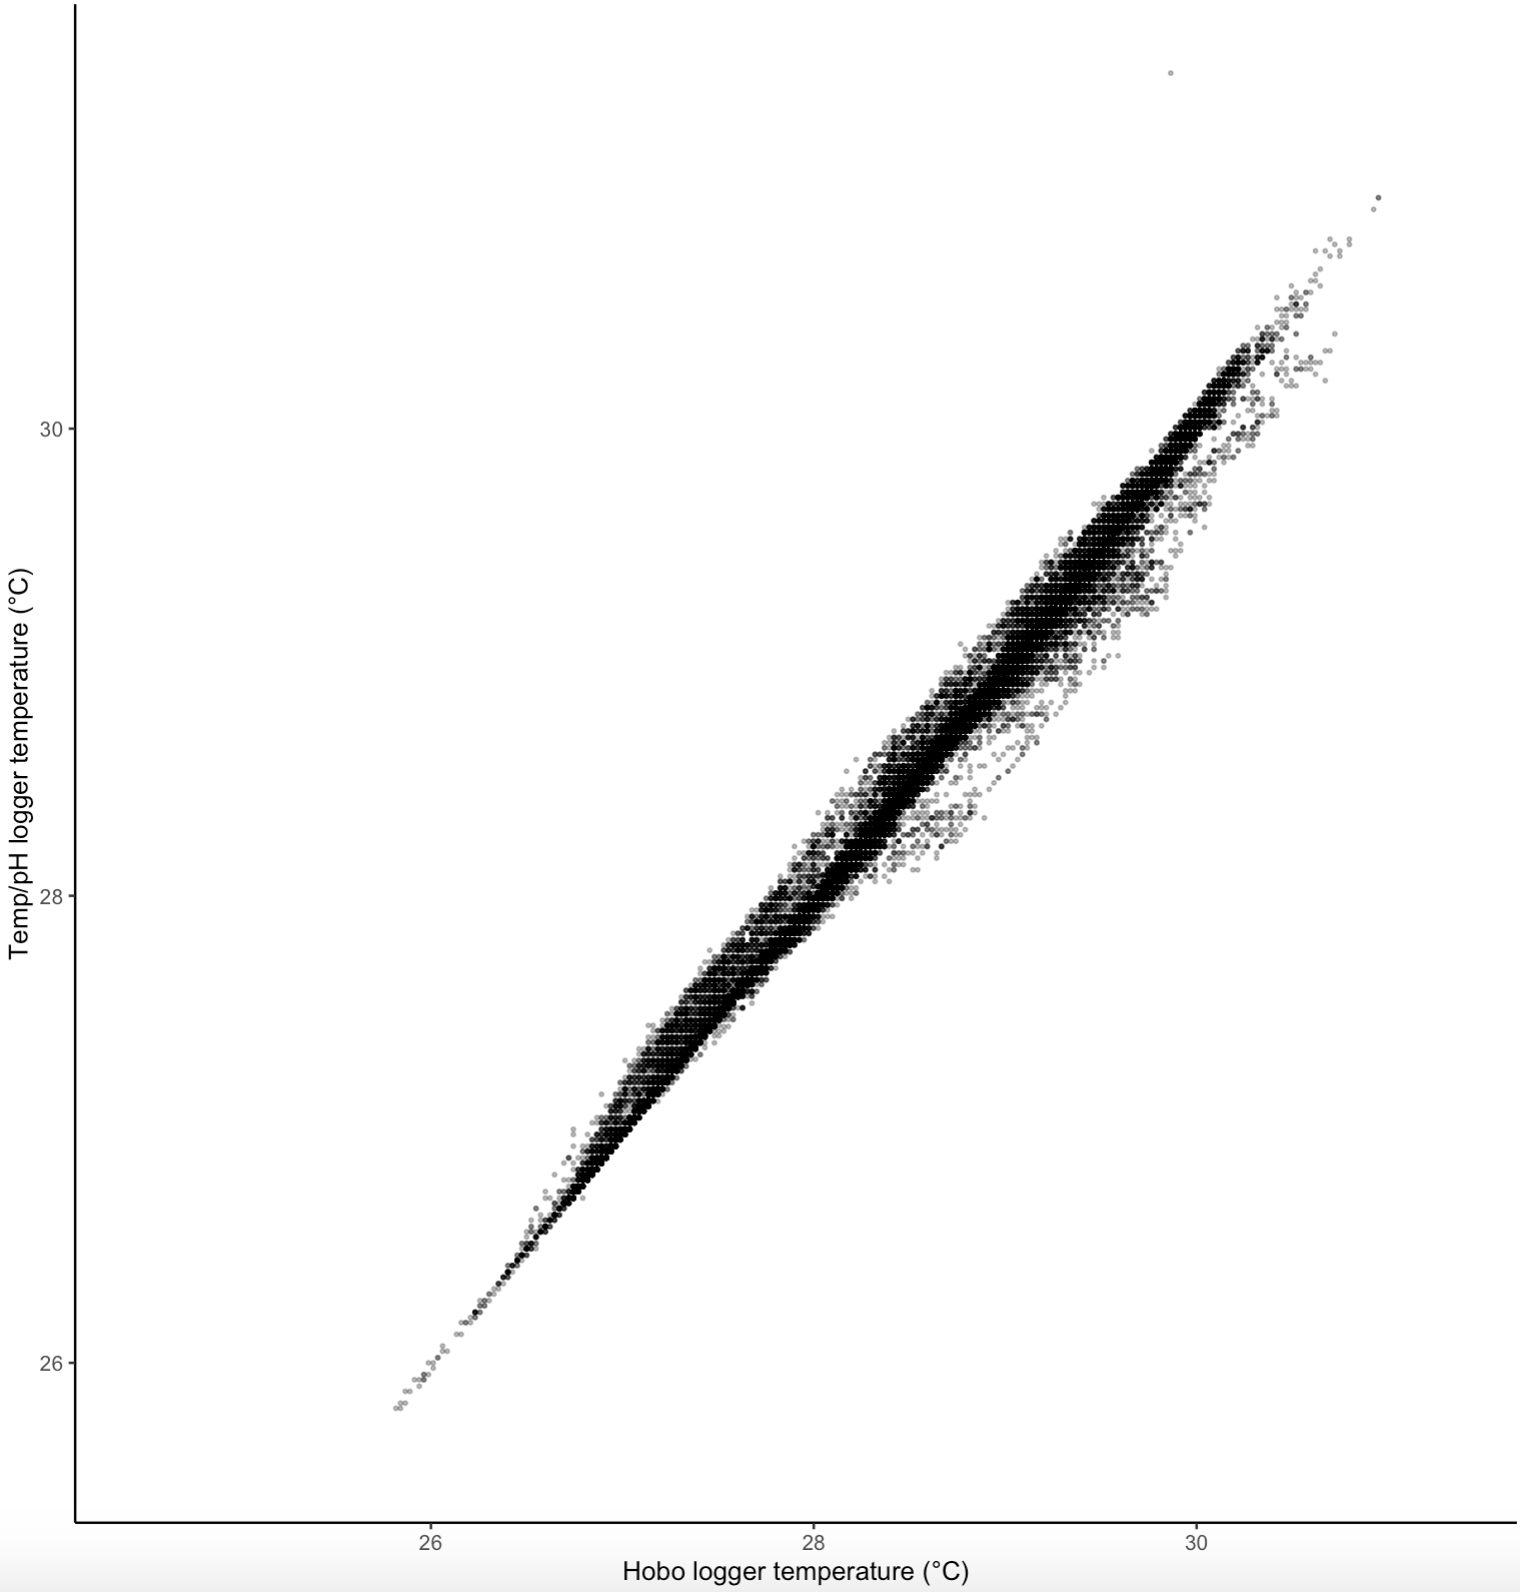
These data are clearly highly correlated. It seems like an option for us to “fill the gaps” between datasets if needed.
Next steps
- Decide on which temperature data set we would like to use (Hobo or temp/pH).
- Generate more detailed summary statistics of each data set.
- Statistical analysis of differences in sites.
- Generate figures for publication (e.g., spider plot and final tables).
- Decide on pH data validity for site 2 during time point 3.