


Mcapitata Development ITS2 Analysis Part 1
This post details MultiQC for the ITS2 analysis pipeline. 16S files are analyzed in a separate post.
ITS2 MultiQC
1. Log onto Andromeda and go to working directory
Log into Andromeda
ssh -l ashuffmyer ssh3.hac.uri.edu
Enter password, then navigate to working directory.
cd /data/putnamlab/ashuffmyer
cd AH_MCAP_ITS2
2. Create a conda environment
Download miniconda and then create a conda environment.
Load modules that are required.
interactive

module load Miniconda3
Verify that you are working with Miniconda.
which python, this should return Miniconda version.
Create a conda environment.
conda create -n AH_MCAP_ITS2 and enter y for proceed.
Activate the environment.
conda activate AH_MCAP_ITS2
When done working, use conda deactivate AH_MCAP_ITS2
Note that you have to activate the environment each time you work in this environment.
After activating the environment, the line should now look like this:
(AH_MCAP_ITS2) [ashuffmyer@ssh3 AH_MCAP_ITS2]$
3. Check that programs are available
Check for available modules that will be needed. If needed, contact URI to ask for modules to be added.
module load Miniconda3/4.9.2
module load FastQC/0.11.9-Java-11
module load MultiQC/1.9-intel-2020a-Python-3.8.2
4. Run FASTQC for quality control of raw read files
Information on interpretting fastQC results here.
Create a report of all FastQC using MultiQC.
Create a new directory for the fastqc results.
mkdir fastqc_results
cd fastqc_results
Move raw data files into a directory for ease of navigating the directory.
cd ..
mkdir raw_data
Move all .gz files into the new raw_data directory.
mv /data/putnamlab/ashuffmyer/AH_MCAP_ITS2/*.gz /data/putnamlab/ashuffmyer/AH_MCAP_ITS2/raw_data
Make a folder for scripts.
mkdir scripts
Write a script to run the fastqc.
cd scripts
nano fastqc.sh
This script will run on the putnamlab node with updates sent via email. Note the directories - this script lives in scripts and directories are reflected from this location.
#!/bin/bash
#SBATCH -t 24:00:00
#SBATCH --nodes=1 --ntasks-per-node=1
#SBATCH --export=NONE
#SBATCH --mem=100GB
#SBATCH --mail-type=BEGIN,END,FAIL #email you when job starts, stops and/or fails
#SBATCH --mail-user=ashuffmyer@uri.edu #your email to send notifications
#SBATCH --account=putnamlab
#SBATCH --error="fastqc_script_error" #if your job fails, the error report will be put in this file
#SBATCH --output="fastqc_output_script" #once your job is completed, any final job report comments will be put in this file

source /usr/share/Modules/init/sh # load the module function

module load FastQC/0.11.9-Java-11
module load MultiQC/1.9-intel-2020a-Python-3.8.2

for file in ../raw_data/*fastq.gz
do
fastqc $file --outdir ../fastqc_results
done

multiqc --interactive ../fastqc_results

mv multiqc_report.html ../fastqc_results/ITS2_raw_qc_multiqc_report_AH.html #renames file
Run the script.
sbatch fastqc.sh
Job will submit. Check the status of a job by typing squeue -u ashuffmyer. This will show the status of all jobs by you as a user. For 78 files, this took about 8-10 minutes.
If you need to troubleshoot with analyzing single files, use interactive and exit to quit interactive mode.
To view script errors use nano script_error.
Check that all files were processed.
cd ../raw_data
ls -1 | wc -l
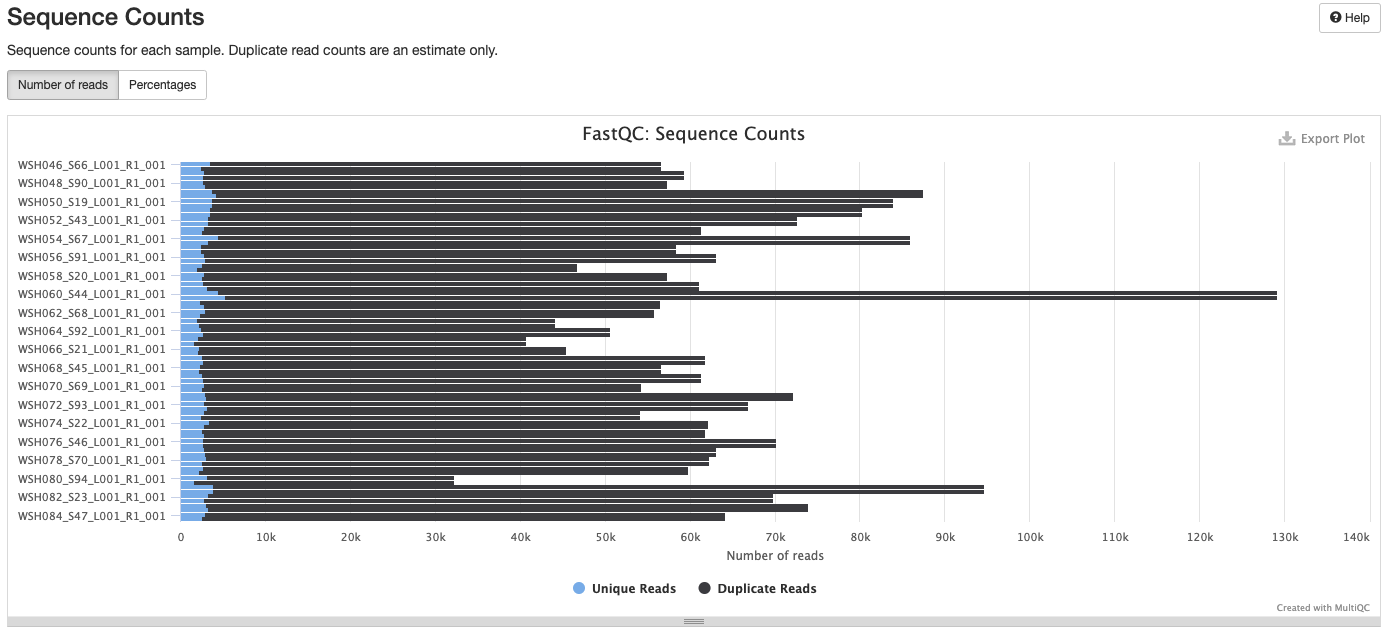
This is the number of raw files that we have. There are 78 files for this project (39 samples).
cd ../fastqc_results
ls -1 | wc -l
This should be 78 x 2 = 156 (zip and html file for each raw data file). This was correct.
5. MultiQC report: Visualizing FastQC
Copy the report to home desktop. Open a terminal session outside of Andromeda and use login credentials when prompted.
scp ashuffmyer@bluewaves.uri.edu:/data/putnamlab/ashuffmyer/AH_MCAP_ITS2/fastqc_results/ITS2_raw_qc_multiqc_report_AH.html ~/MyProjects/EarlyLifeHistory_Energetics/Mcap2020/Data/ITS2
Initial MultiQC report ran on 20211228 shows several areas that we need to address. MultiQC report including:
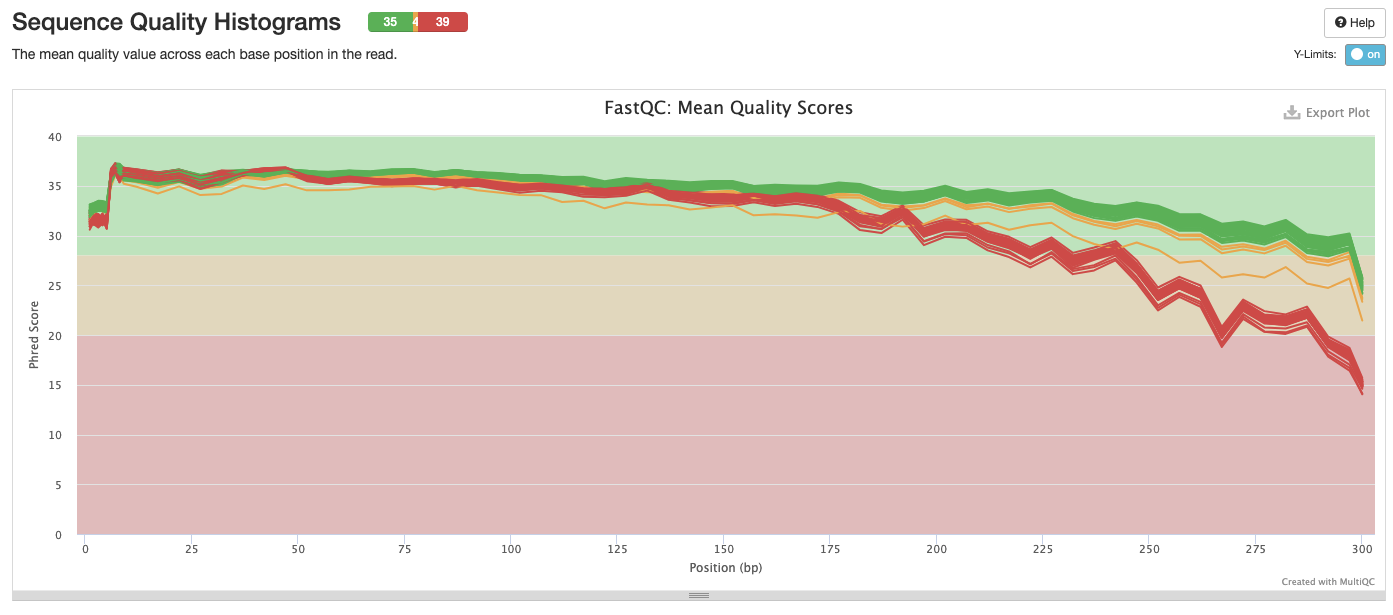
Interpretation: Reduction in quality at the end of the sequence. The sequences that fail are all the reverse R2.
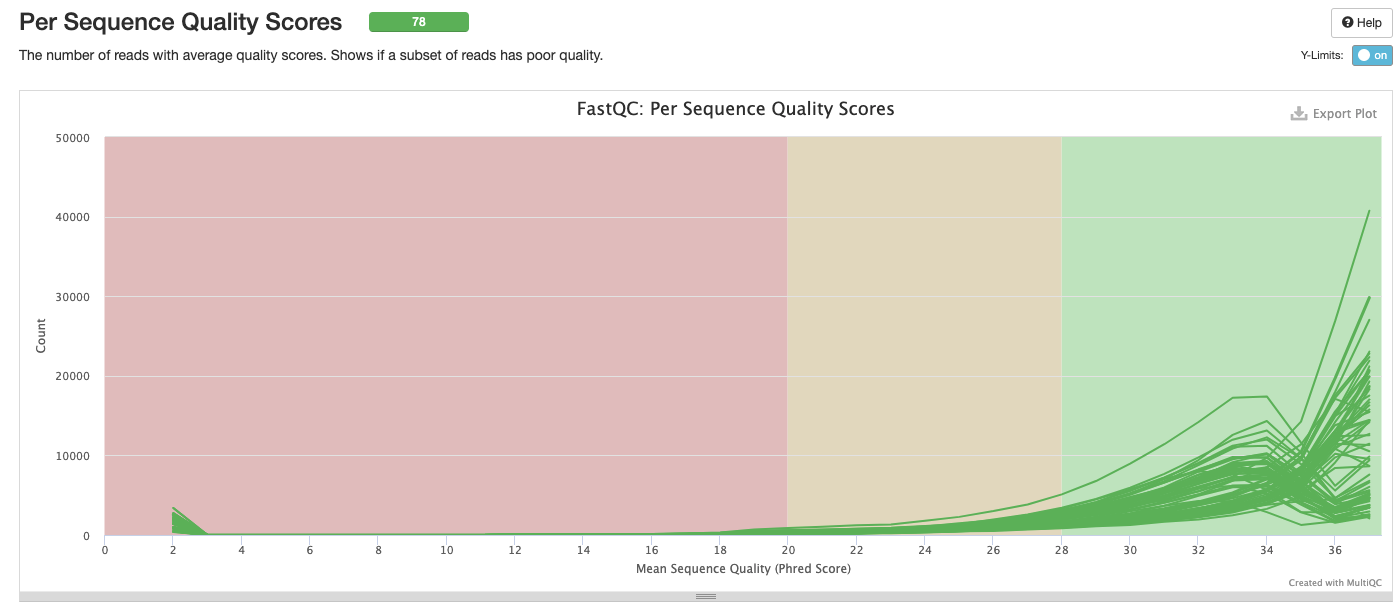
Interpretation: All sequences pass.
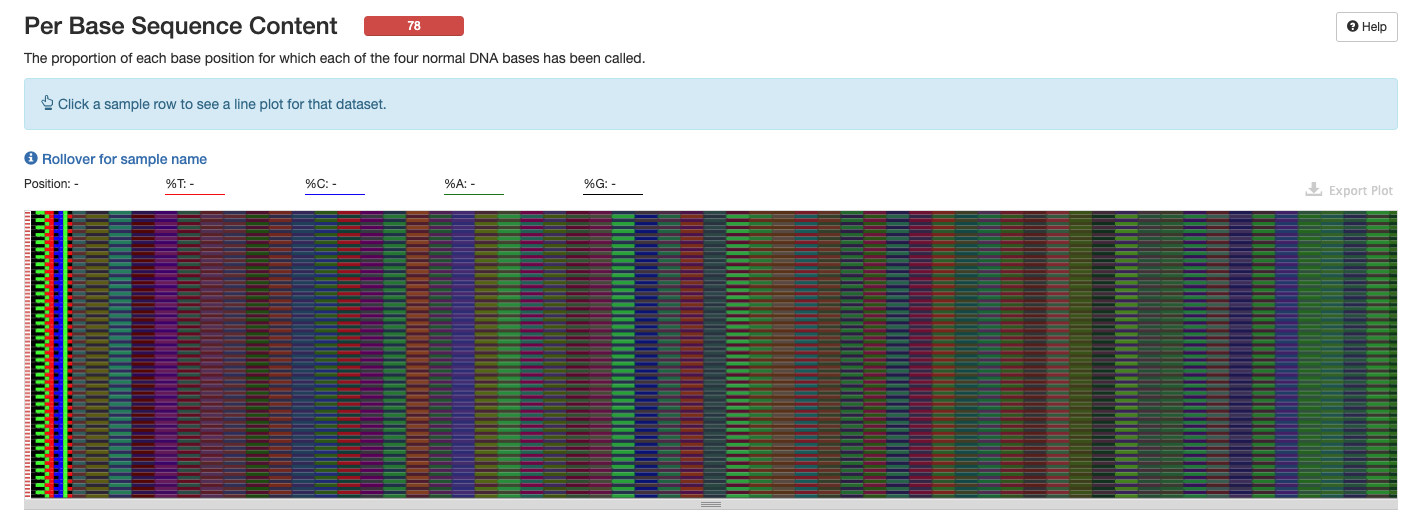
Interpretation: Amplicon libraries are expected to have bias and may not have a normal distribution. Issues at the start of eqch sequence as seen here would be expected for ITS2 data and we could resolve with trimming.
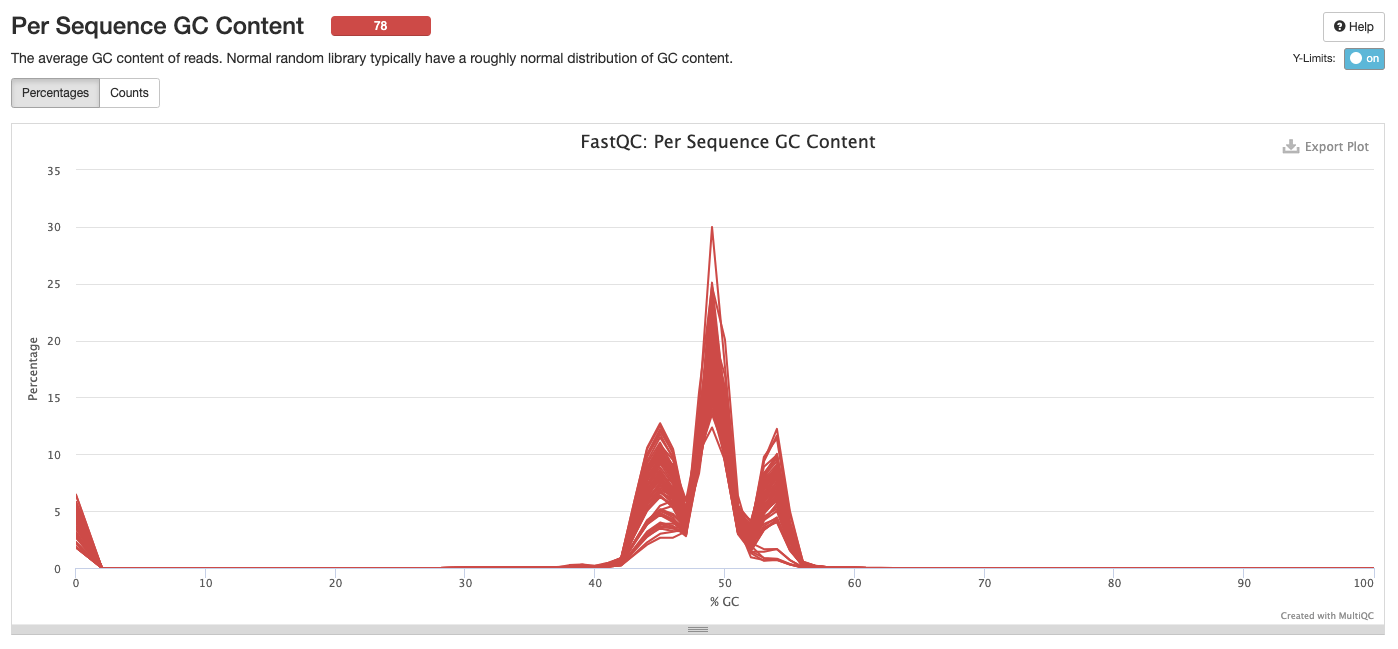
Interpretation: Peak at beginning may be resolved with trimming/cleaning. We have a triple peak here at 45%, 55% and 65% GC. Could be due to contamination, adapters, or over represented sequences. Look into what should be expected from ITS2 amplicon sequencing.
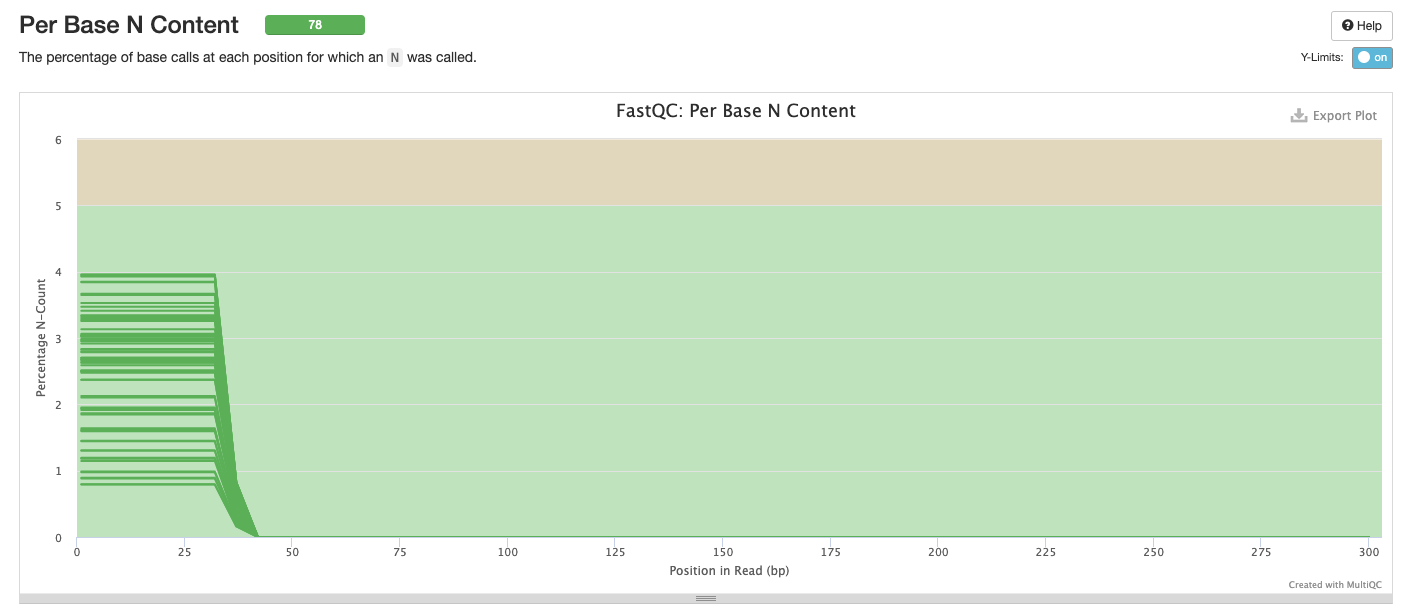
Interpretation: We can remove the problems at the start of the sequences. Low N content is as expected.
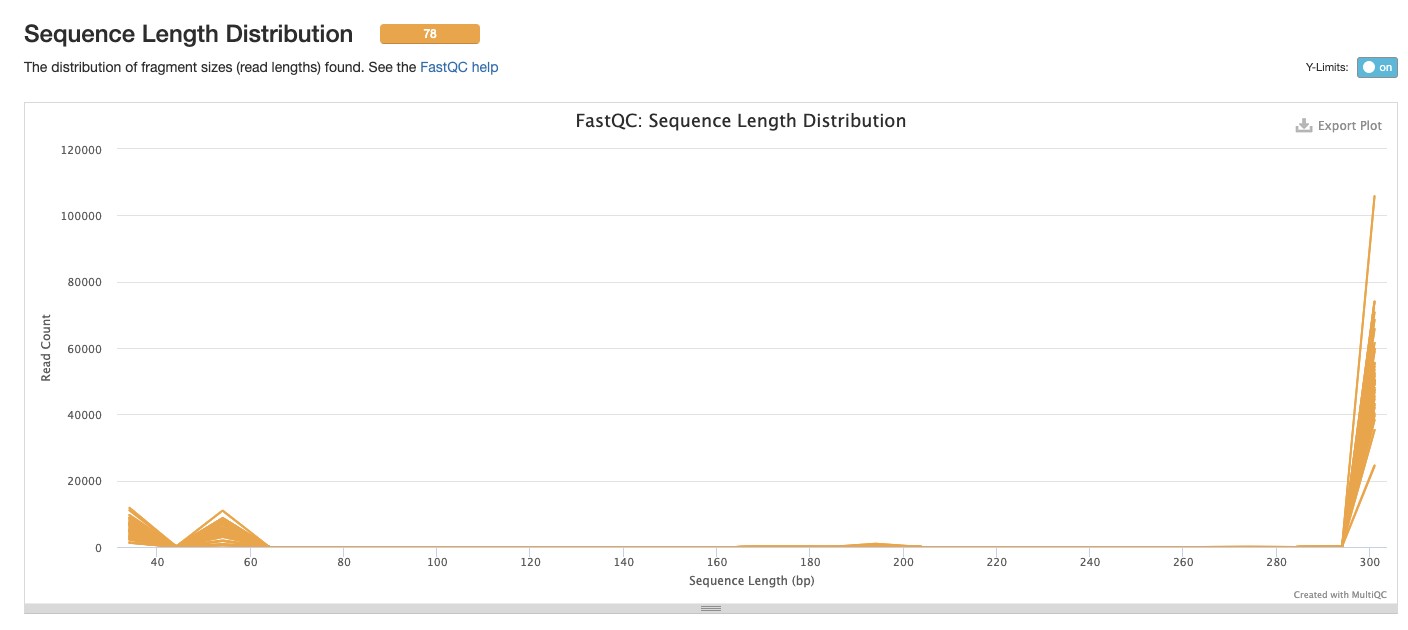
Interpretation: There is a primary peak at ~300bp, the small peak at the start of the sequences could be removed with trimming.
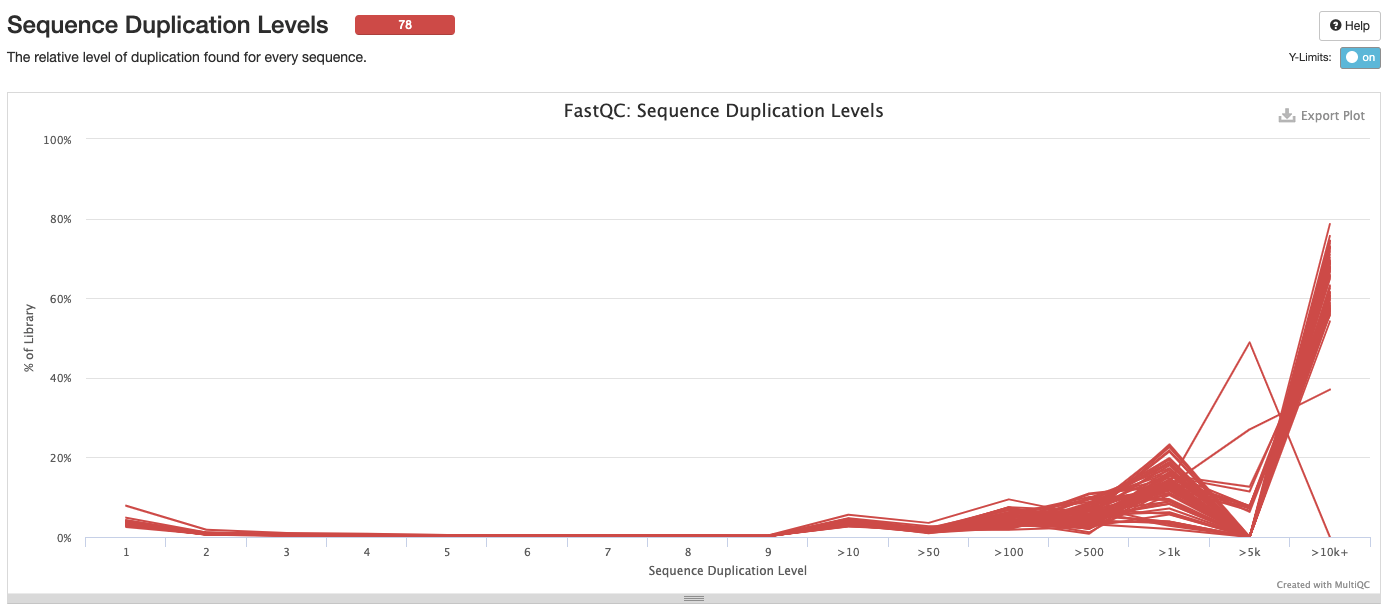
Interpretation: High level of duplication may indicate an enrichment bias in the PCR. This could mis represent the true abundance of sequences. There may also be truly over represented sequences that might be expected for amplicon data.
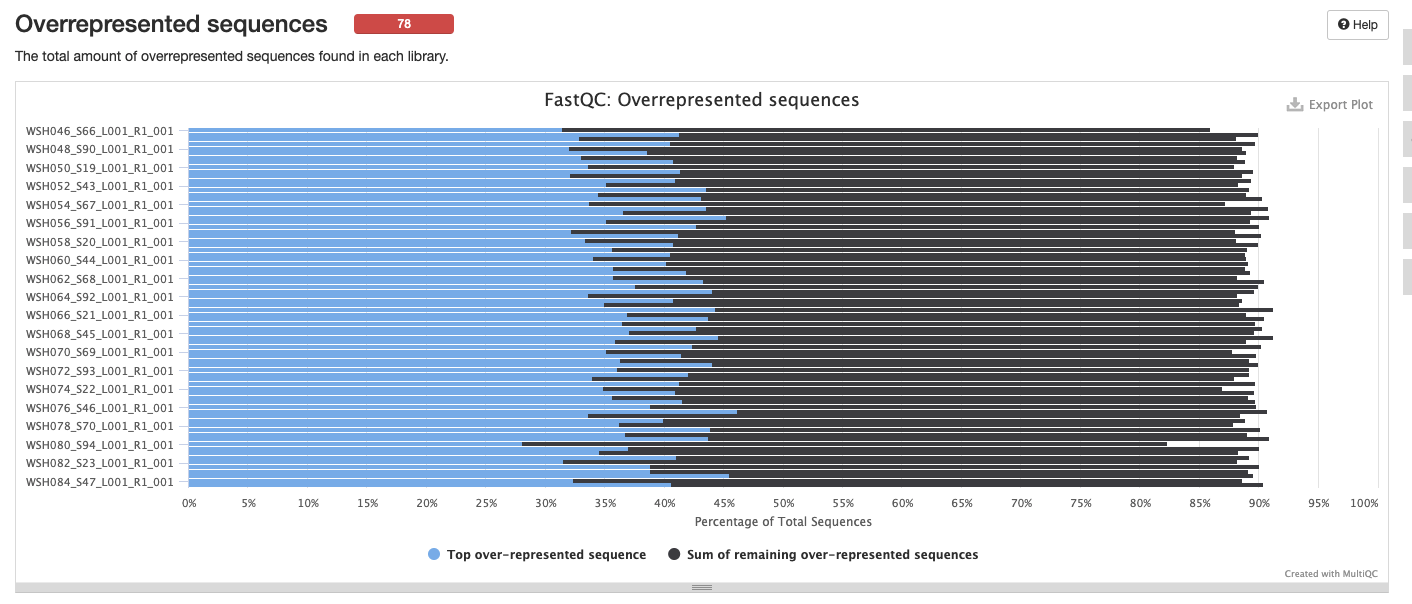
Interpretation: There are many over represnted sequences. We could blast these sequences to determine what they represent. We can also revisit this after removing adapters and other QC steps.
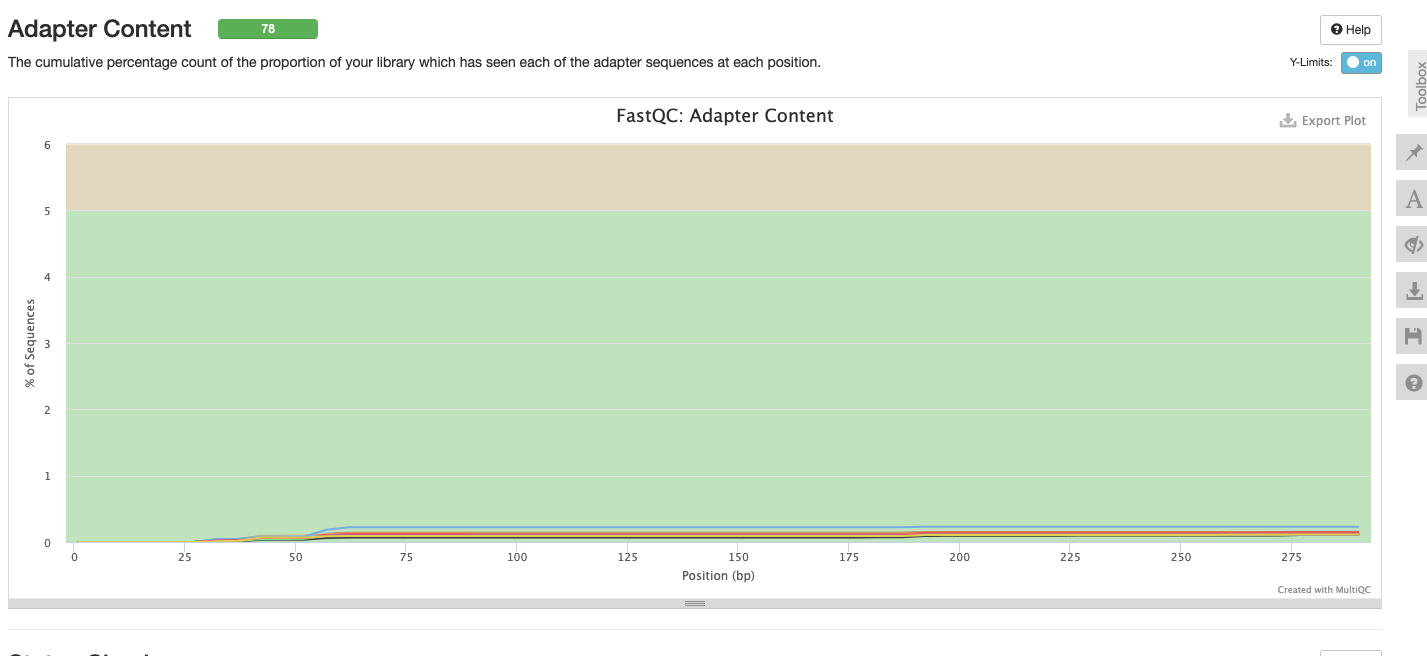
Interpretation: No adapter content.
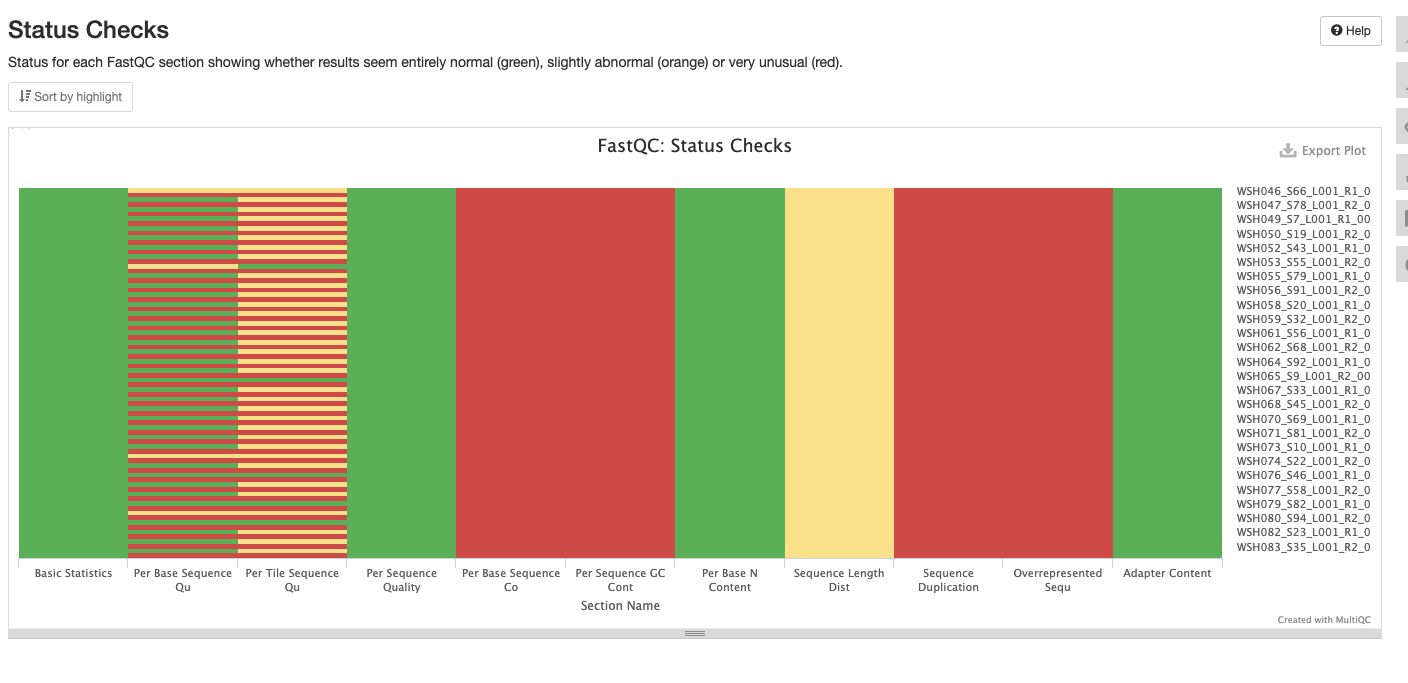
Interpretation: Shows failures and warnings as described above.