


Metabolomics WGCNA Analysis Part 1
This posts describes weighted gene co-expression analysis (WGCNA) applied to metabolmoics data from the 2020 Montipora capitata early life history developmental time series.
Overview
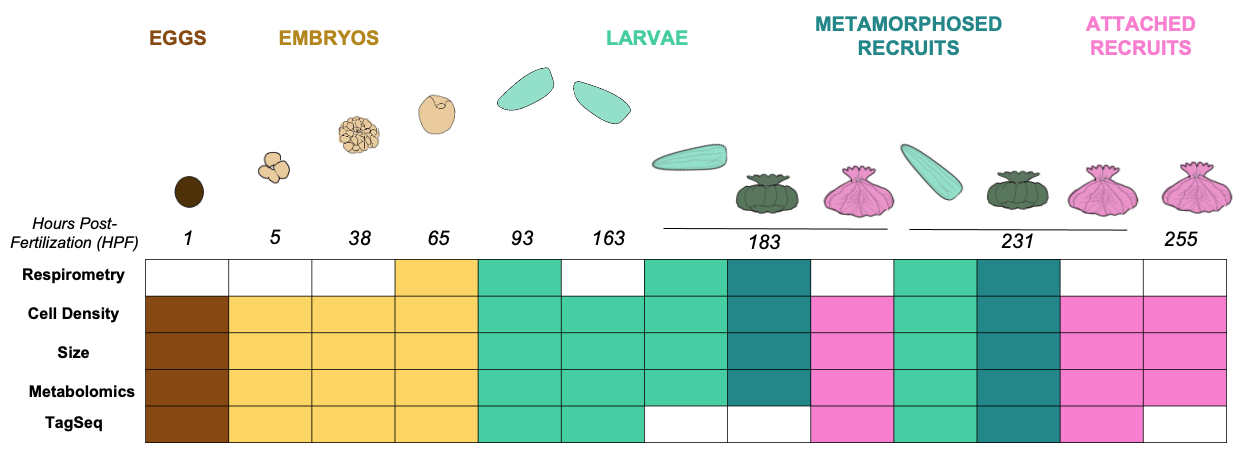
In this study, we collected gene expression (TagSeq), metabolomics, and physiology data (see figure above) to characterize gene expression across developmental stages, including eggs, embryos, larvae, recruits, and attached recruits.
All scripts/data/analysis described in this post can be found in my GitHub repo here.
Metabolomics analysis up to this point
We have beeen working through metabolomics data analysis using several pipelines. In general, we use multivariate analysis to look at metabolomic profiles of metabolites detected in our samples (~185 metabolites and 47 samples). We use a supervise Paritial Least Squares discriminate analysis (PLS-DA), because this analysis lets us look at metabolites that drive differences in groups.
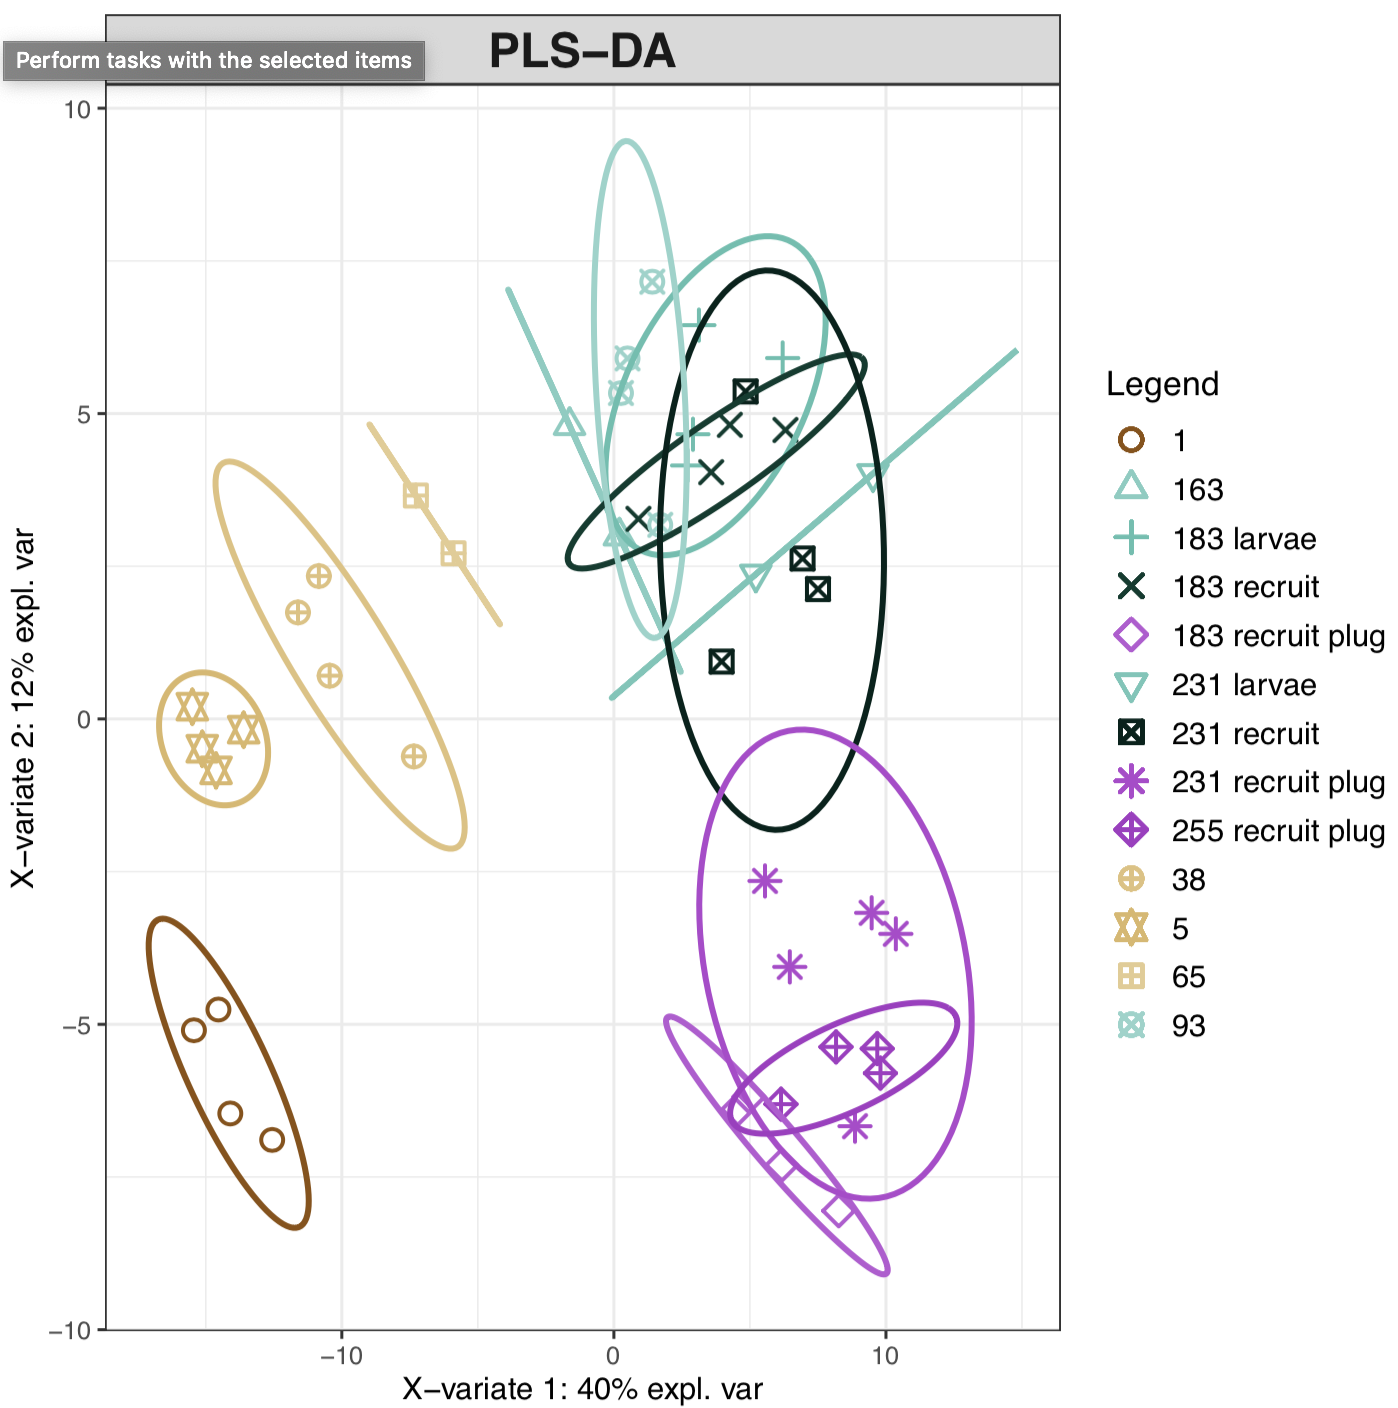
In this plot, we can see that there are distinct metabolic signatures of lifestage. We can further look at these groupings by major developmental stage:
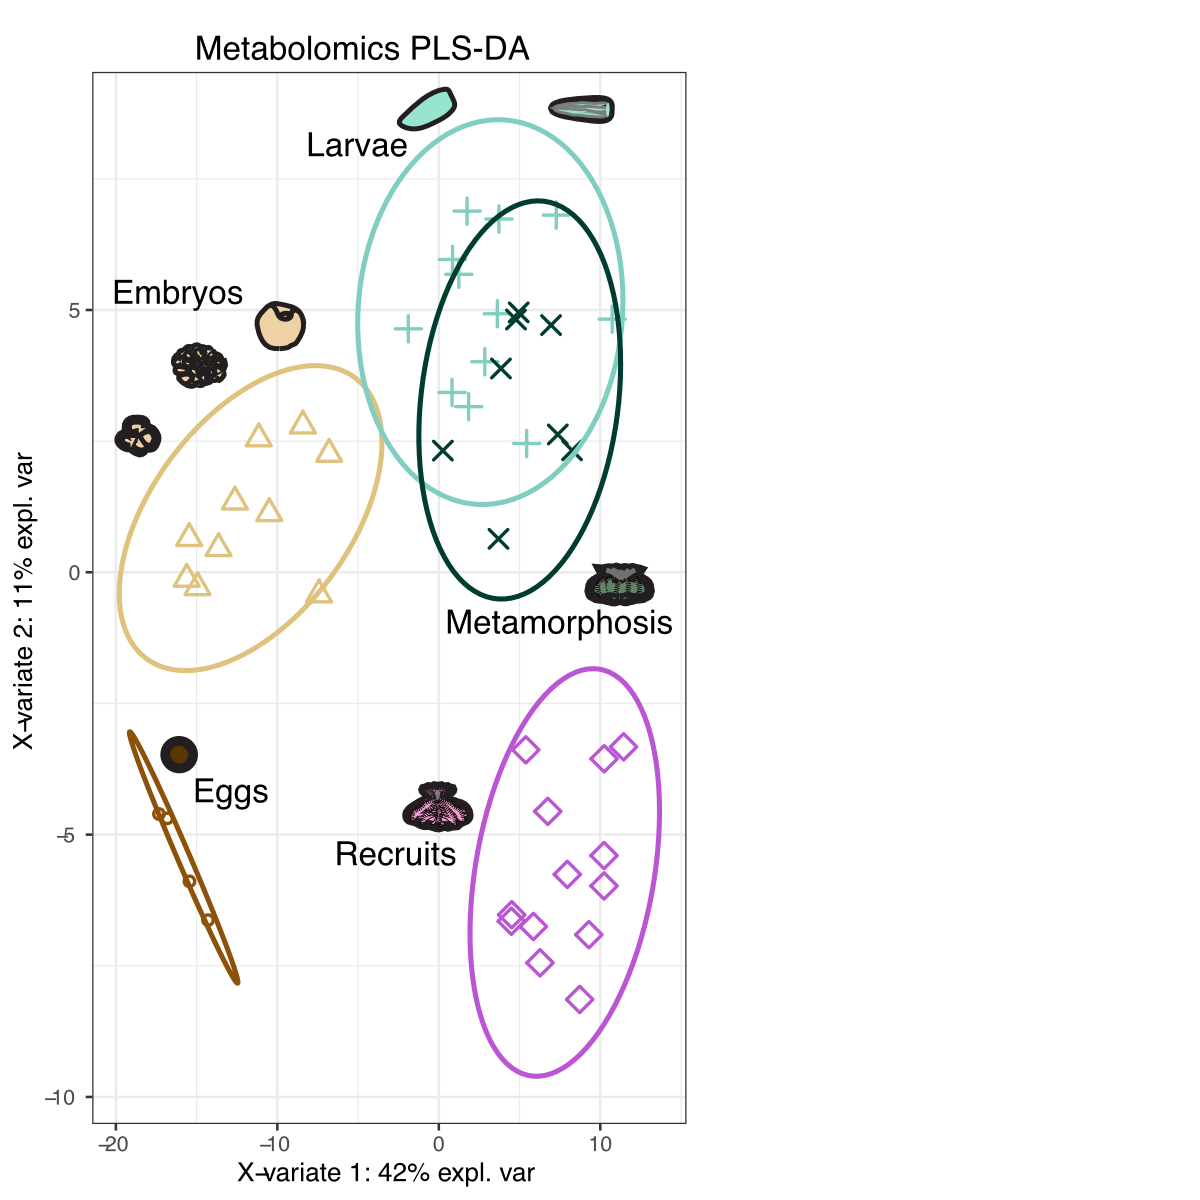
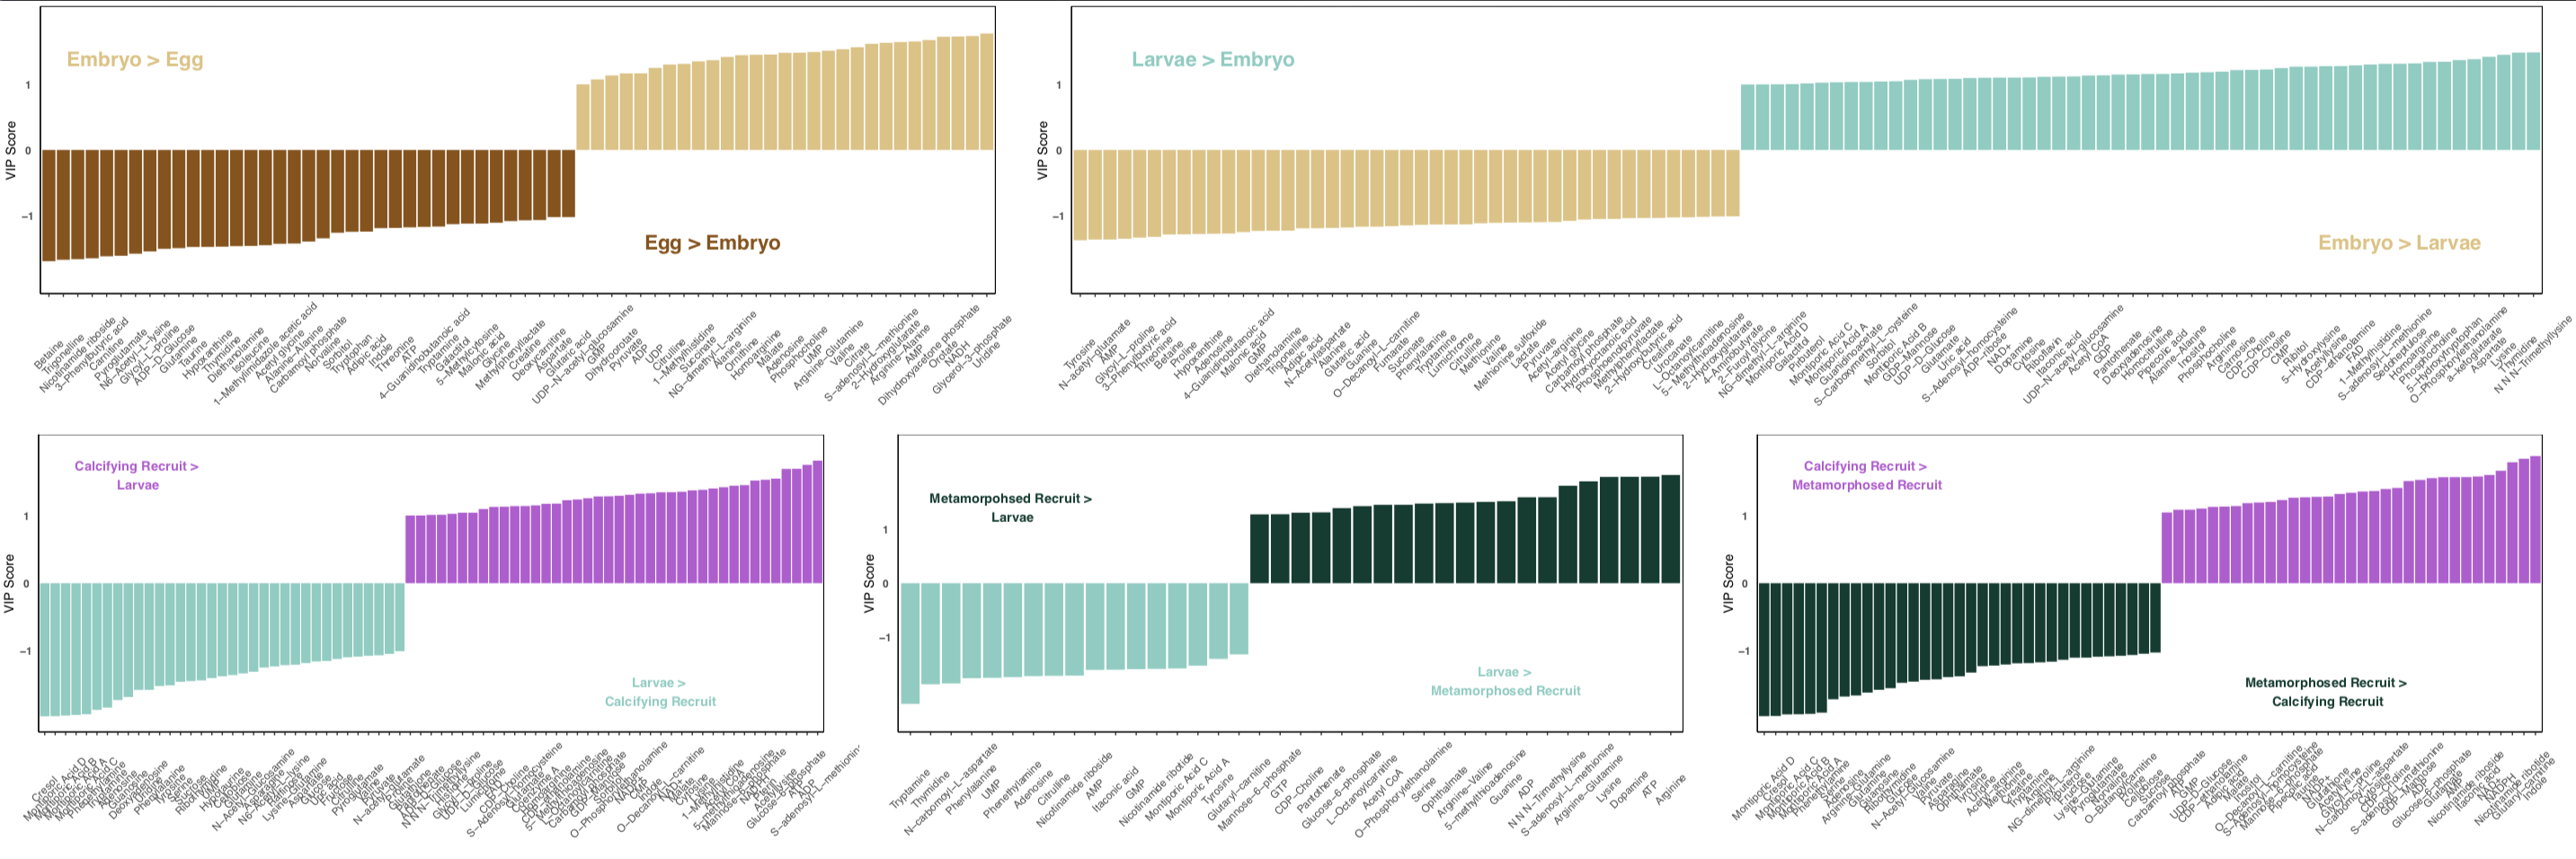
From this analysis, we can see that metabolomic profiles change with development. We can now extract the metabolites driving this separation by extraction Variable Important Components (VIP) scores. VIP > 1 are “important” to the separation of groups and we extract this list and select those that are significant using FDR corrections.
From this, we get a list of metabolites that drive differences in lifestages.
Key point: These VIPs can only be extracted using pairwise comparisons. Here, I did this by comparing stages across development (i.e., eggs to embryos, embryos to larvae, and so on).
This is great if you have a study design in which you are comparing a group to a control. But, in this study I am interested in how metabolite profiles shift by lifestage (accomplished with the PLSDA analysis above) AND what metabolites/metabolic pathways are enriched in each life stage.
So, we need an analysis that uses a global approach to enrichment to let us look at what is enriched in each lifestage compared to the other lifestages. For this, lets borrow from the world of ‘omics.
WGCNA: Gene expression
We used WGCNA analysis to characterize gene expression shifts in TagSeq data from this study. We found several modules (i.e., groups of genes with similar expression patterns) that were associated with life stages.
There are gene modules that we found that are associated with major developmental stages - super cool! Since this really gets at the approach I wanted for metabolomics data, I tried running a WGCNA on the metabolite data.
To run a WGCNA, all you need is a count matrix of genes or some other type of data for each sample - and we have that for metabolites!
WGCNA: Metabolomics
After some data wrangling and formatting, we have a count matrix with metabolites in columns and samples in rows. Metabolites in this data set are median-normalized to account for any differences in biomass across samples. This creates a “count” that is a ratio of accumulation relative to the median ion count.
One of the early steps in the process is to determine the soft power, which is “the value used to power the correlation of the genes (or metabolites in this case) to that threshold. The assumption on that by raising the correlation to a power will reduce the noise of the correlations in the adjacency matrix.”
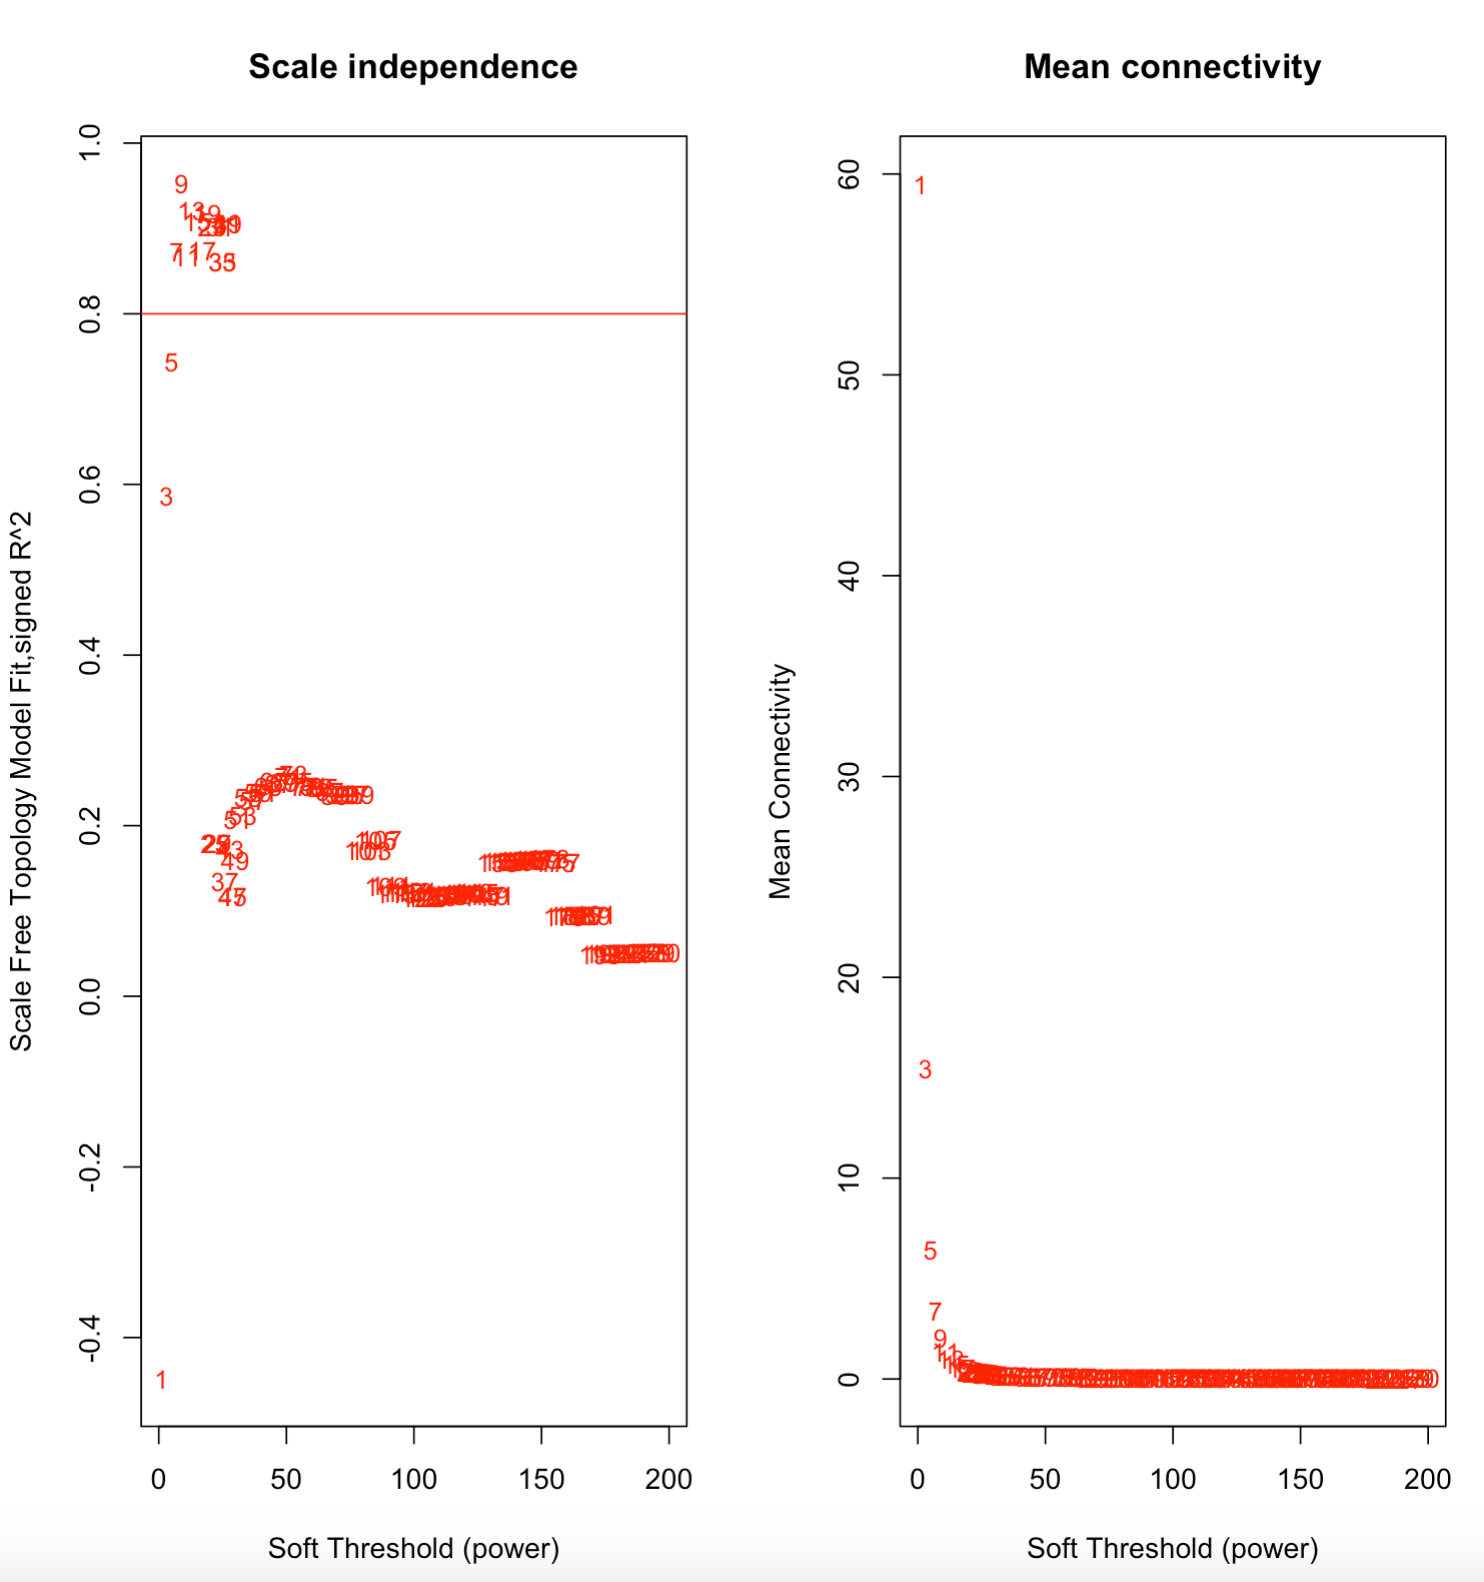
Here, we see that the soft power is 7, the value reached after the model crosses the 0.8 threshold.
Next, we construct the module network. Here, metabolites are represented in the cluster dendrogram. Metabolites with similar expression patterns are grouped together in modules (set as a minimum size of 5 for each module), indicated by color underneath the dendrogram. Similar (>85% similarity) modules are merged together.
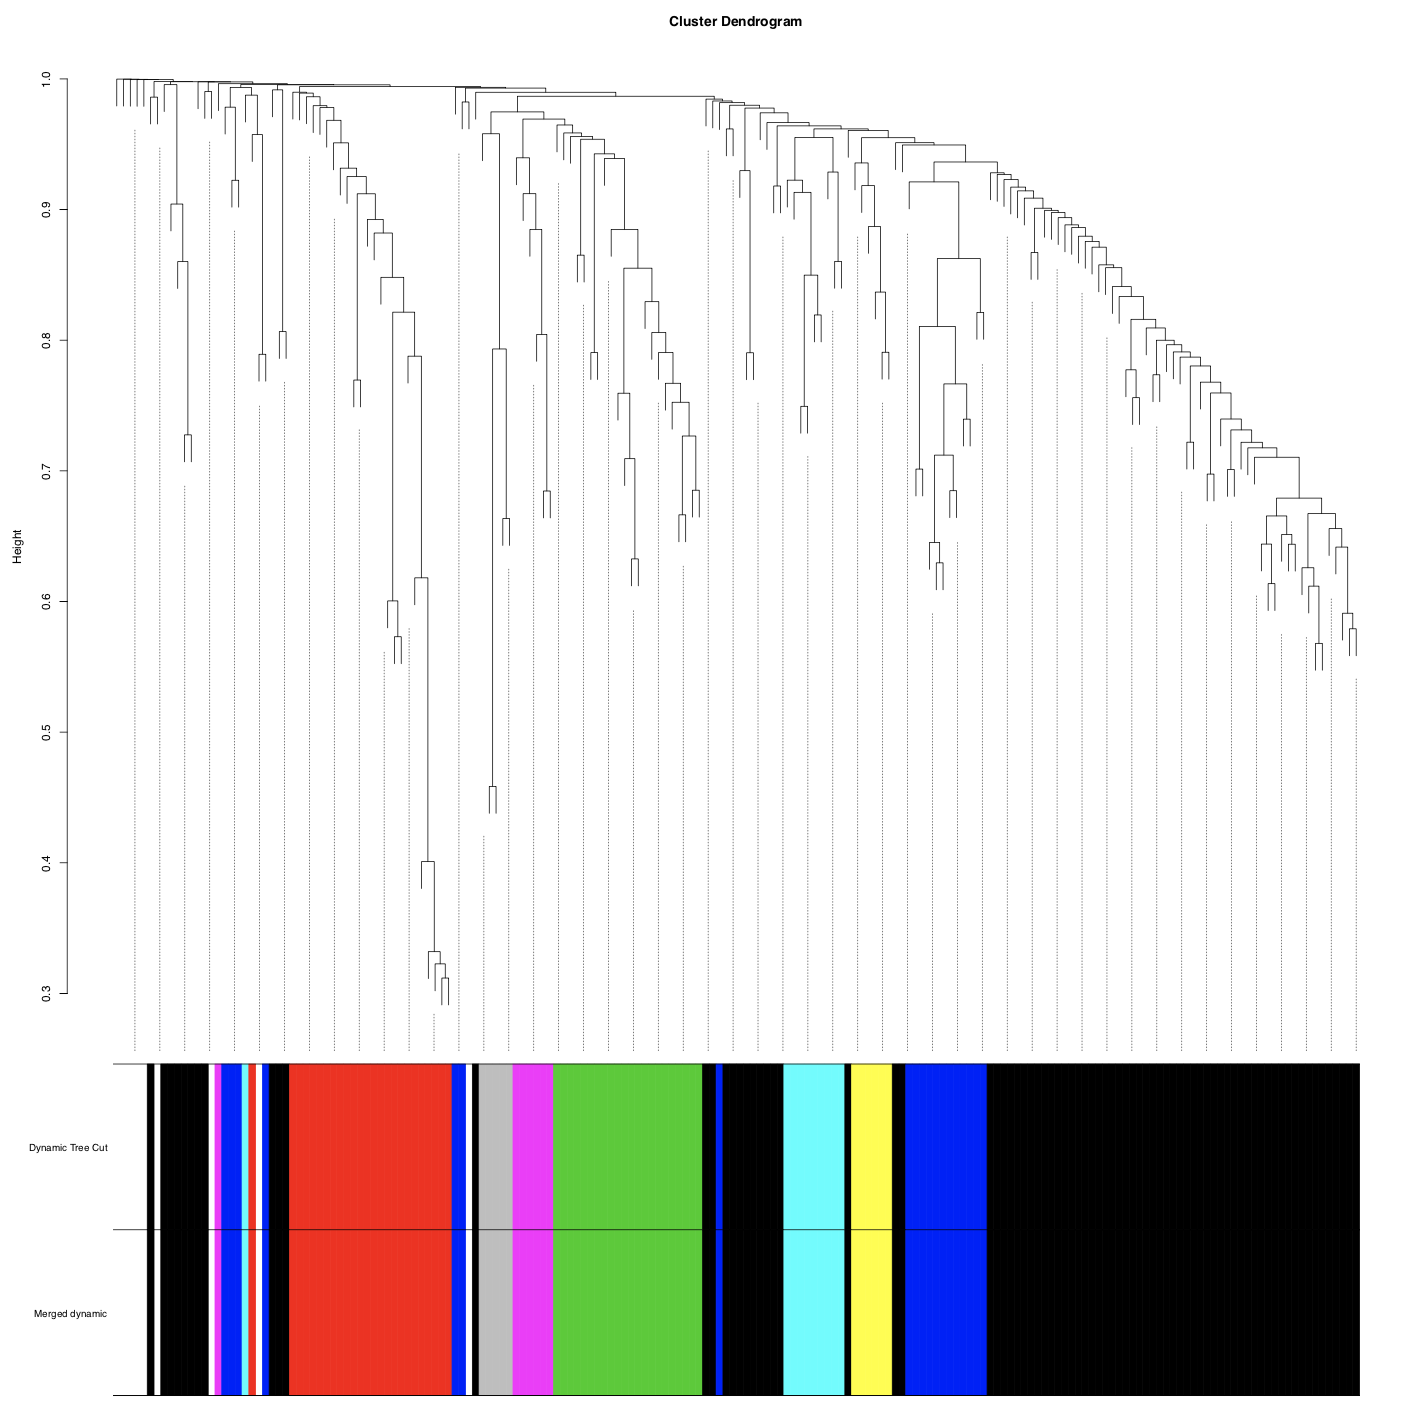
In this case, modules are <85% similar and no merging occurs.
We then correlate the modules to lifestages. In this case, lifestages are represented as binary values (0 for samples that are not in respective lifestage, 1 for samples that are). This allows for a correlation between the module and the lifestage, since this is not possible to do with categories.
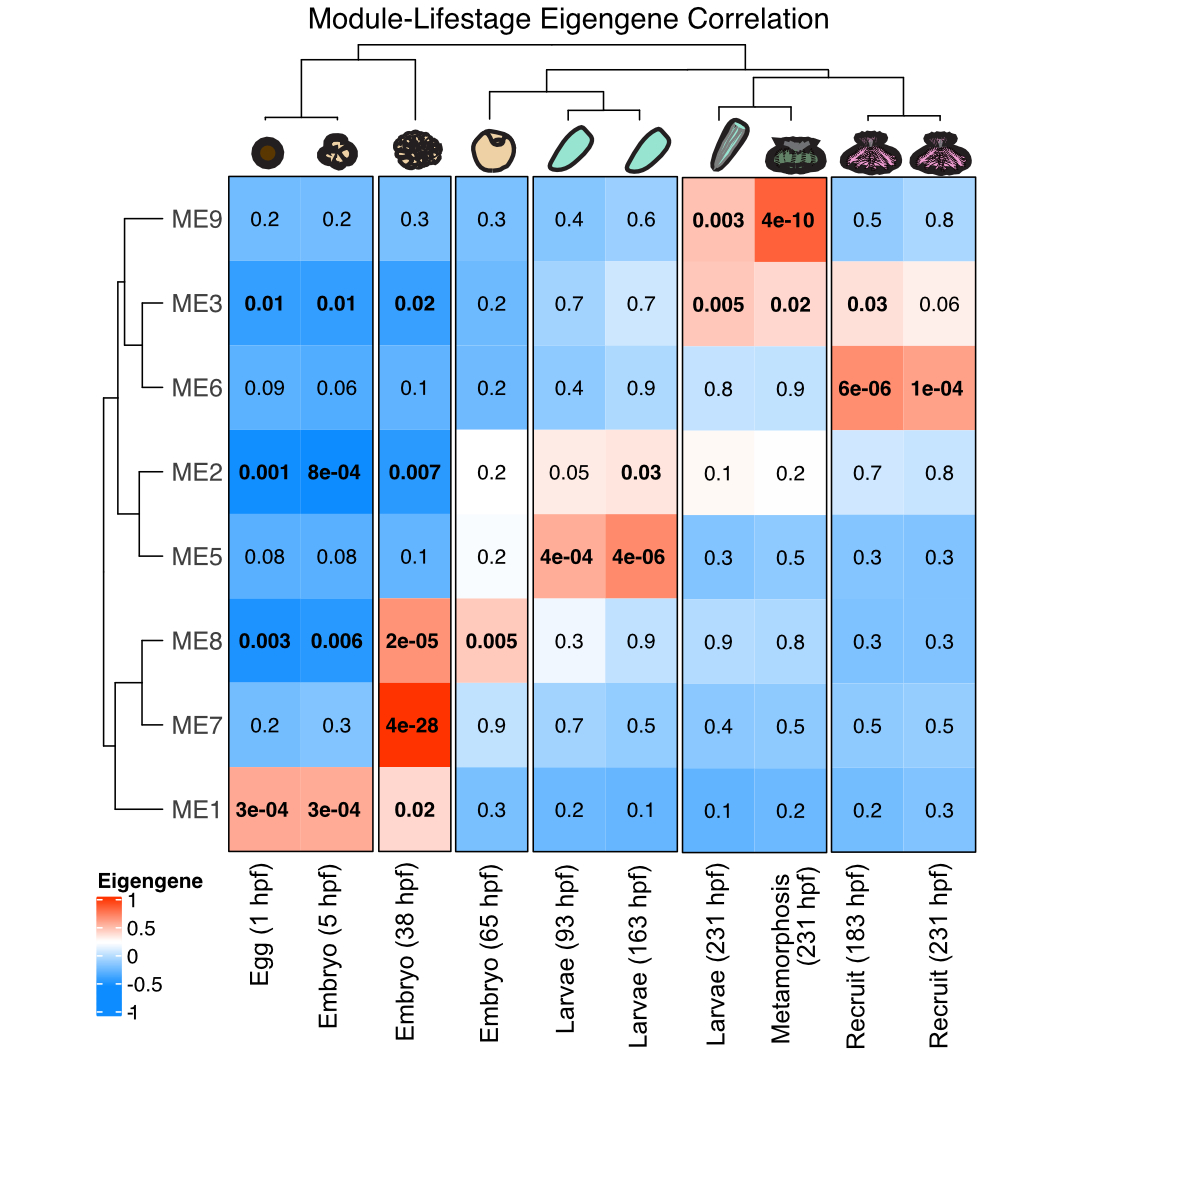
We then generate a heatmap that shows the module eigengene correlations.
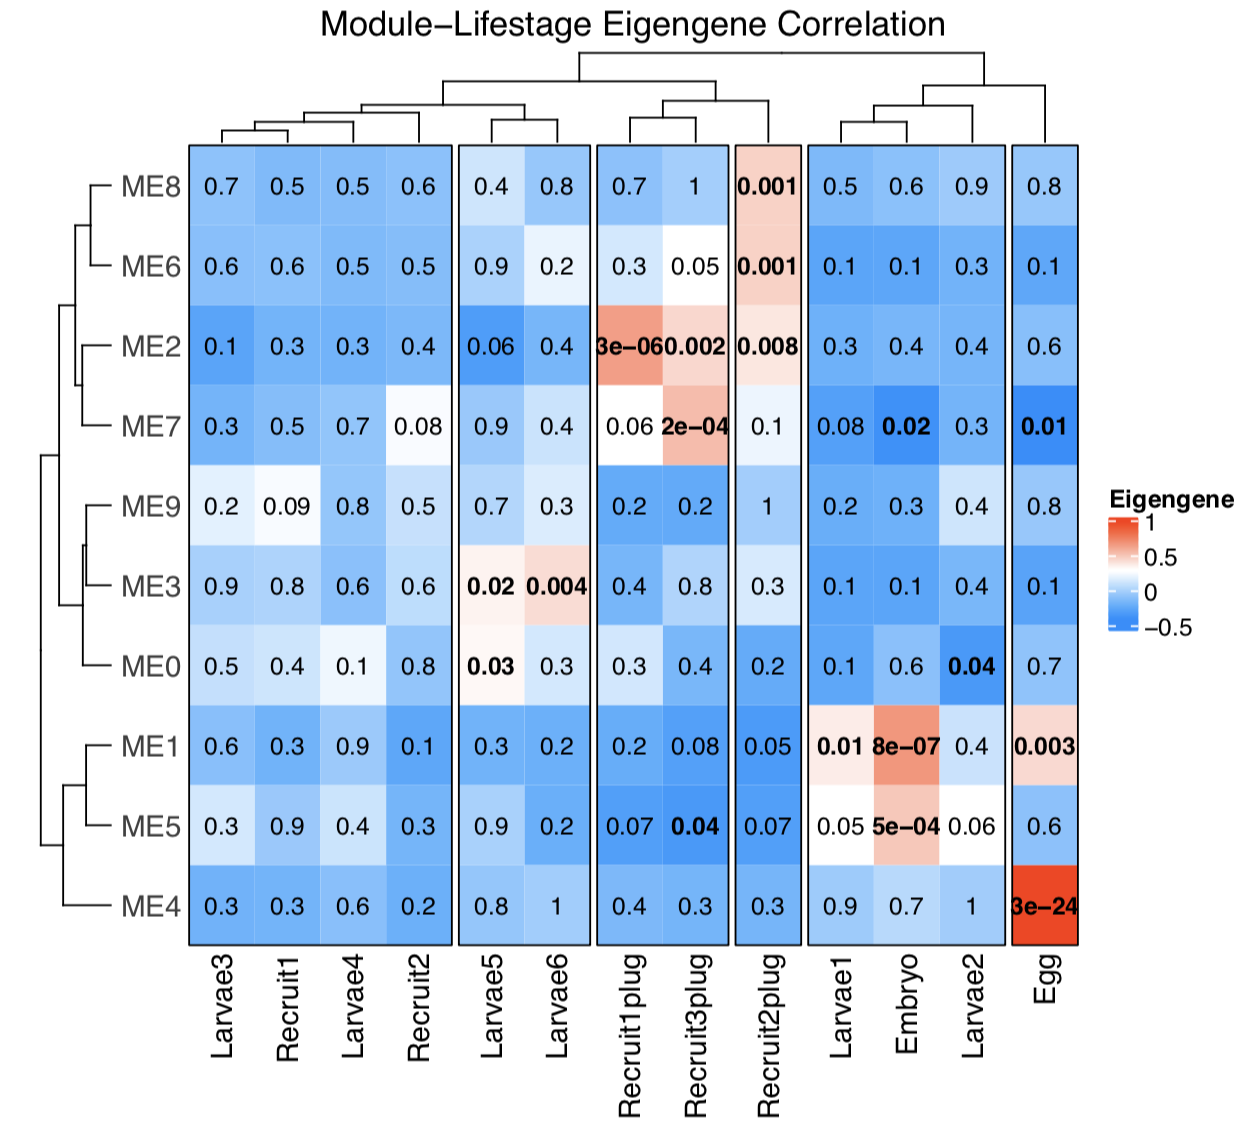
Here are a few things we learn from this WGCNA plot:
-
Bold, red squares indicate modules of metabolites that are positively (accumulated) significantly correlated with that lifestage. For example, module 4 is associated with eggs.
-
Bold, blue squares indicate modules of metabolites that are negatively (depleted) significantly correlated with that lifestage. For example, module 7 is depleted in eggs and embryos.
-
There are distinct module groups associated with eggs, embryos, early larvae, and attached recruits. This makes sense because the profiles of metabolites in the PLSDA shows clear separation in these groups. So good news, our analyses are telling similar stories!
-
Interestingly, but not that surprising, is that no modules are associated with larvae/recruits. This may be due to the similar profiles of these groups that we saw in the PLSDA. This might mean that of course metabolites are detected in these groups, but they are not significantly depleted or accumulated compared to other stages. This is something to explore further.
Next steps
The next step will be to extract the metabolites in these modules and use Metaboanalyst to perform pathway analyses. This may tell us more about the biochemical pathways associated with these stages. For example, what is happening in eggs and attached recruits?
Outstanding questions and things to address
There is still a lot of optimization that needs to be done for this analysis.
- Why are no modules associated with larvae/recruits?
- How does the WGNCA answer differ from the VIP extration of metabolites?
- What other studies have used WGCNA for metabolomics and how do our results compare?
This approach does get us closer to a global enrichment that doesn’t rely on pairwise comparisons.