


E5 Environmental Timeseries Analysis Part 2
This post continues analysis of environmental time series data for the E5 Rules of Life Project.
See Part 1 in this notebook post.
Overview
From the last post, we have a QC’d dataframe of environmental data across 3 sites and 4 timepoint periods in Moorea for the E5 Rules of Life project. This post details plotting and statistical analysis of this data.
All code and data are in the E5 Git Repo in the integration_environmental.Rmd script.
Generating a Radar Plot
To view multivariate environmental data, I produced a radar plot. First, I calcuated several environmental variables from our time series of temperature, pH, and light. Note in this data I am using the temperature obtained from temp/pH probes (not the Hobo loggers), since these data are paired to pH measurements.
First, I summarized data by day. All variables are then reflective of 24 h periods.
The variables calculated include daily mean, daily min, daily max, daily range, and daily variability (standard deviation).
This was done using the handy summarise(across()) function in tidyverse.
I generated a radar plot using the ggRadar function from the ggiraphExtra package. There are several other packages that can produce radar plots, including ggradar and ggradar2, but ggRadar worked best for me.
The plot looks like this:
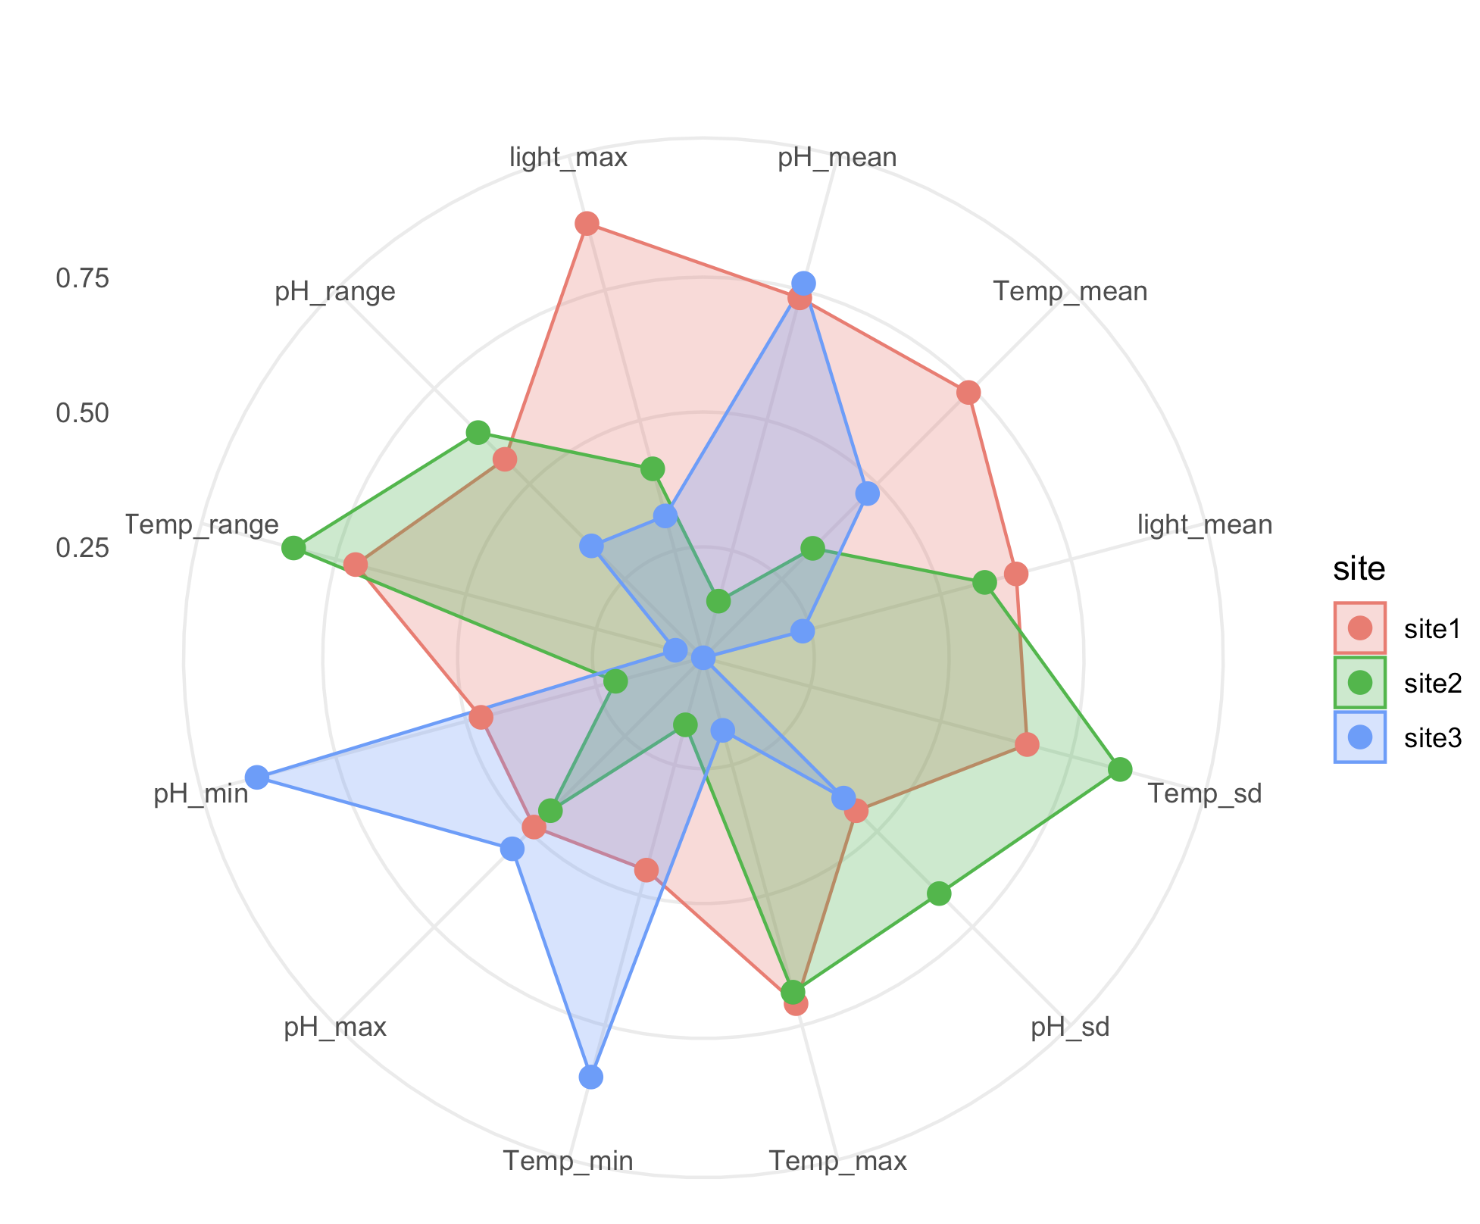
From this plot we see that sites appear to have different environmental conditions.
Statistical analysis
Next, I conducted a one-way anova for each environmental variable in the plot above by site. The following variables were significant (p<0.05).
- Temperature daily variability (stdev)
- Max daily temperature
- Daily temperature range
- Mean daily light
- Max daily light
- Mean daily pH
- Daily pH variability (stdev)
- Max daily pH
- Min daily pH
- pH daily range
Next steps
Continue to address QC issues from Part 1 and decide on our approach for plot and statistical tests for publication.
Because of the mismatch in the data (collected during limited phases in the example of light, or missing site data for pH/temp), this reduces our sample size. We can try to fill in some of the gaps to increase our observations.
Currently, we have data from all responses across 68 days.