


Mcap 2021 Stable Isotope Metabolomics Analysis
This post details the initial stable isotope metabolomics analysis for the Montipora capitata 2021 larval temperature exposure.
Overview
In this project, I exposed M. capitata larvae to high (+ ~2°C) and ambient temperatures in Hawai’i in 2021. At the end of this exposure, I incubated larvae at the treatment temperature with isotope labels and collected samples for stable isotope metabolomics.
During incubations we labeled samples (n=1 per tank, n=6 per temperature) with carbon-13, carbon-12 (isotope control), and dark carbon-13 (photosynthesis control). Metabolomic analyses were conducted at Rutgers University Shared Metabolomics Resource by Eric Chiles and Xiaoyang Su. Metabolites were analyzed under negative polarity to capture central metabolism pathways.
For more details on this project, see my notebook posts for the Mcap2021 project.
The GitHub repo for this project is here.
The script for analysis today can be found here on GitHub.
Data types
There are three types of isotope metabolomics data I am analyzing for this project.
- Pool size: The amount of a metabolite in a sample relative to the total pool. Measured as peak intensity and normalized to the sample median intensity to account for any variation in biomass between samples. I use log transformed median-normalized intensity values for pool size in this analysis.
- Enrichment: The likelihood of a particular carbon position in a metabolite to either be labeled or not labeled. Expressed as a percentage/proportion.
- Labeling: The proportion of metabolite pool that has a label at a particular location. In this analysis we use this data to calculate the proportion of each metabolite that has at least 1 labeled carbon in the molecule. Expressed as a proportion/percentage of labeled and unlabeled metabolites.
I analyzed each of these data types and show the results below.
I am going to address the following questions in this analysis:
- Is metabolite pool size different between isotope treatments?
- Is metabolite pool size different between temperature treatments?
- Is metabolite atom enrichment different between dark and light treatments?
- Is metabolite atom enrichment different between temperature treatments?
- Is metabolite labeling proportion different between dark and light treatments?
- Is metabolite labeling proportion different between temperature treatments?
- Does the location of carbon labeling differ for metabolites between treatments?
- How does temperature treatment affect metabolite pool size and enrichment/labeling and what does this tell us about metabolic pathways?
1. Is metabolite pool size different between isotope treatments?
First, I investigated the data across isotope treatments to confirm the reliability and validity of our data. We incubated larvae either with 13C bicarbonate, 12C bicarbonate (chemistry control), and 13C bicarbonate in the dark (biological control).
Normalization
First, I normalized ion intensity values to the sample median to account for variation in total larvae in each sample, since larvae were added volumetrically and not individually counted. I then applied a log transformation becuase several metabolites at very high abundance skew the distribution.
There are 90 metabolites detected in our dataset.
PCA analysis
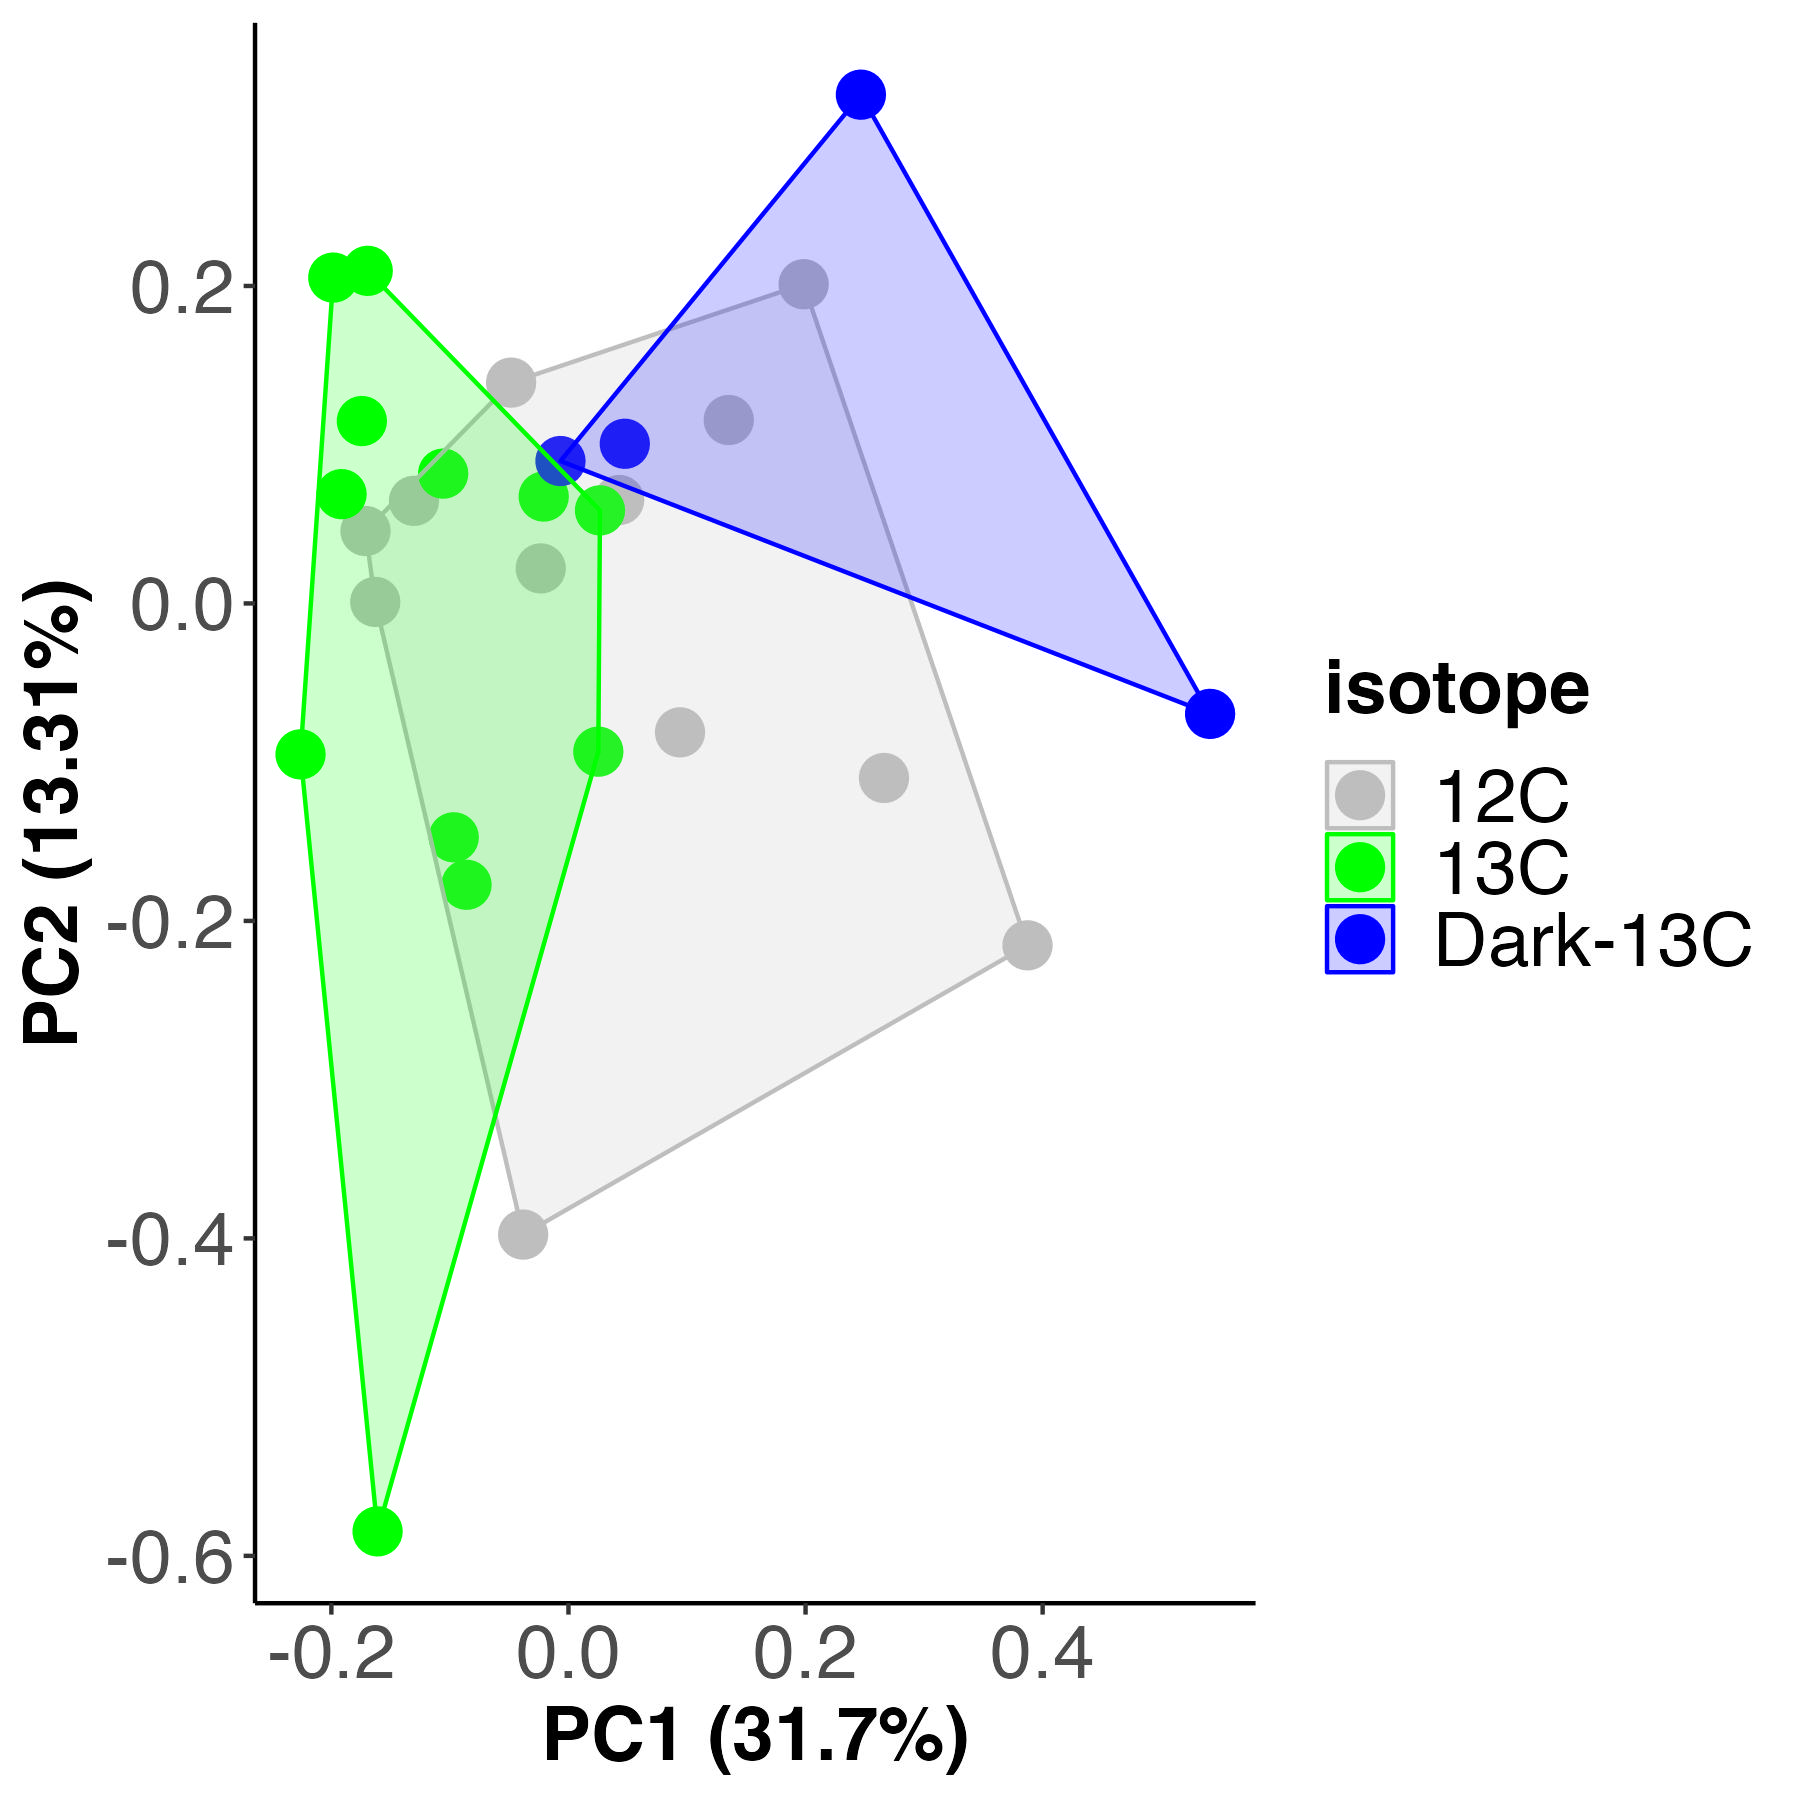
For each analysis, I first completed unsupervised principal components analysis (PCA) to view multivariate metabolomic profiles between treatments and used a PERMANOVA to test for differences between treatments. I generated a PCA plot and PERMANOVA test for metabolomic profiles between isotope treatments.
Permutation test for adonis under reduced model
Terms added sequentially (first to last)
Permutation: free
Number of permutations: 999

adonis2(formula = vegan ~ isotope, data = pool_size_pca, method = "eu")
         Df SumOfSqs      R2      F Pr(>F)
isotope   2   536.48 0.22078 3.5416  0.001 ***
Residual 25  1893.52 0.77922
Total    27  2430.00 1.00000
Metabolomic profiles are different by isotope treatment and account for 22% of the variance (calculated by sum of squares). We expect this due to the metabolic differences in the light C13 vs the dark C13. There is partial overlap between the C13 and the C12 samples, suggesting there may be some differences between the C12 and C13.
We will next look for metabolites that are different between C12 and C13 treatments. We are going to look for metabolites that are highly present in one but not the other or dramatic differences. We expect some variation in the pool size of metabolites that could be due to the type of carbonate added or variation in concentrations, but we need to ensure that major metabolic pathways are not altered by the presence of the label.
To do this, we will conduct a PLS-DA analysis.
PLS-DA analysis
I then used a supervised PLS-DA analysis to analyze differences between isotope treatments and extract metabolites that drive separation. I ran this in two comparisons: C12 vs C13 and C13 vs Dark-C13.
C13 vs C12
I generated a PLS-DA plot and data frames and then extracted the VIP metabolites that differentiate between treatments (VIP = importance of variable in projection).
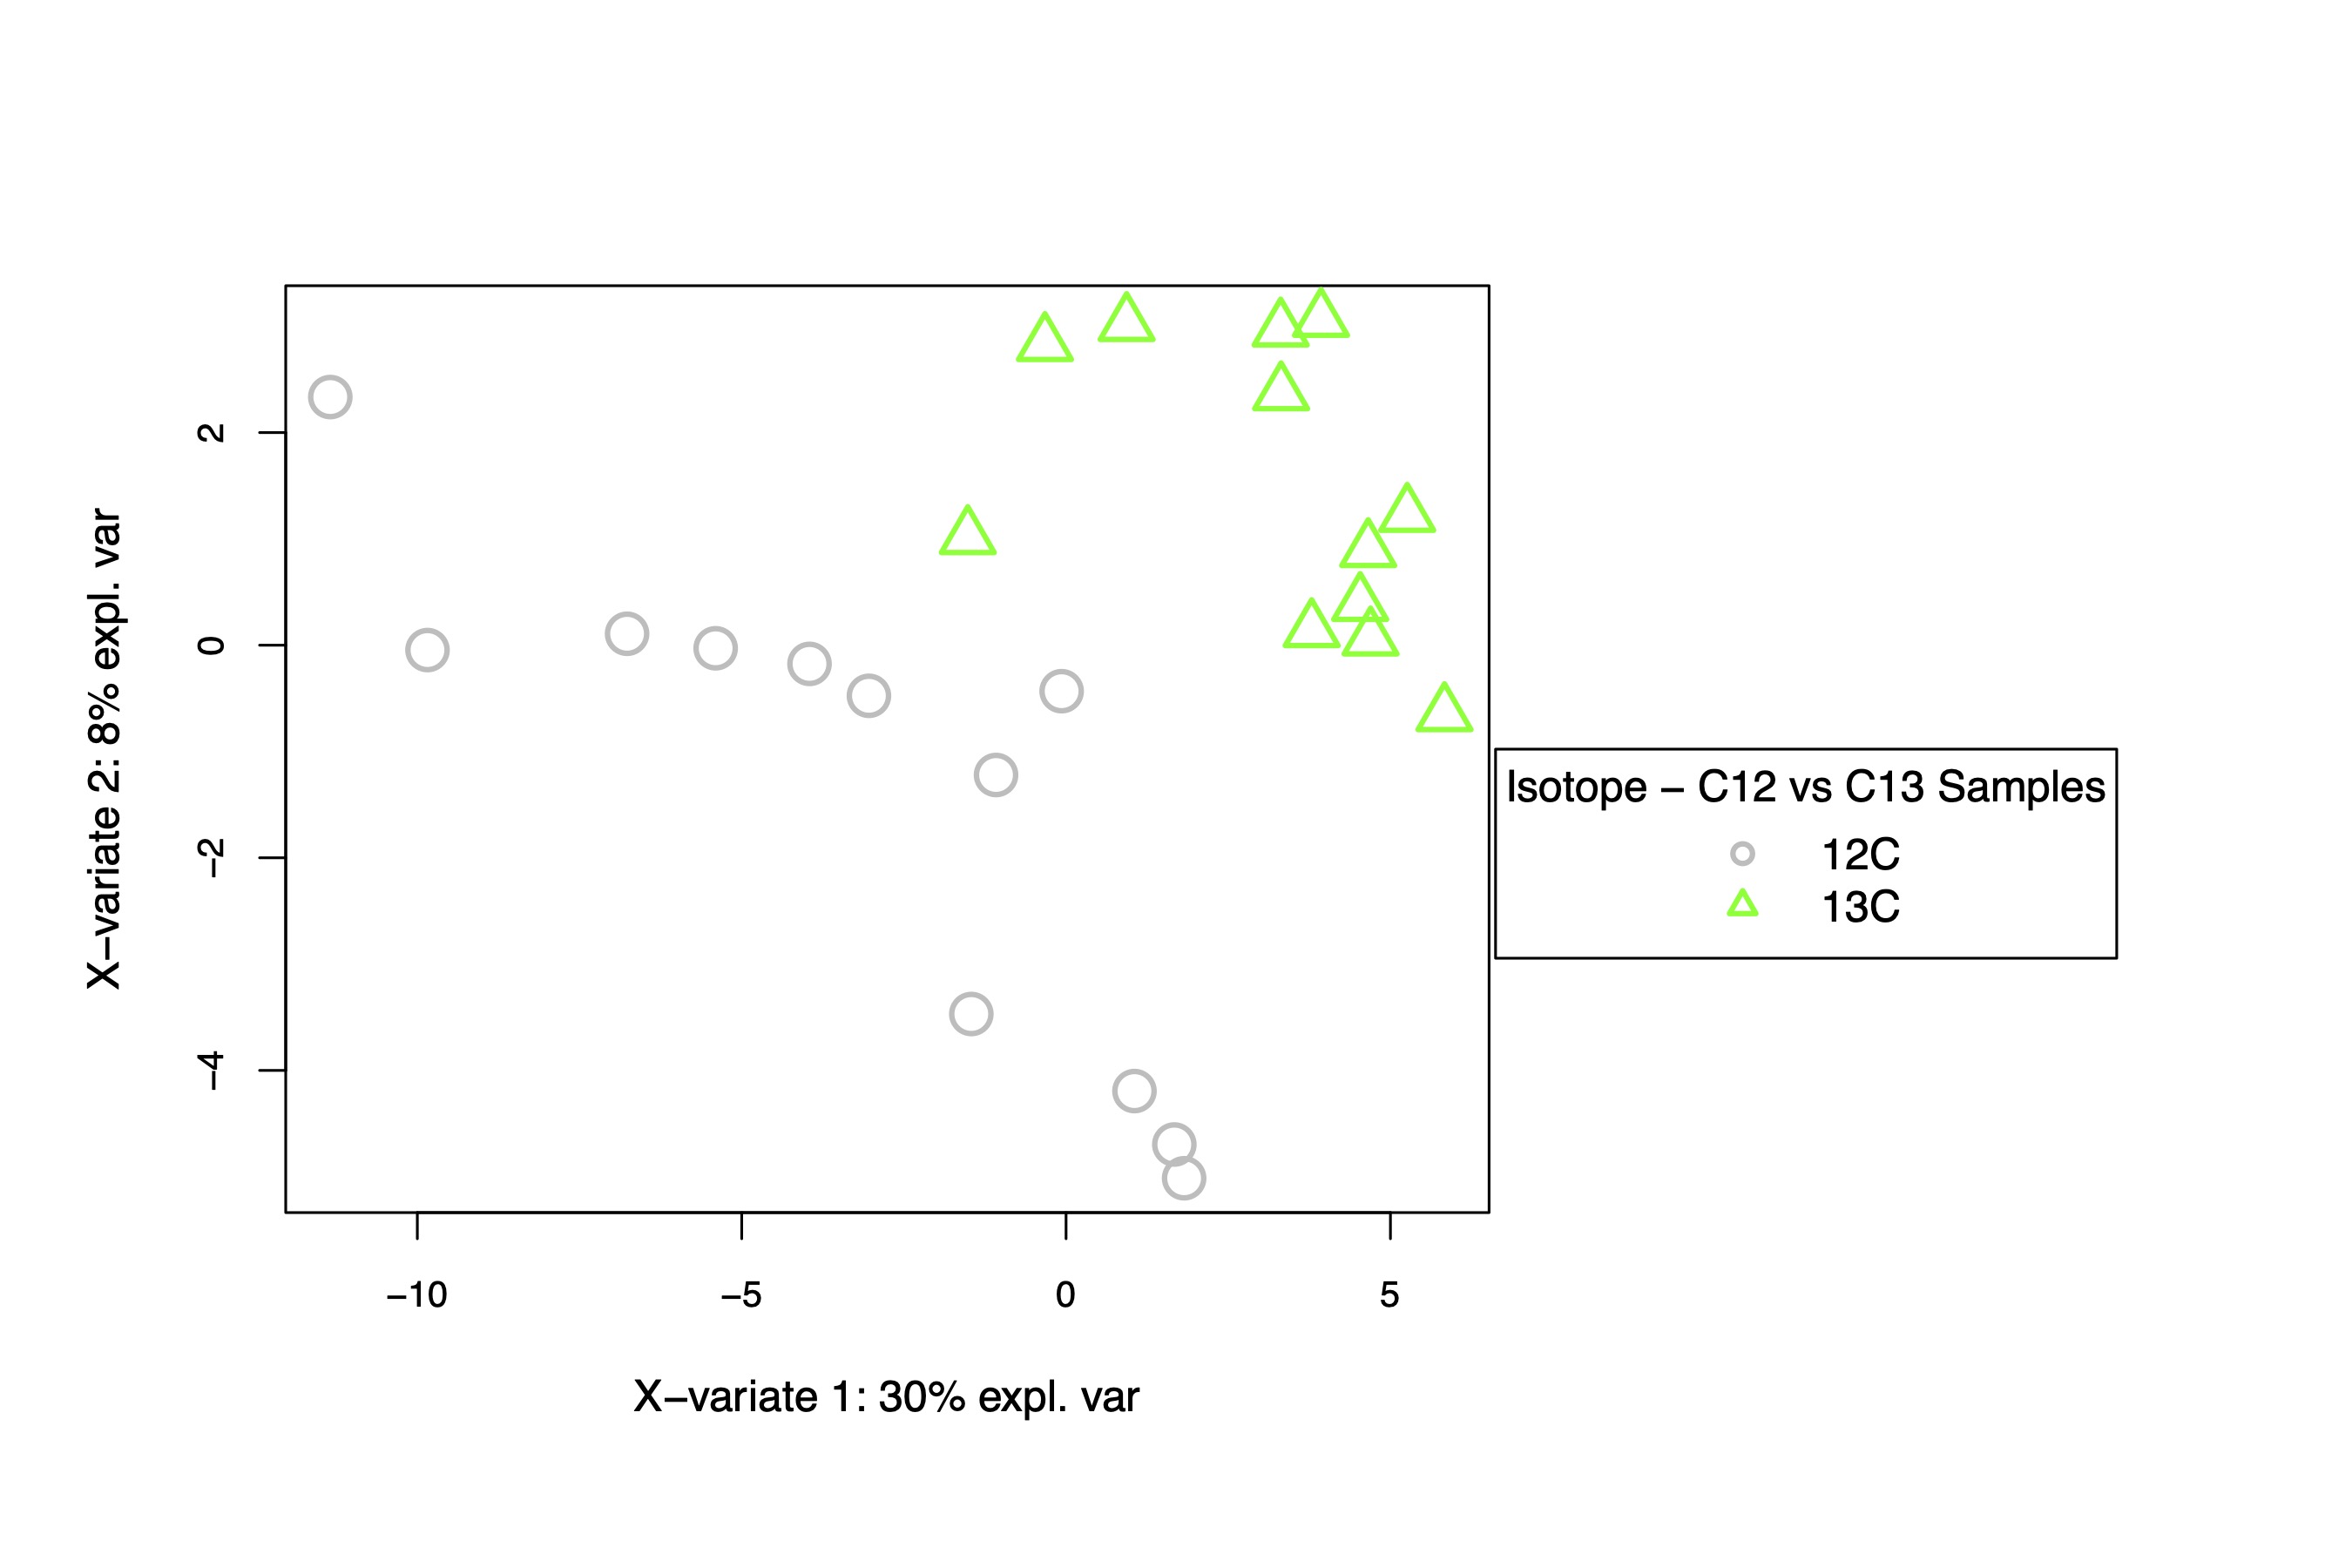
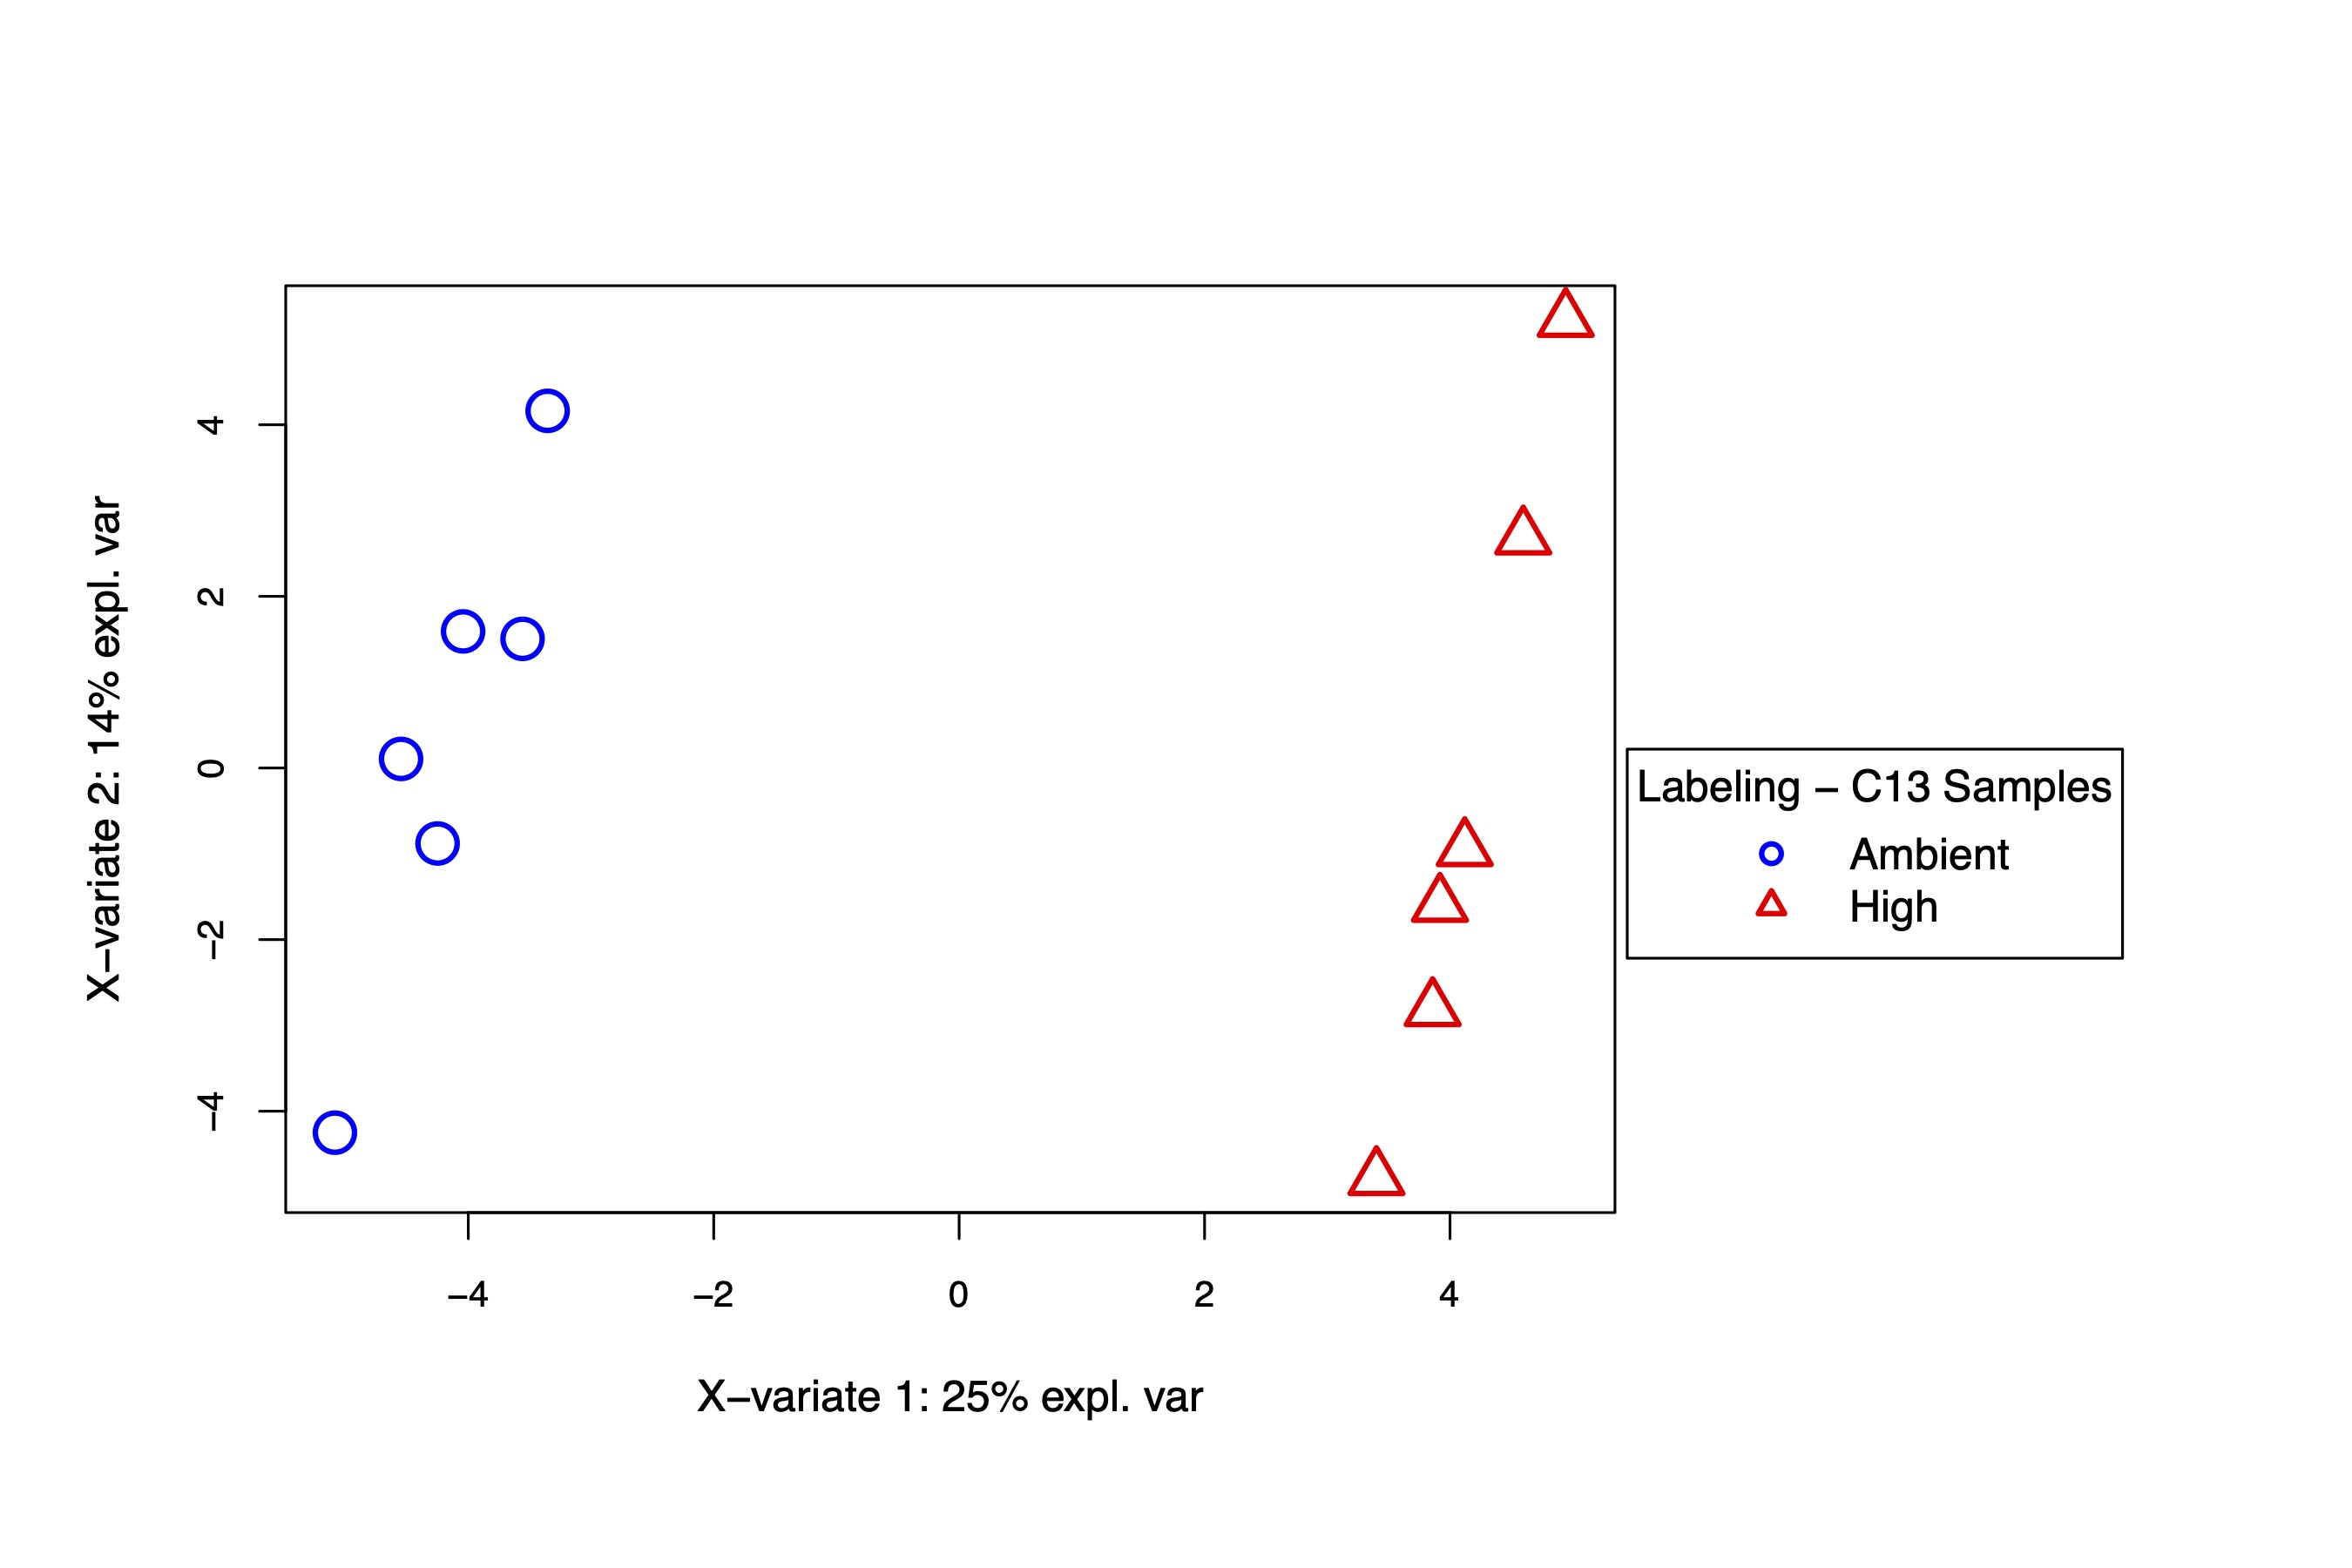
This PLS-DA shows separation in the isotope treatments, primarily on the y-axis, responsible for 8% of variation. Isotope may drive some differences in metabolite profiles, but the variation appears to be small.
I then plotted the pool size of the VIP metabolites by treatment.
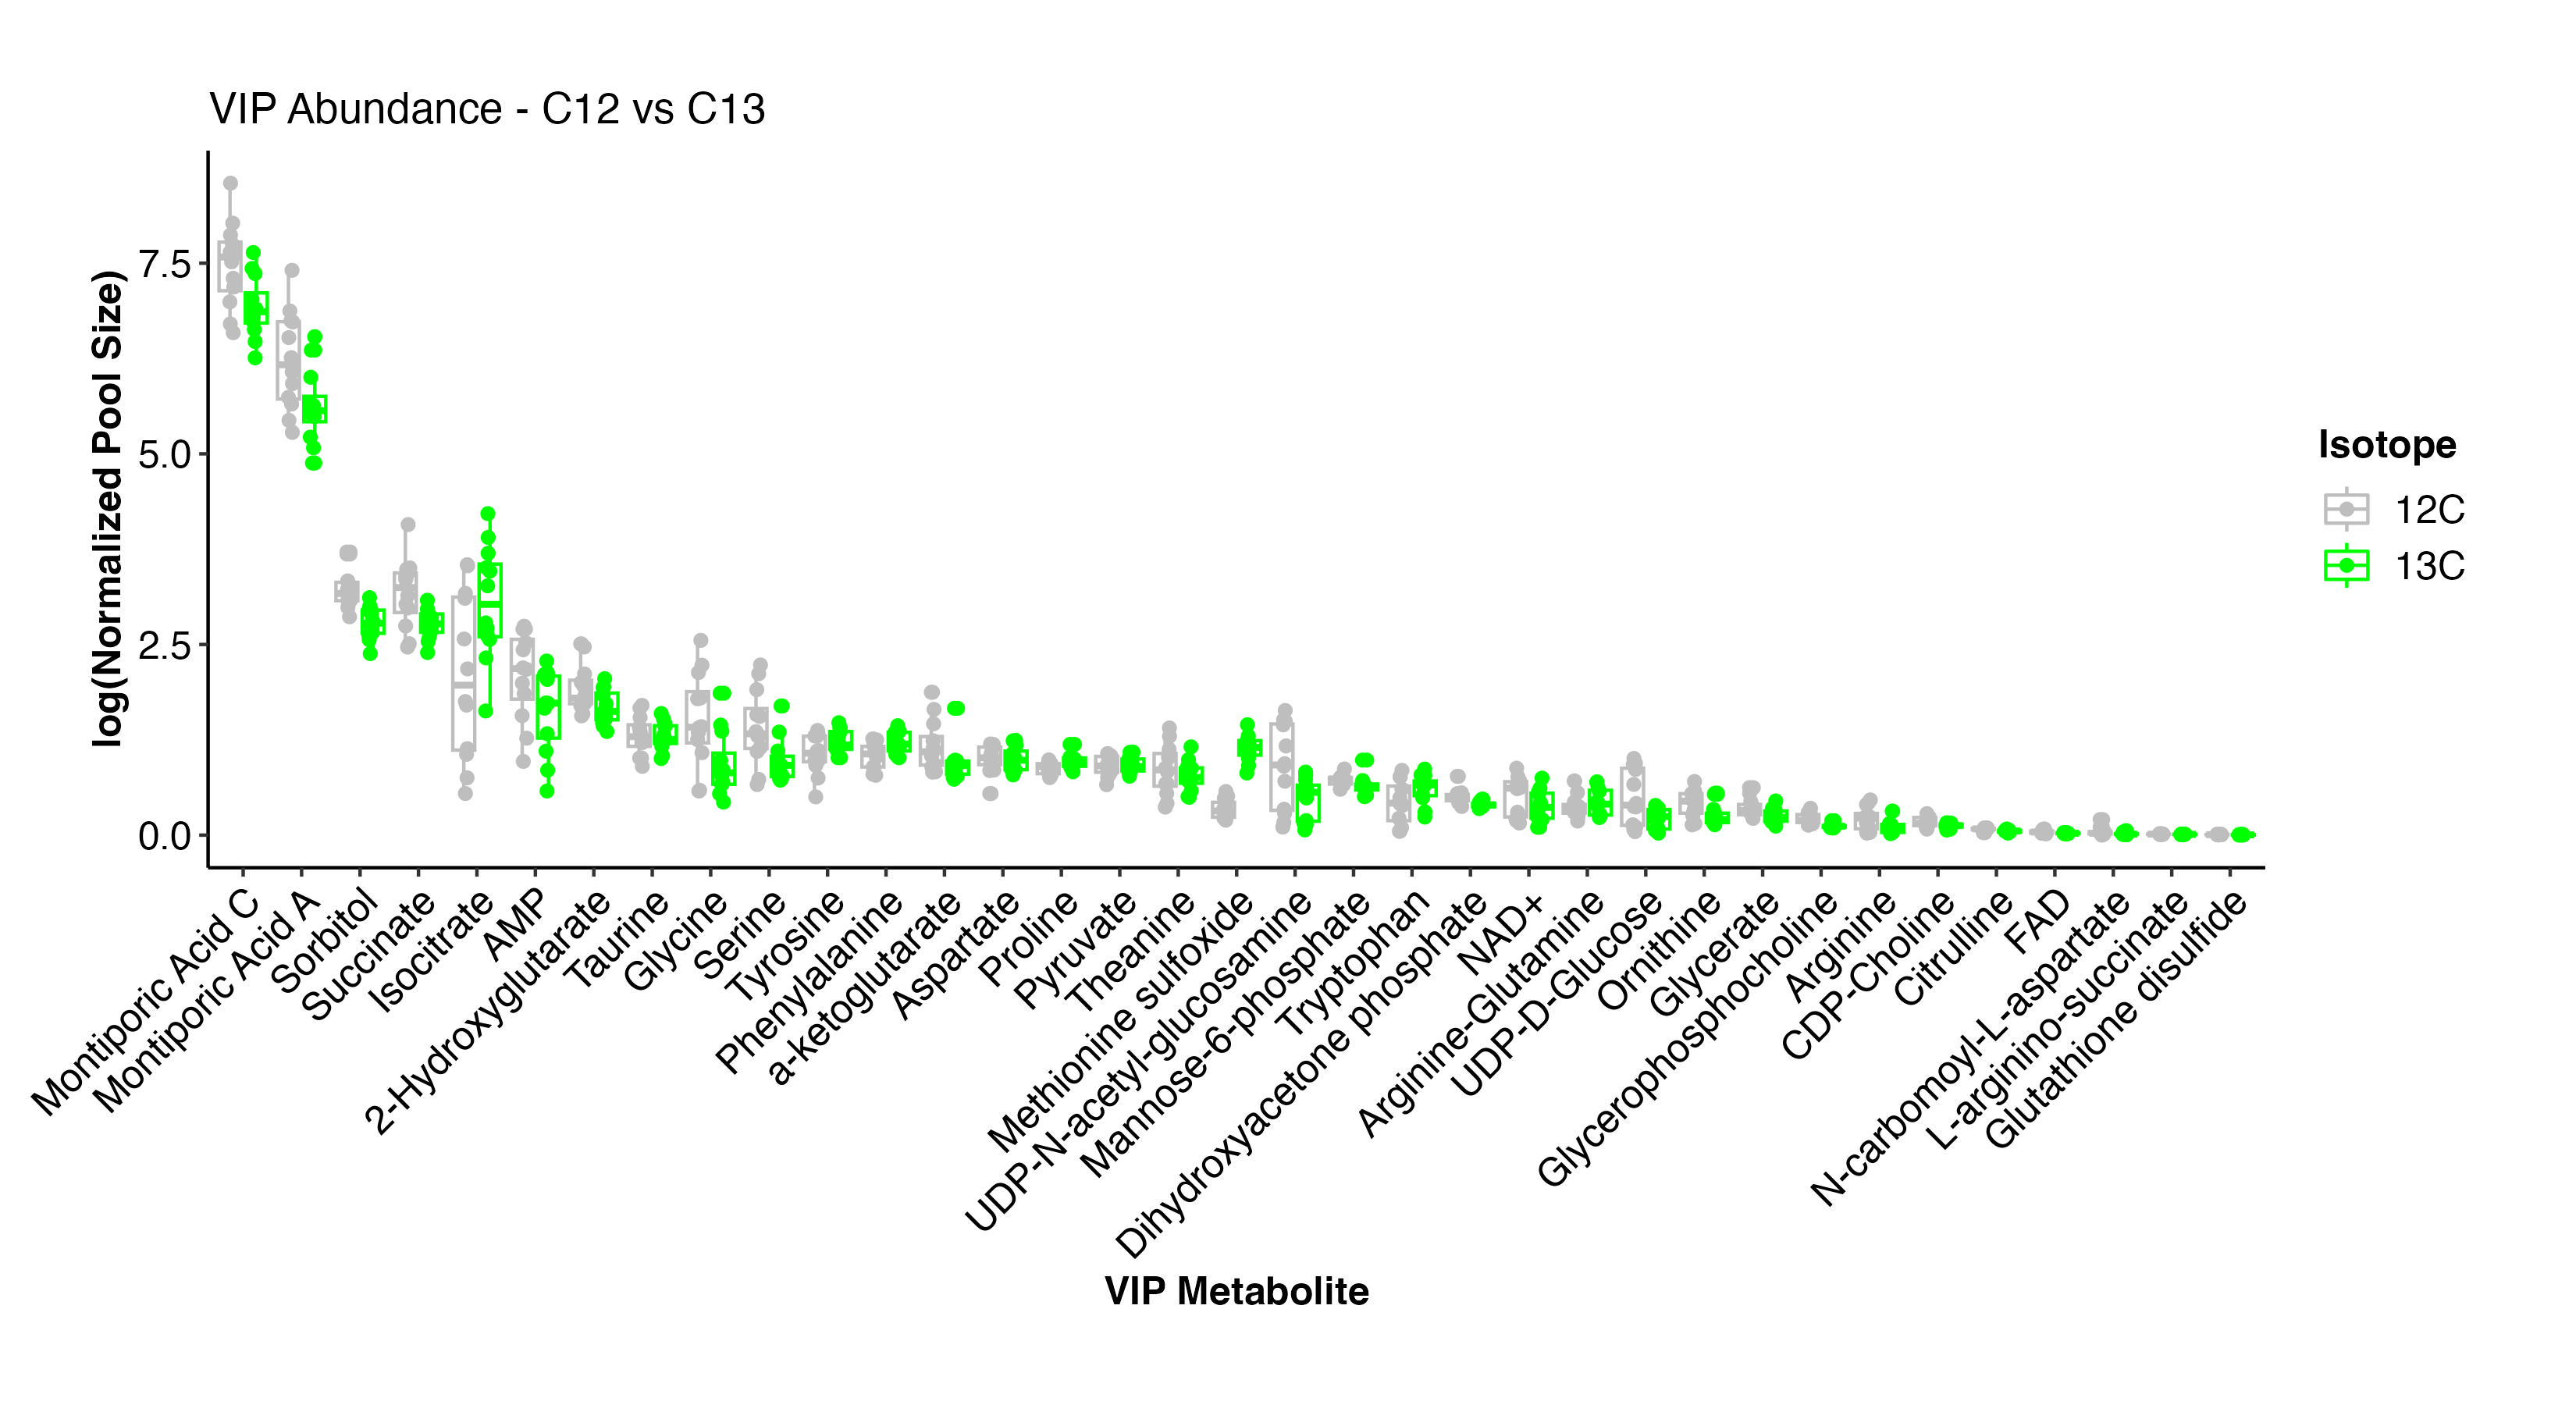
Here, we can see that the metabolites driving differences have small differences in pool size. The metabolite with the greatest difference is methionine sulfoxide, which is higher at C13 isotope treatment. Some metabolites are higher and some are lower at C13, but there are no metabolites that are highly present in one treatment and absent in the other.
This analysis suggests that major metabolic pathways are not influenced by isotope treatment and the C13 treatment represents biologically relevant pathways.
C13 vs Dark-C13
I next applied the same approach to look at differences in C13 and Dark-C13 metabolite abundance. For this analysis, we would expect to see differences in metabolism due to the absence of photosynthesis in the dark. We will look further into the dark samples in the labeling analysis.
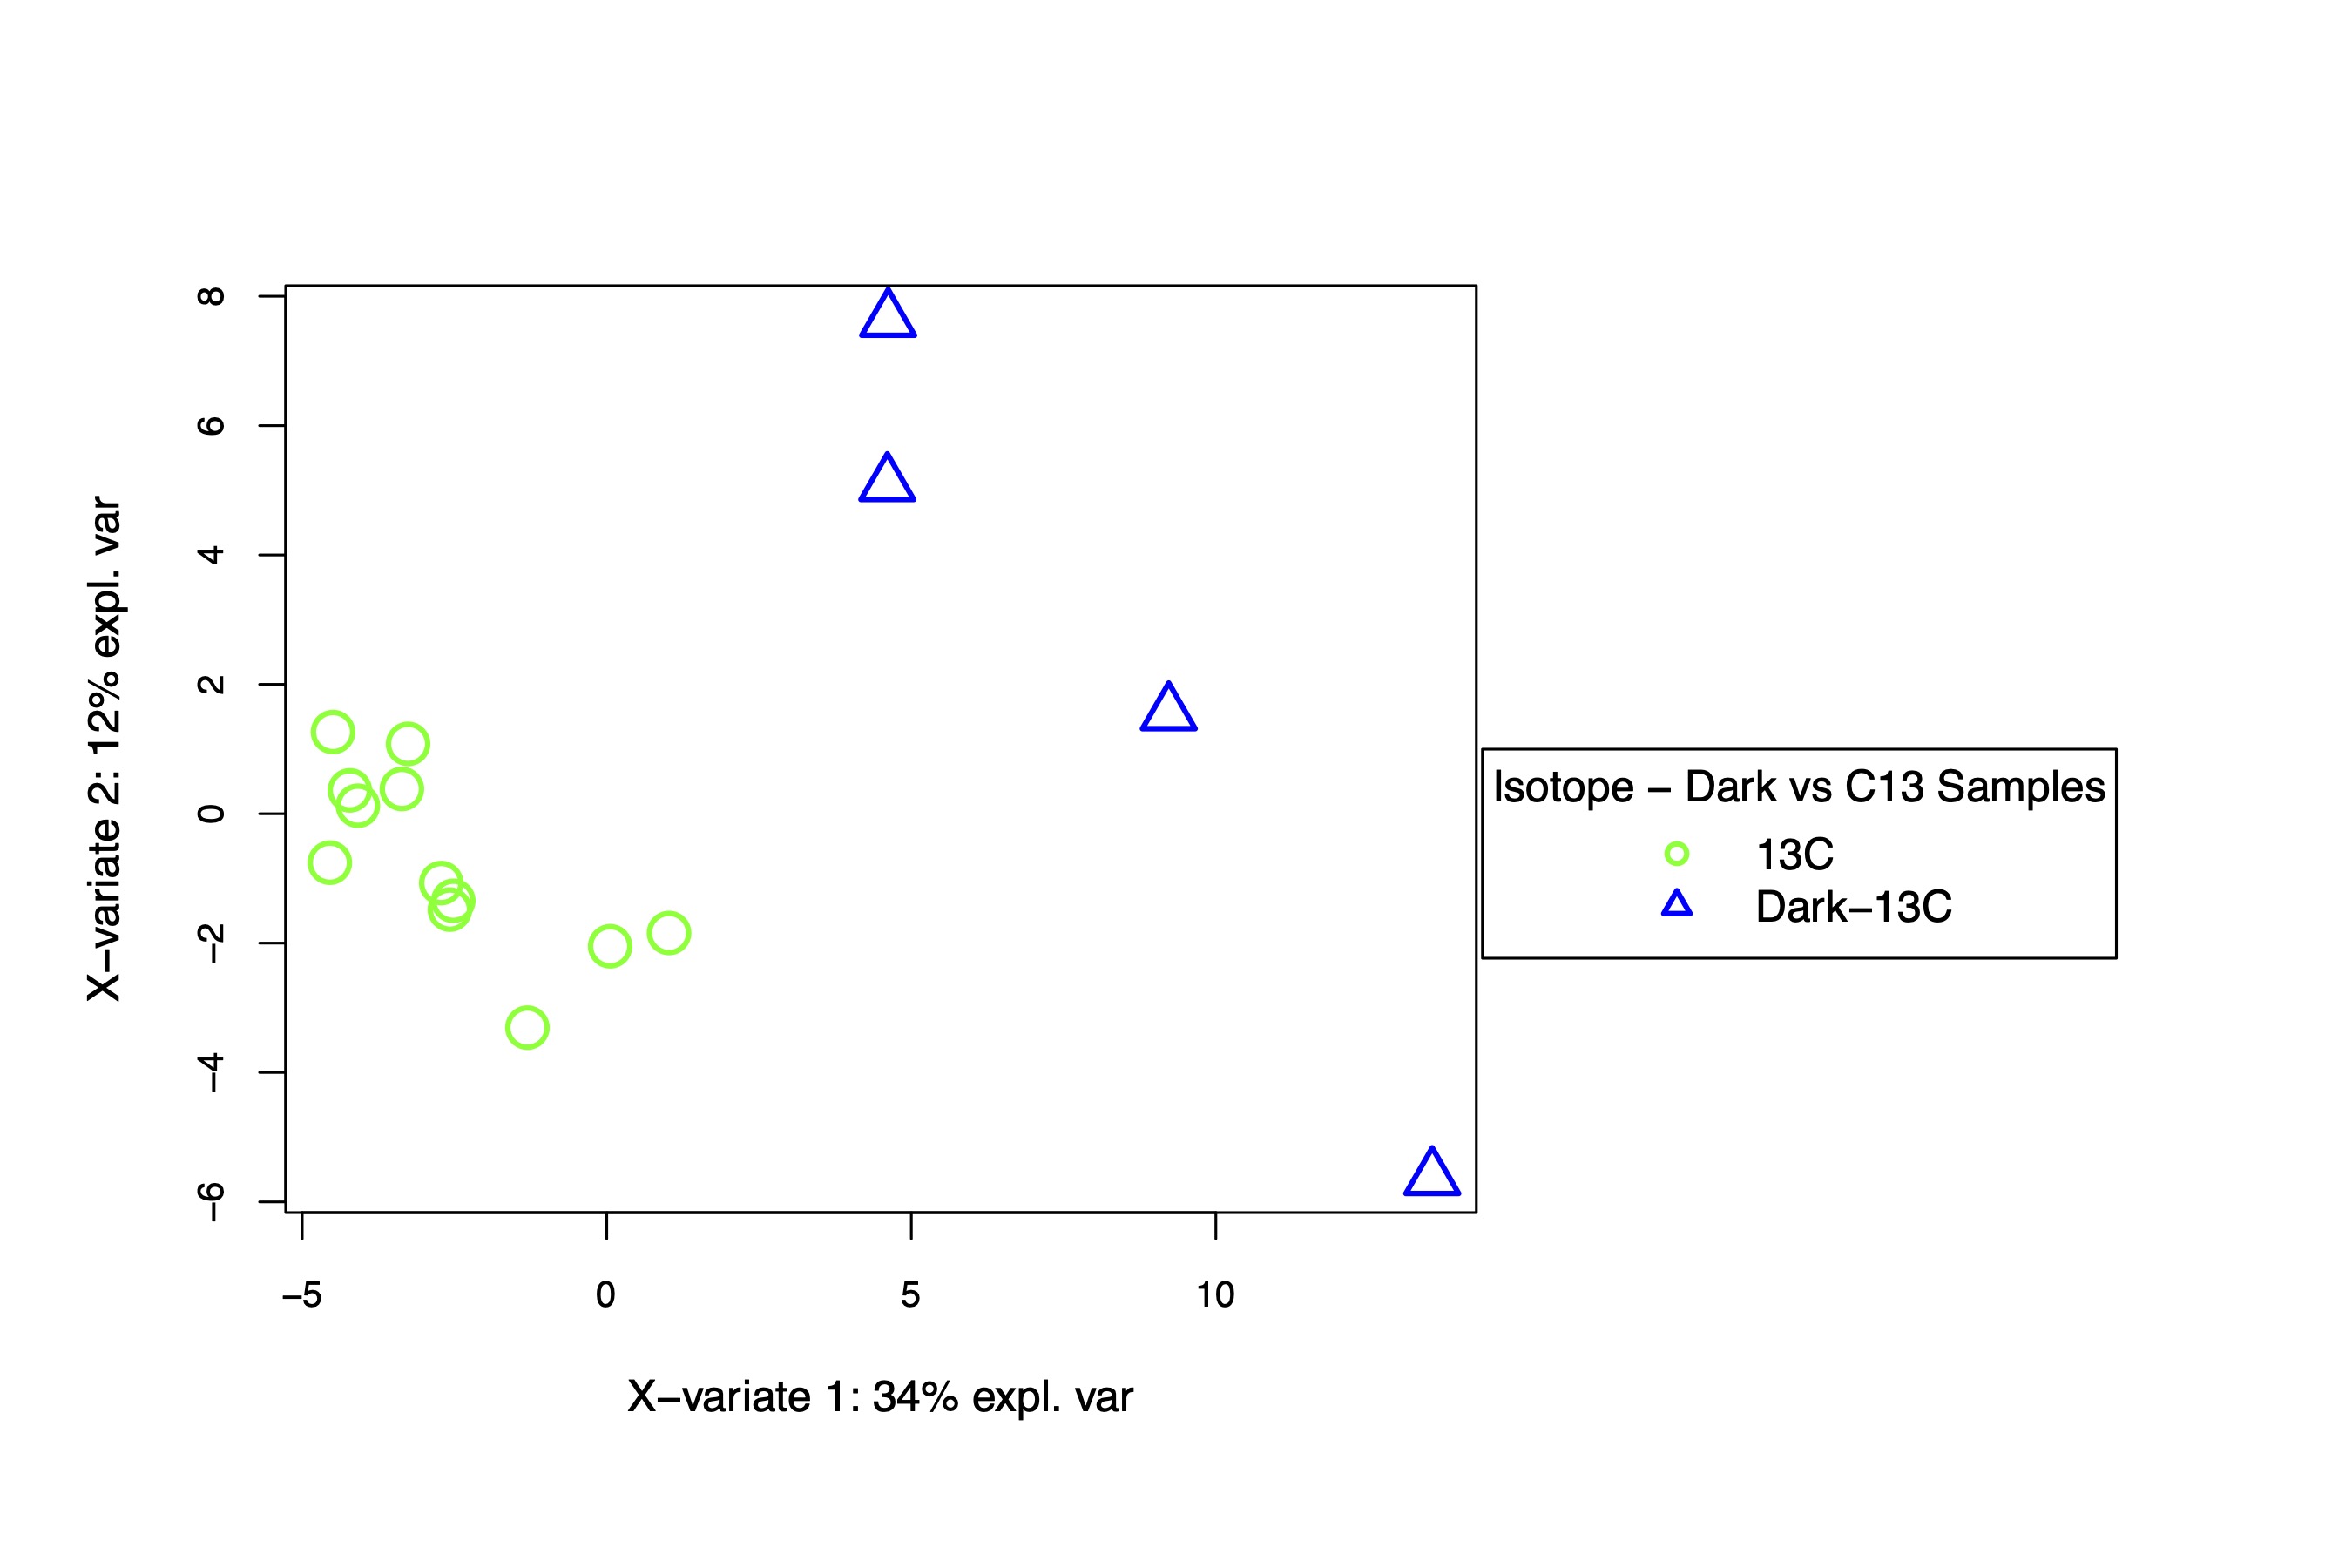
There is separation between dark and light C13 samples separated on the x-axis, which describes 34% of the variance. This is expected as metabolism should be different in the dark.
There are several metabolites that differentiate the dark and light samples. Note that all temperature treatments are included here since we are looking only at light treatment.
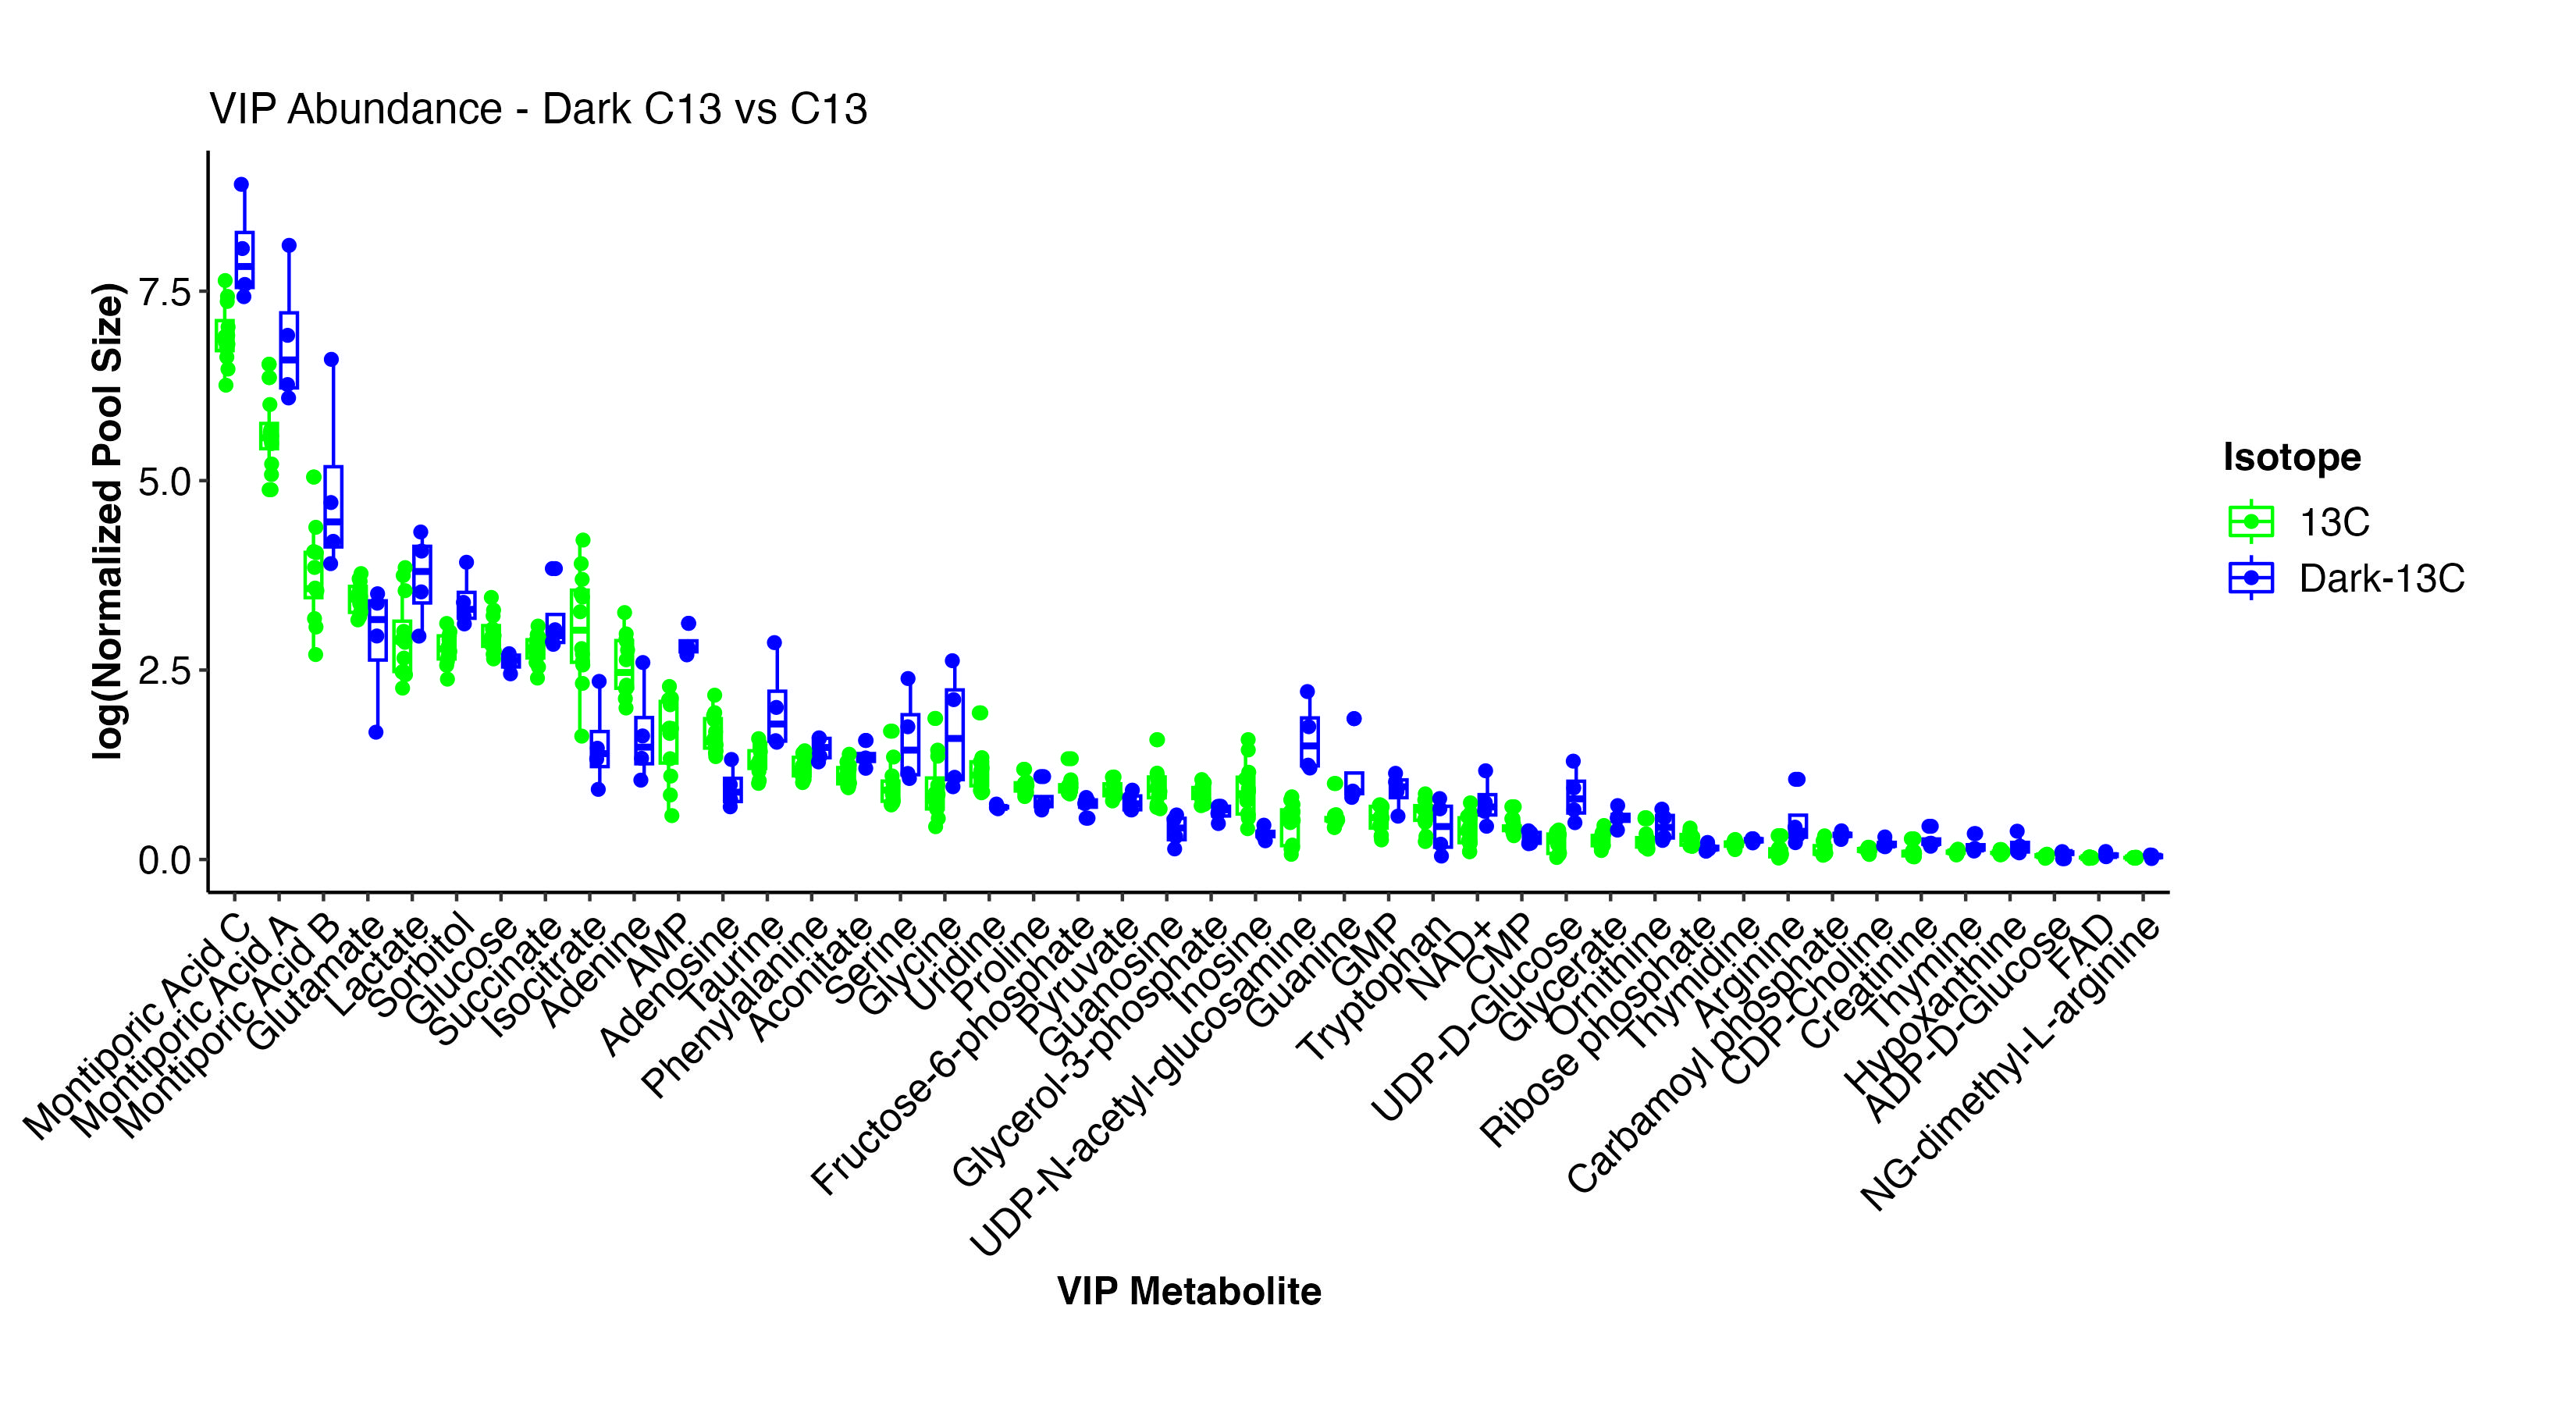
Interestingly, Montiporic acids are higher in the dark. There is not much research on these acids. Perhaps these acids are synthesized when photosynthesis is low or at night in corals.
Other metabolites that are different by treatment include a reduction in glutamate, glocose, isocitrate, amino acids, and pyruvate. These are all signals that translocation of photosynthates (e.g., glucose) is decreased along with subsequent metabolism through glycolysis (e.g., F6P, pyruvate). There is an elevation in lactate, AMP, glycine, UDP-D-Glucose, which are signals of metabolism of stored reserves and use of alterative energy sources (e.g., lipids). This makes sense under the reduction of photosynthesis.
We will look further into differences in labeling in the dark samples.
2. Is metabolite pool size different between temperature treatments?
I next tested whether metabolite profiles differed by temperature treatment. I conducted this analysis within the C12 and C13 samples to compare the results.
As I did above, I first conducted a PCA unsupervised analysis, followed by a PLS-DA supervised analysis and VIP extraction.
C12 samples
Permutation test for adonis under reduced model
Terms added sequentially (first to last)
Permutation: free
Number of permutations: 999

adonis2(formula = vegan ~ treatment, data = pool_size_pca_12C, method = "eu")
          Df SumOfSqs      R2      F Pr(>F)
treatment  1   202.88 0.20493 2.5775  0.013 *
Residual  10   787.12 0.79507
Total     11   990.00 1.00000
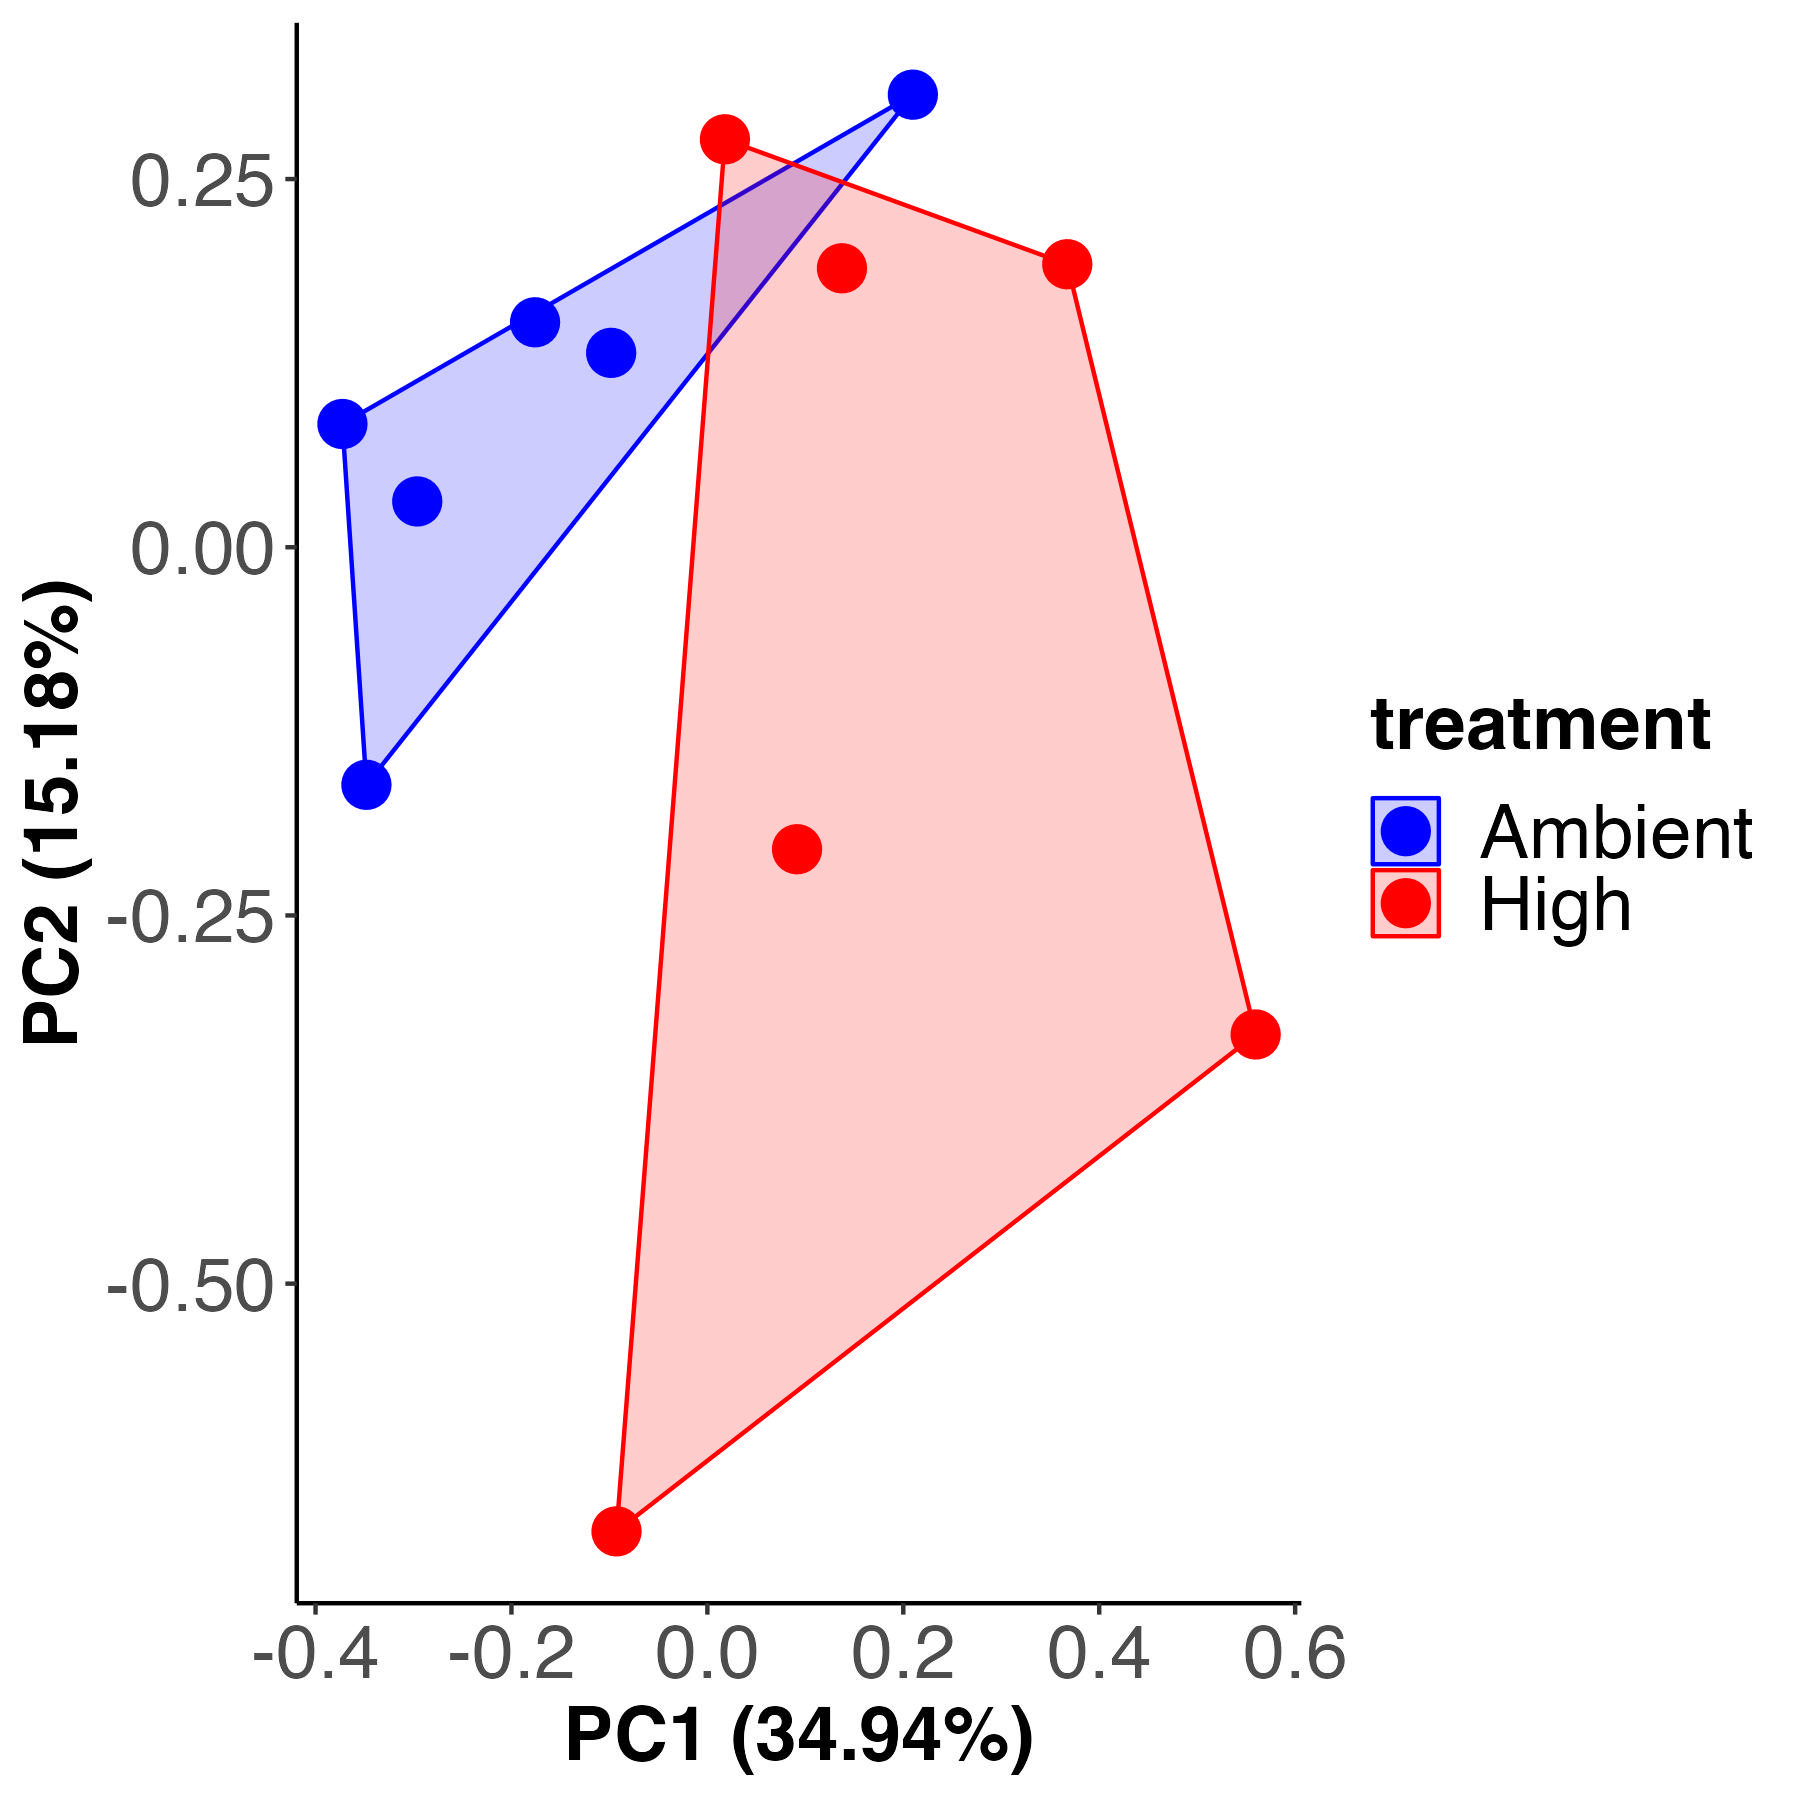
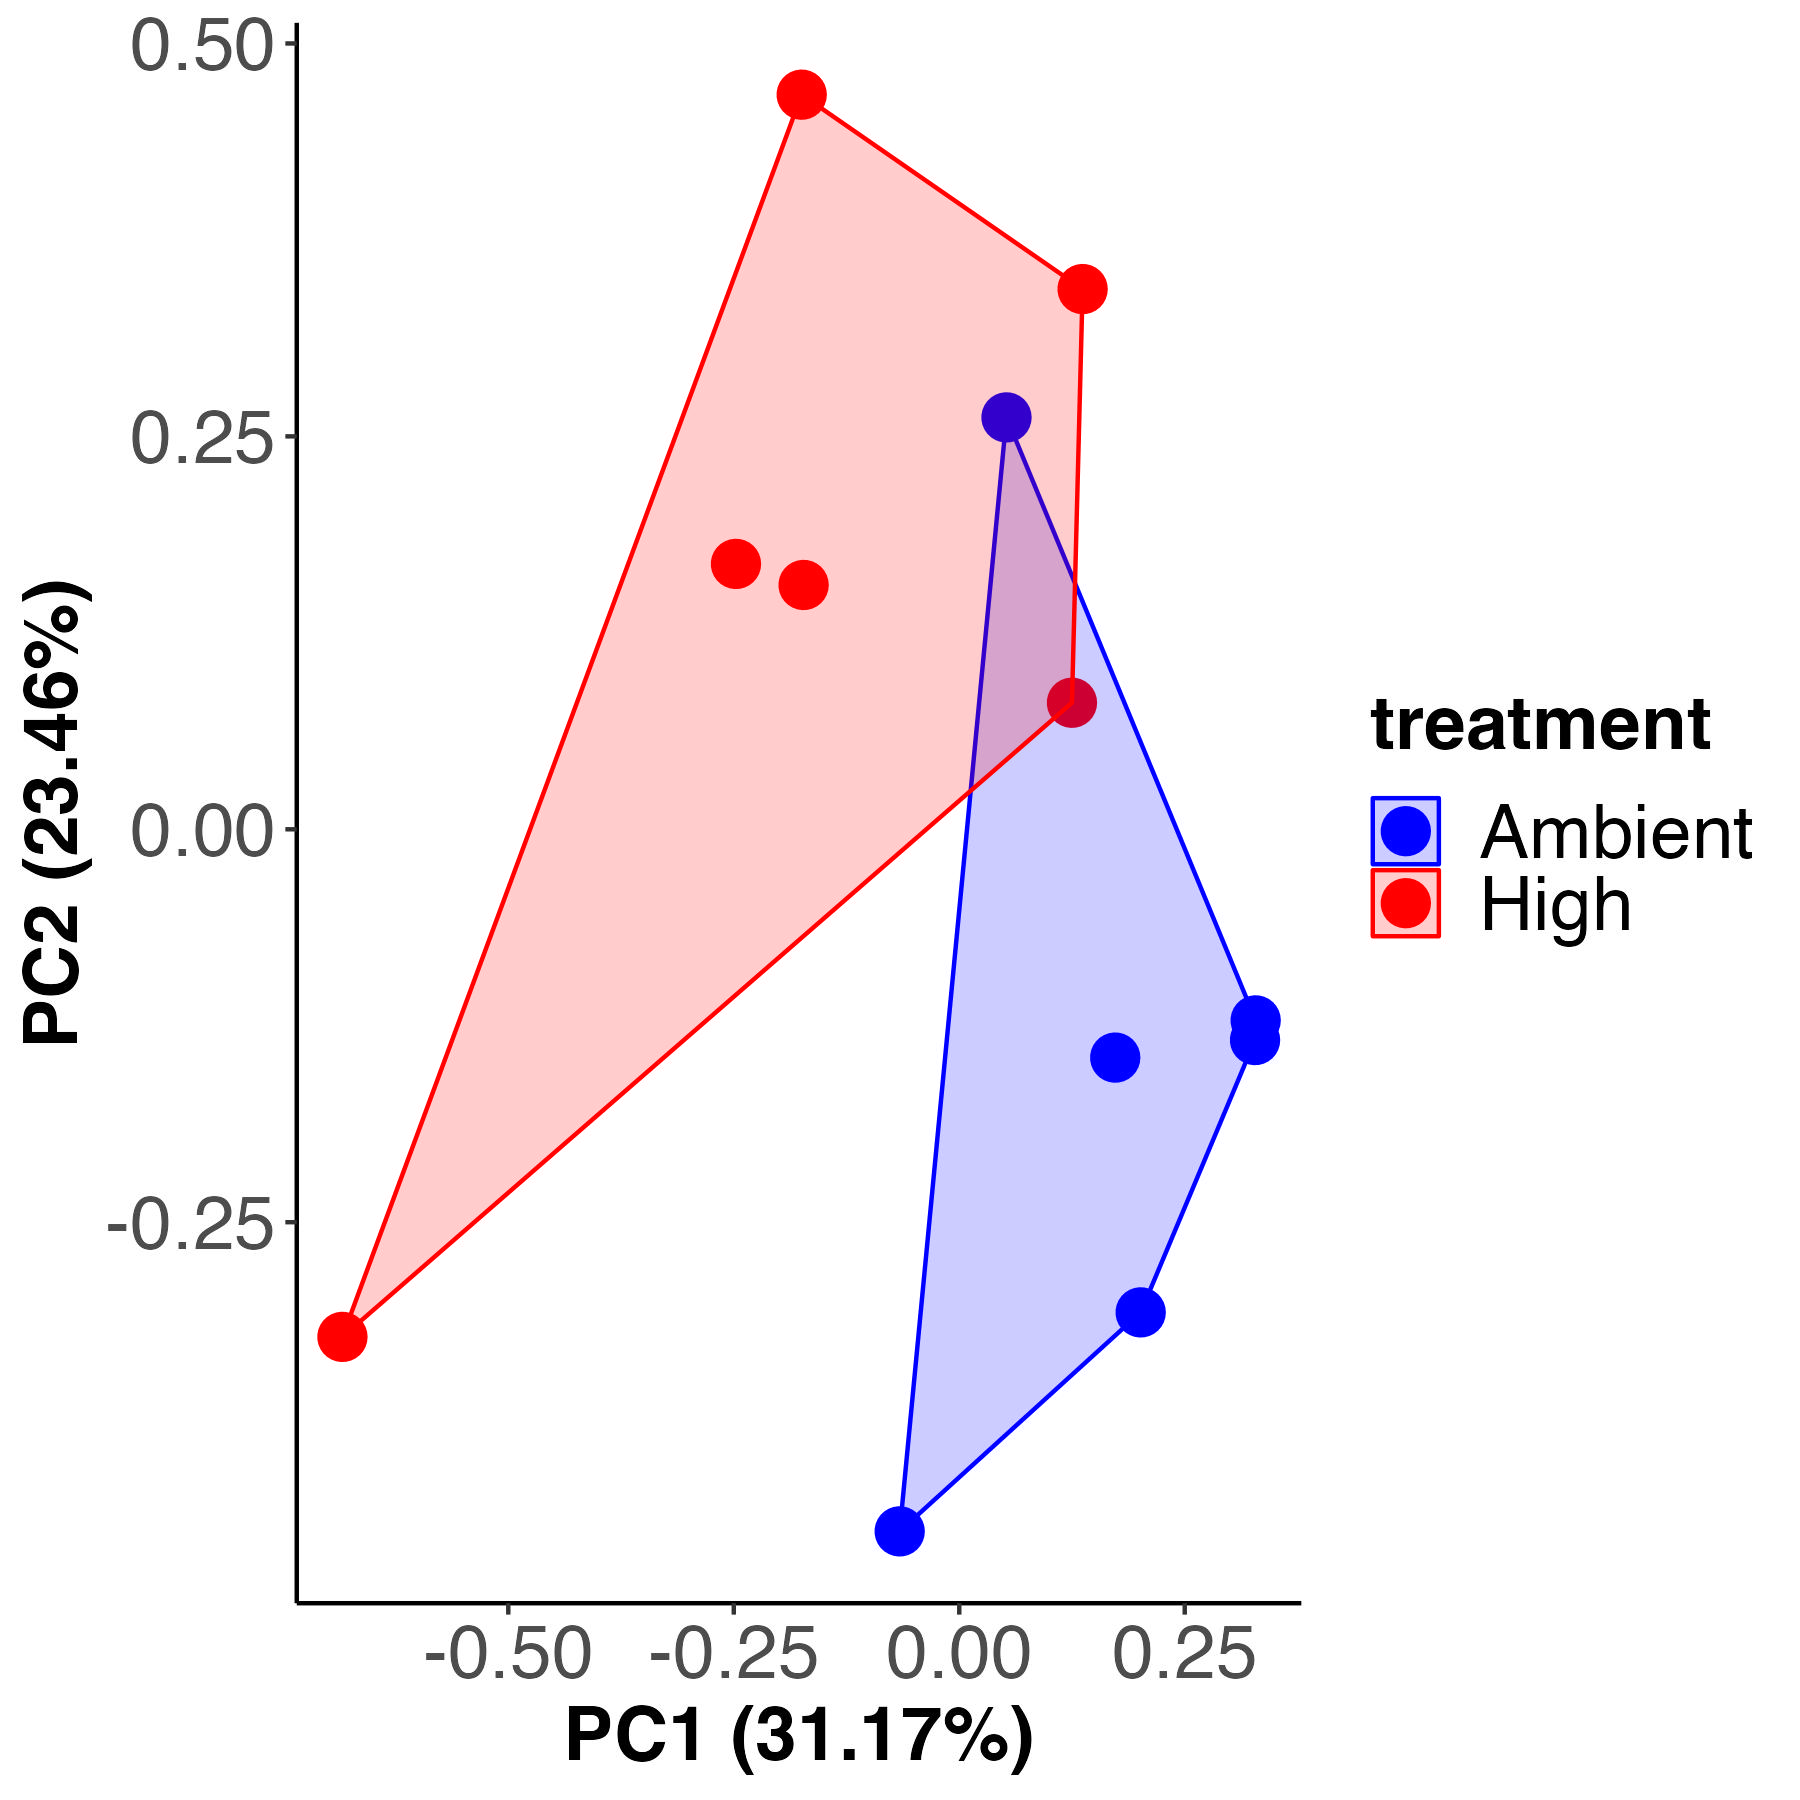
There is a difference in metabolite profiles by temperature treatment in the C12 samples. Treatment accounts for 20% of variance with 79% residual variance. It appears that there is more variability within the high temperature treatment than there is within the ambient treatment.
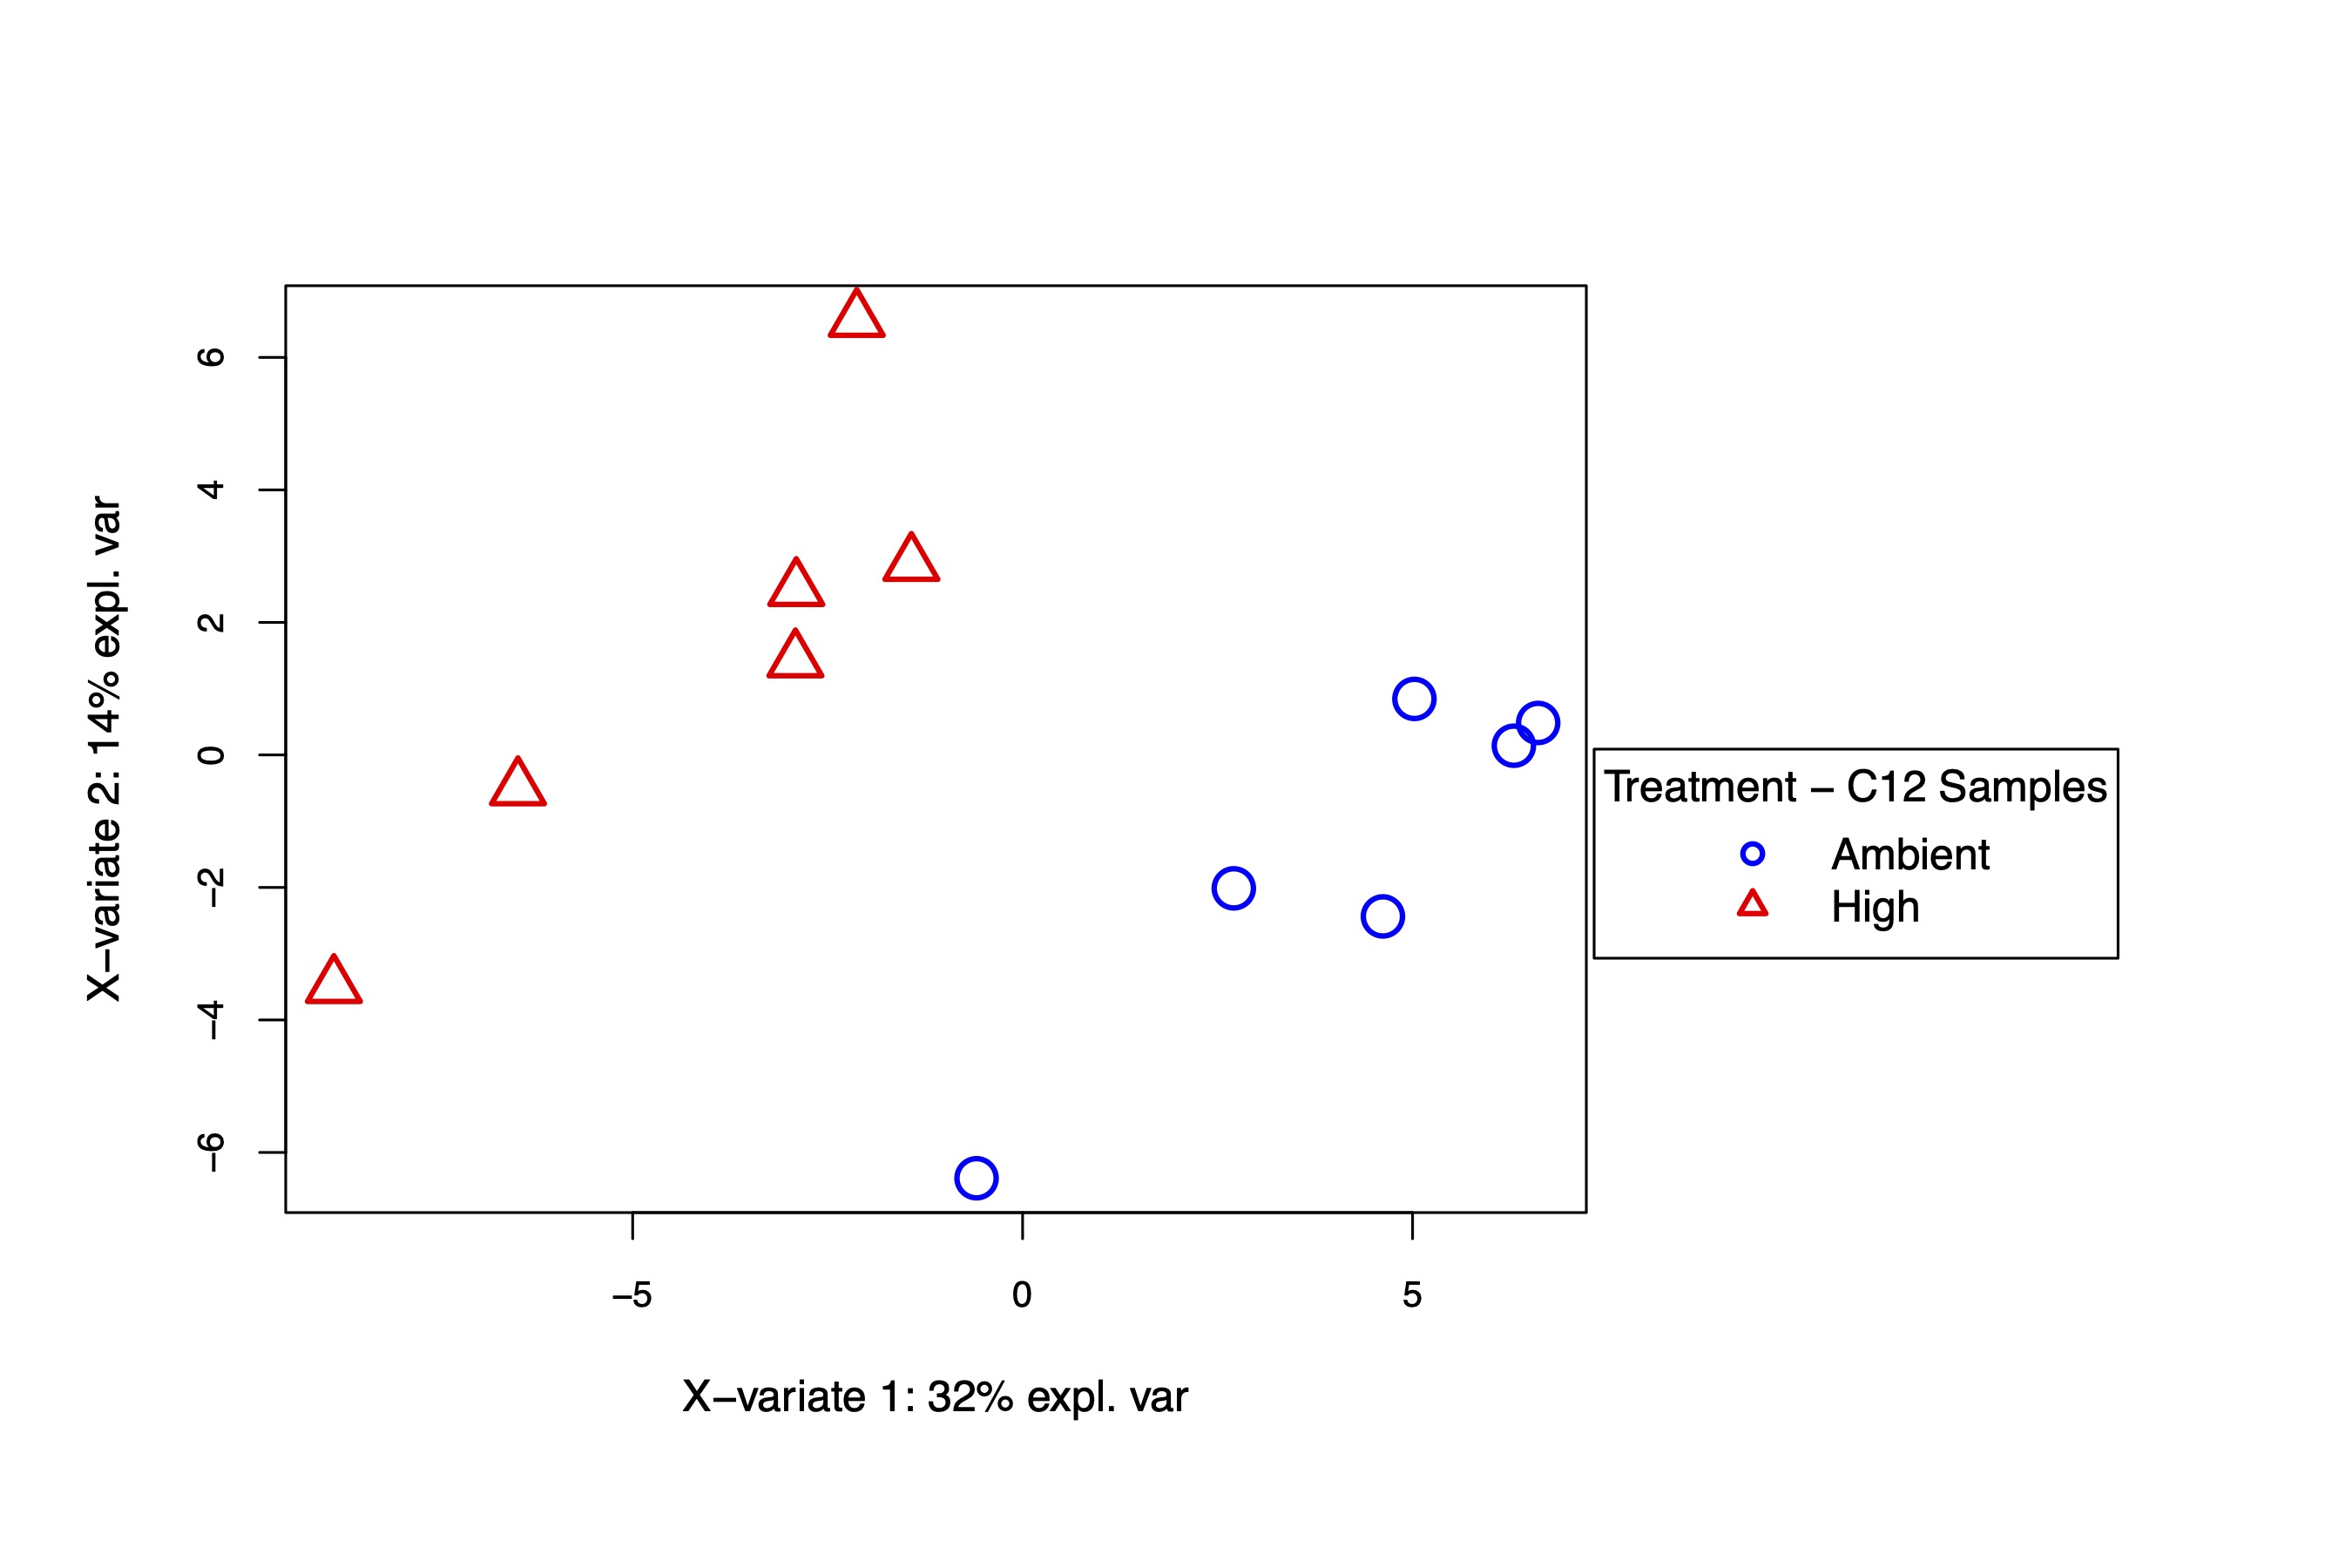
The supervised PLS-DA analysis shows again that there is separation by temperature treatment on the x-axis, which describes 32% of the variance. These analysis confirm there is a difference in metabolism between treatments in the C12 samples.
I next viewed the VIP metabolites that differentiate ambient and high treatments in the C12 samples.
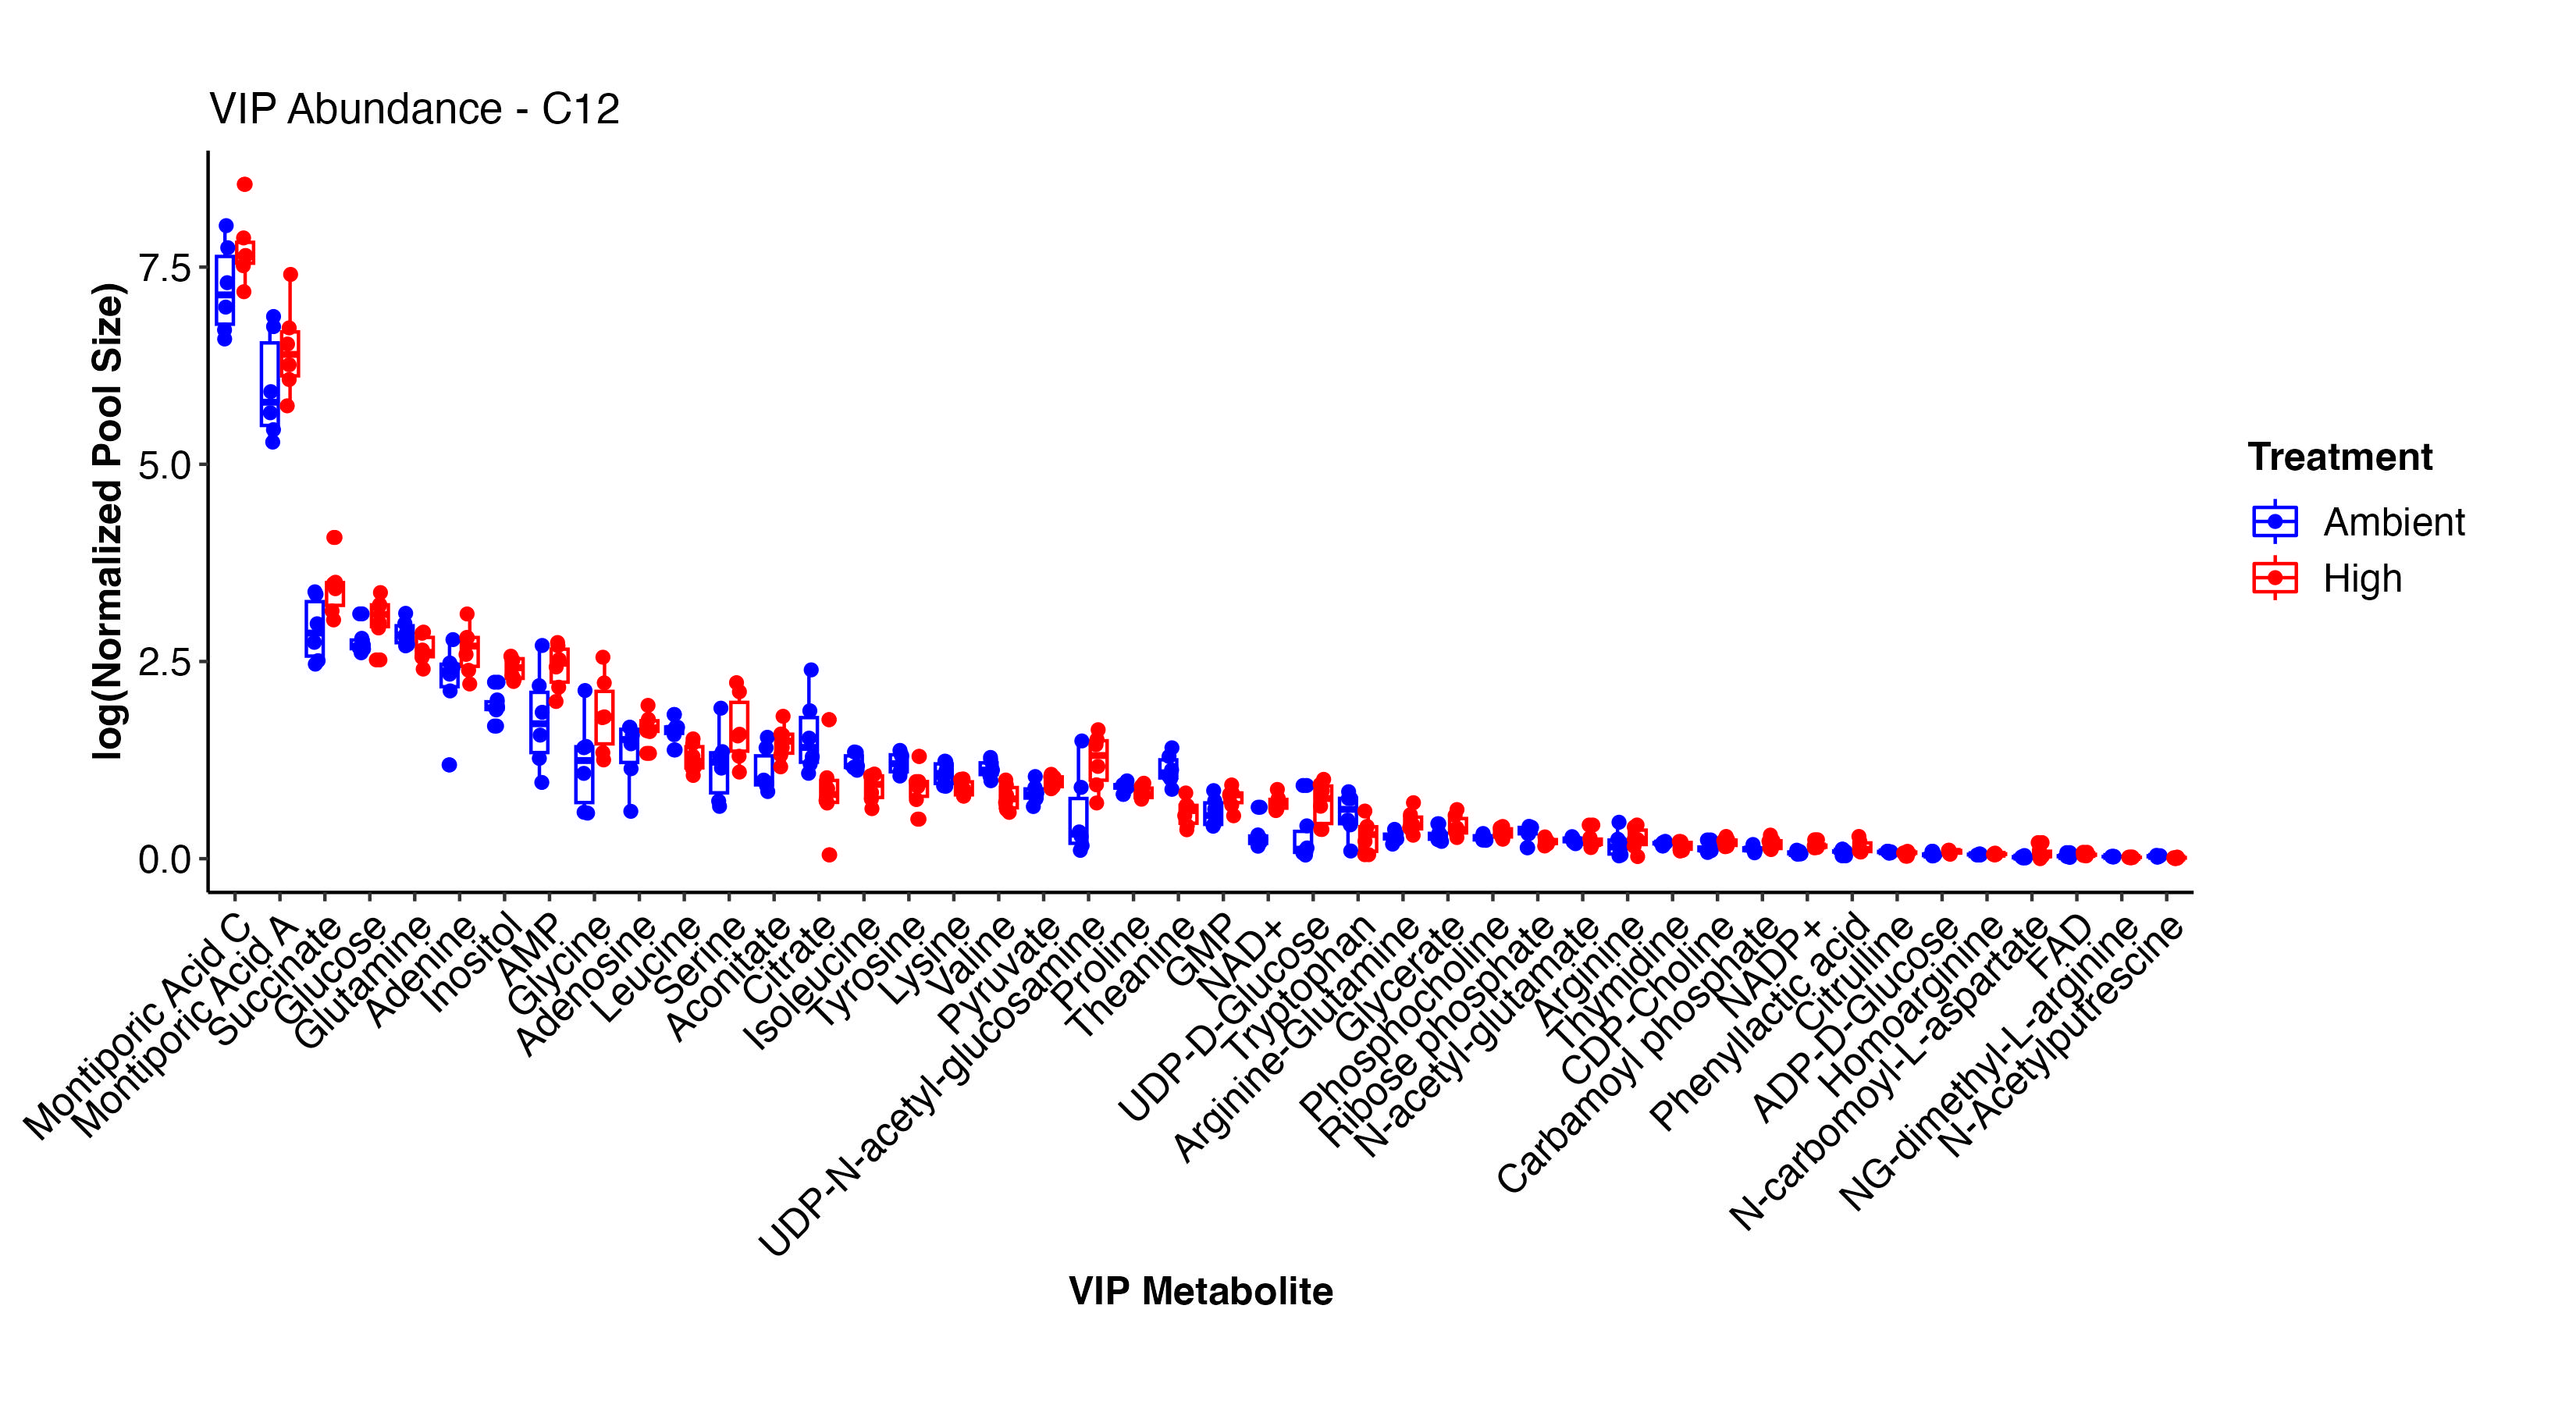
This plot shows the pool size of each VIP metabolite in high and ambient temperatures in the C12 samples. There are some key metabolites here that show differences.
To more easily view the difference in metabolite abundance, I plotted the metabolites by relative change between ambient and high temperature treatments. Here, a positive values indicates that the metabolite is more abundant at high temperature.
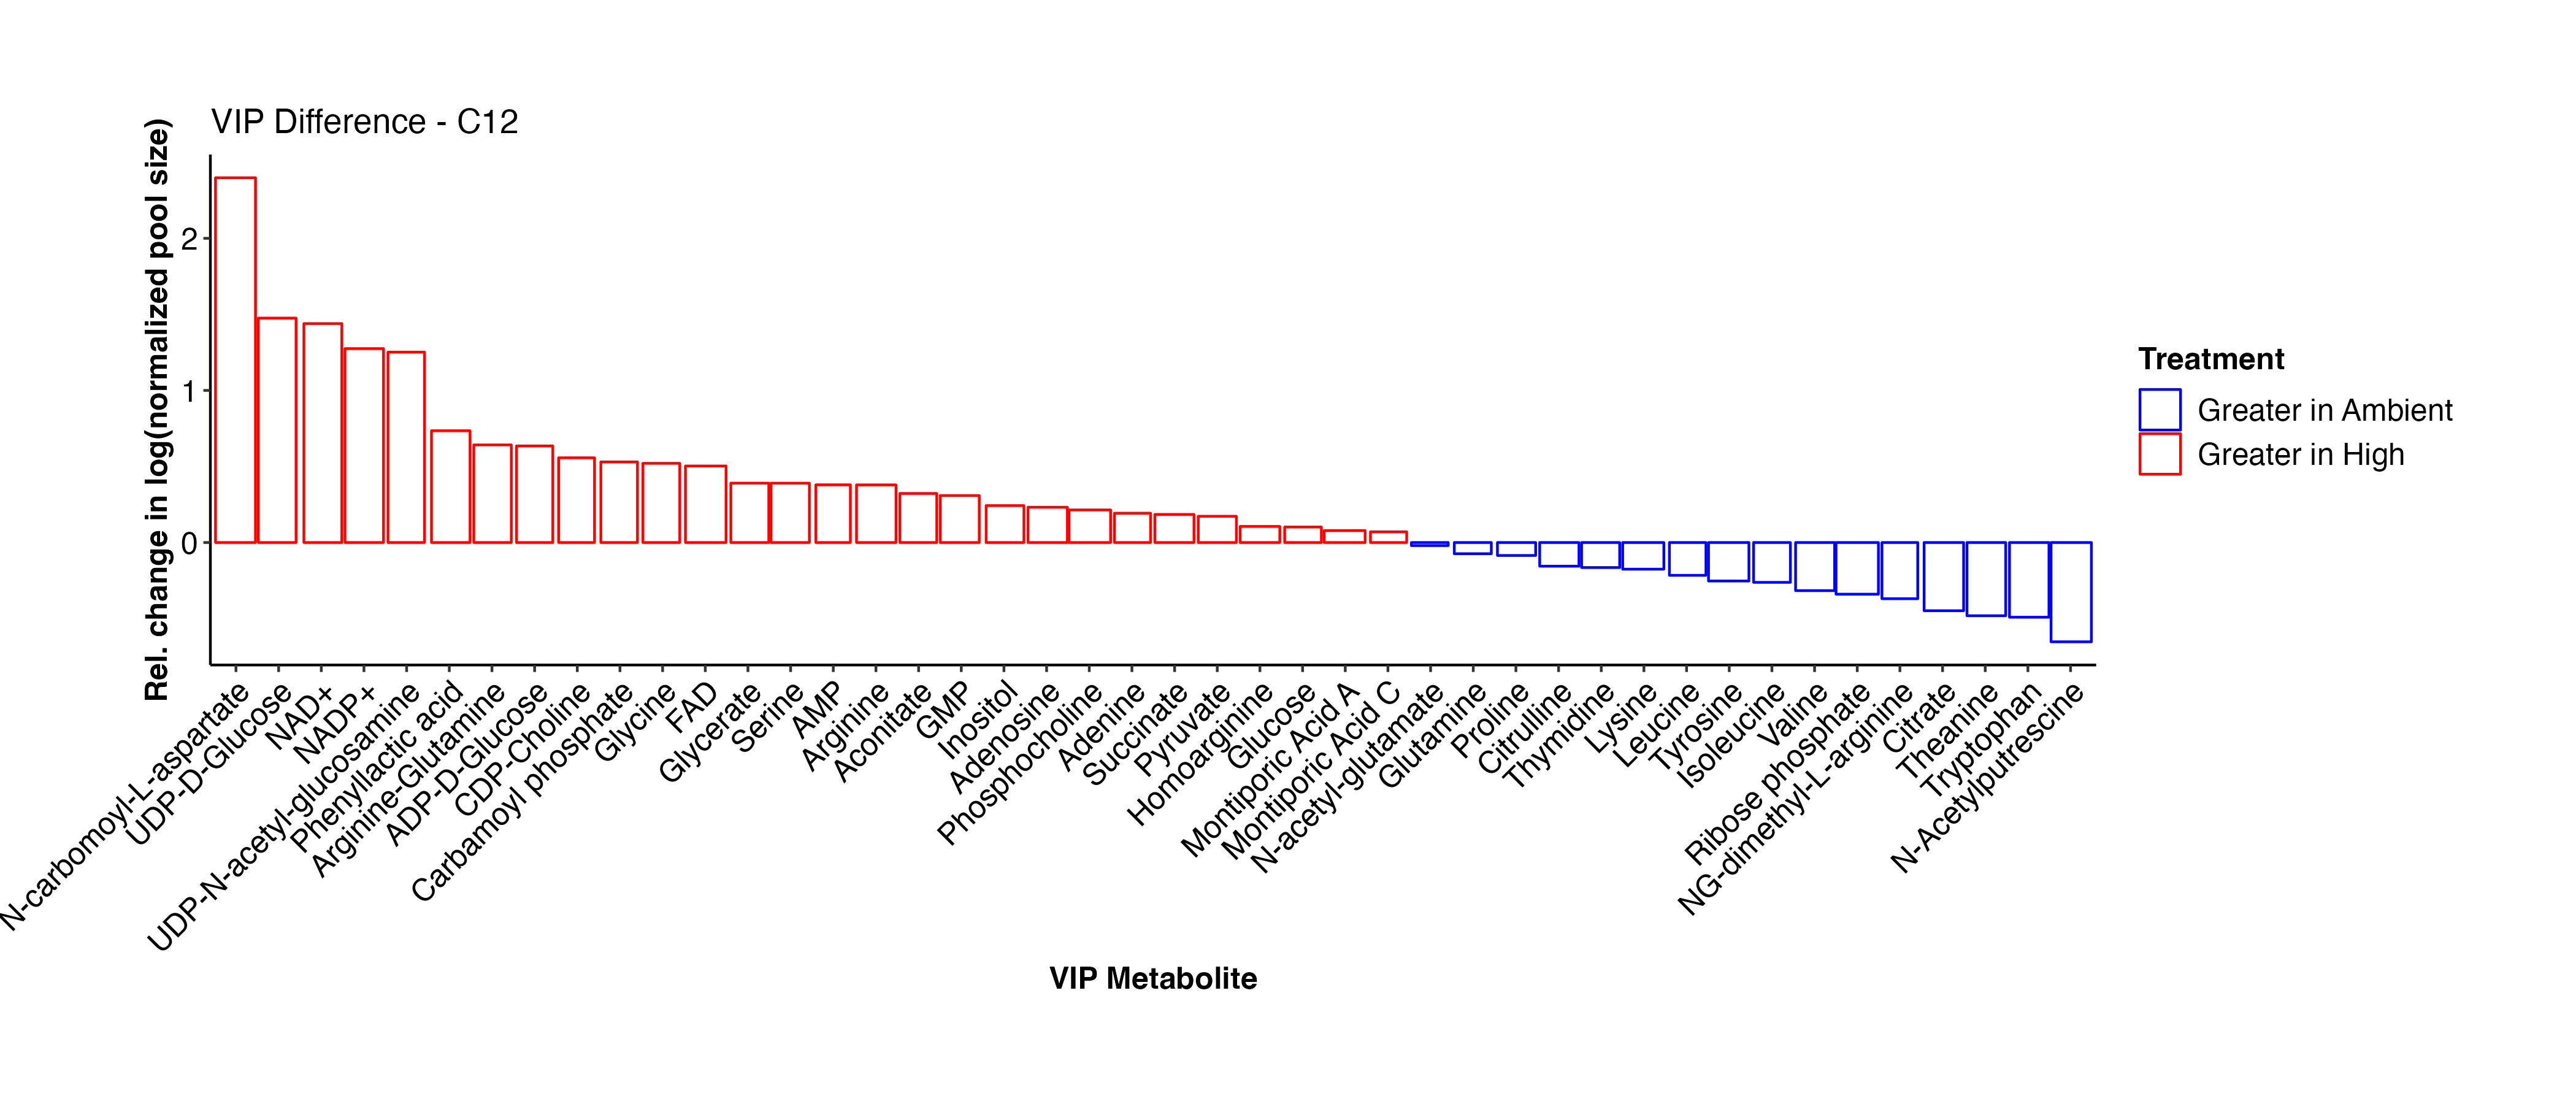
Interestingly, Montiporic acids are higher at high temperature. It will be interesting to think more about the function of these metabolites and why they may be increasingly present at high temperature. Glutamate, glucose, inositol, UMP, adenosine, aspartate, arginine-glutamine, and NAD+ are among the metabolites that are at higher abundance at high temperature. These metabolites signal that there are shifts in carbon and nitrogen metabolism under high temperature, as expected during bleaching in corals.
Below, I will compare this list with the C13 samples to see if similar metabolites are found to be differentially present.
C13 samples
Permutation test for adonis under reduced model
Terms added sequentially (first to last)
Permutation: free
Number of permutations: 999

adonis2(formula = vegan ~ treatment, data = pool_size_pca_13C, method = "eu")
          Df SumOfSqs      R2      F Pr(>F)
treatment  1   220.51 0.22273 2.8656  0.005 **
Residual  10   769.49 0.77727
Total     11   990.00 1.00000
As seen in the C12 samples, there is significant separation in the metabolite profiles at high and ambient temperature. Tempreature accounts for 22% of the variance with 77% residual variance and is similar in values for C12 samples above. Treatment separates on PC1 in both analyses at similar variance explained (34% for C12 and 31% for C13 samples).
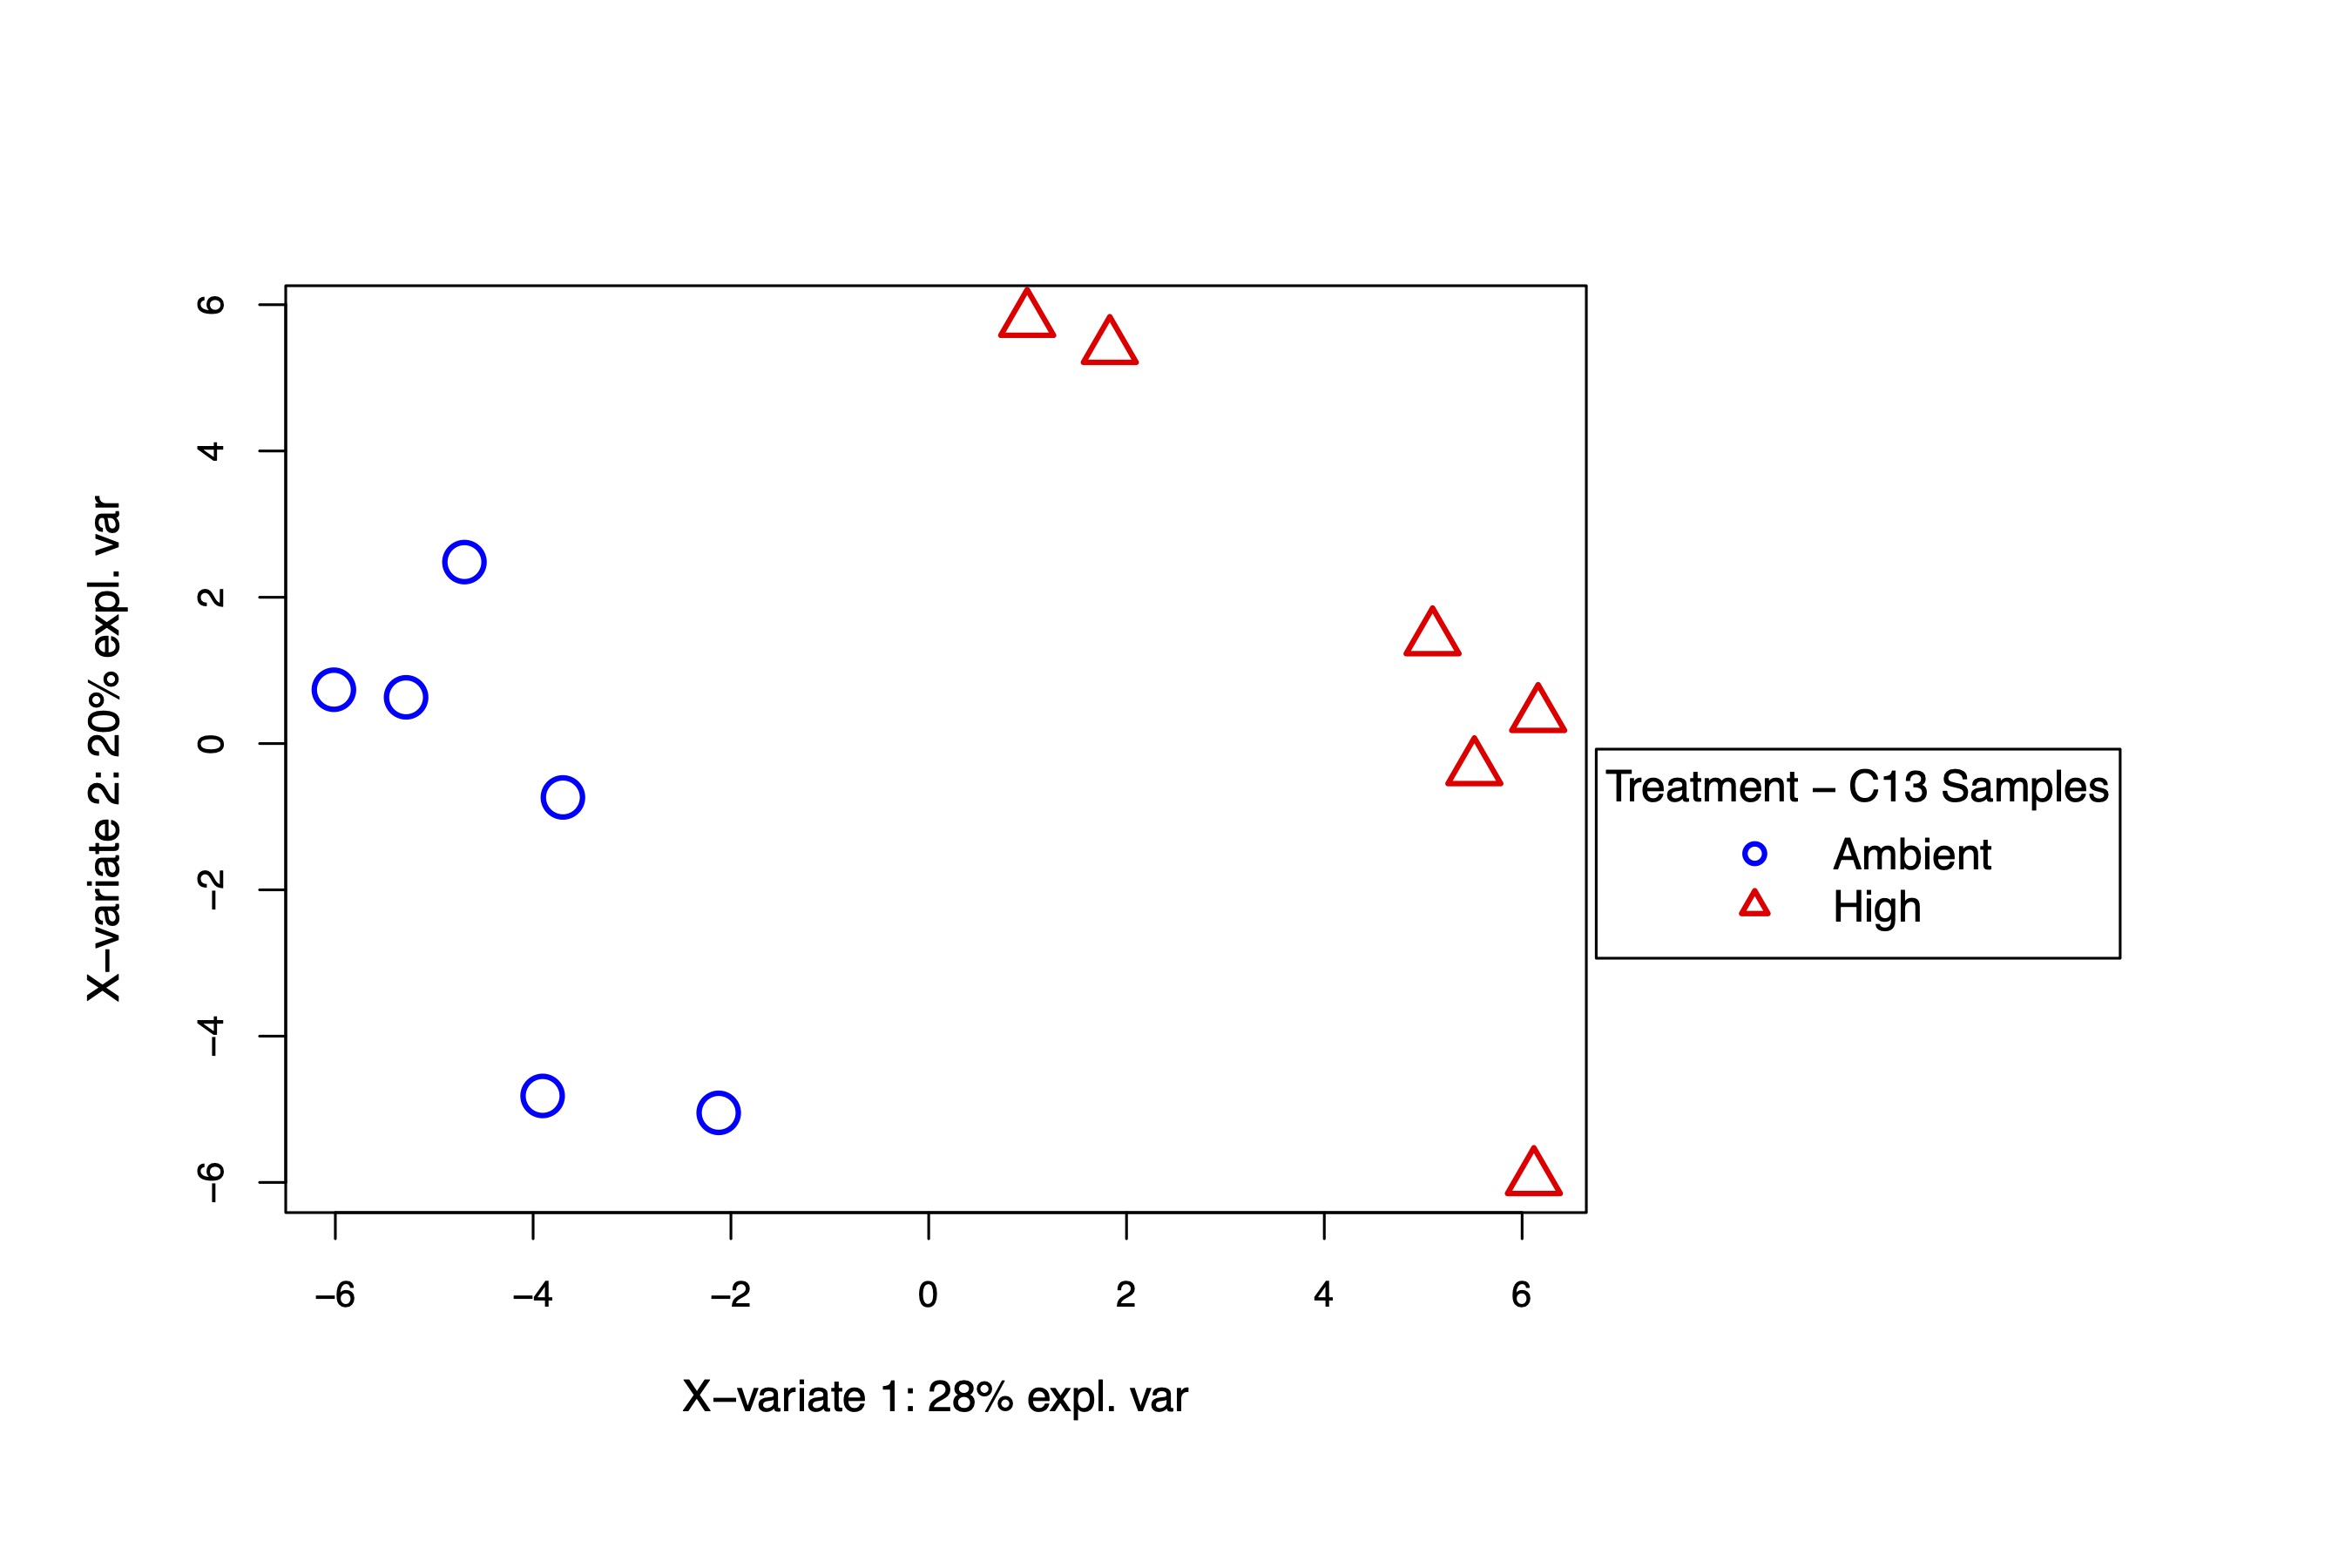
The PLS-DA analysis also shows separation in temperature treatments at similar variance explained (32% in C12 and 28% in C13 samples). Variance within samples (PC2) was approximately 15-20% in both sample sets. We have similar results between isotope types, confirming the effect of temperature on metabolomic profiles.
Next, I looked at the VIP metabolites between treatments in the C13 samples. These are the results that we will focus on for our primary analysis and relate to labeling data.
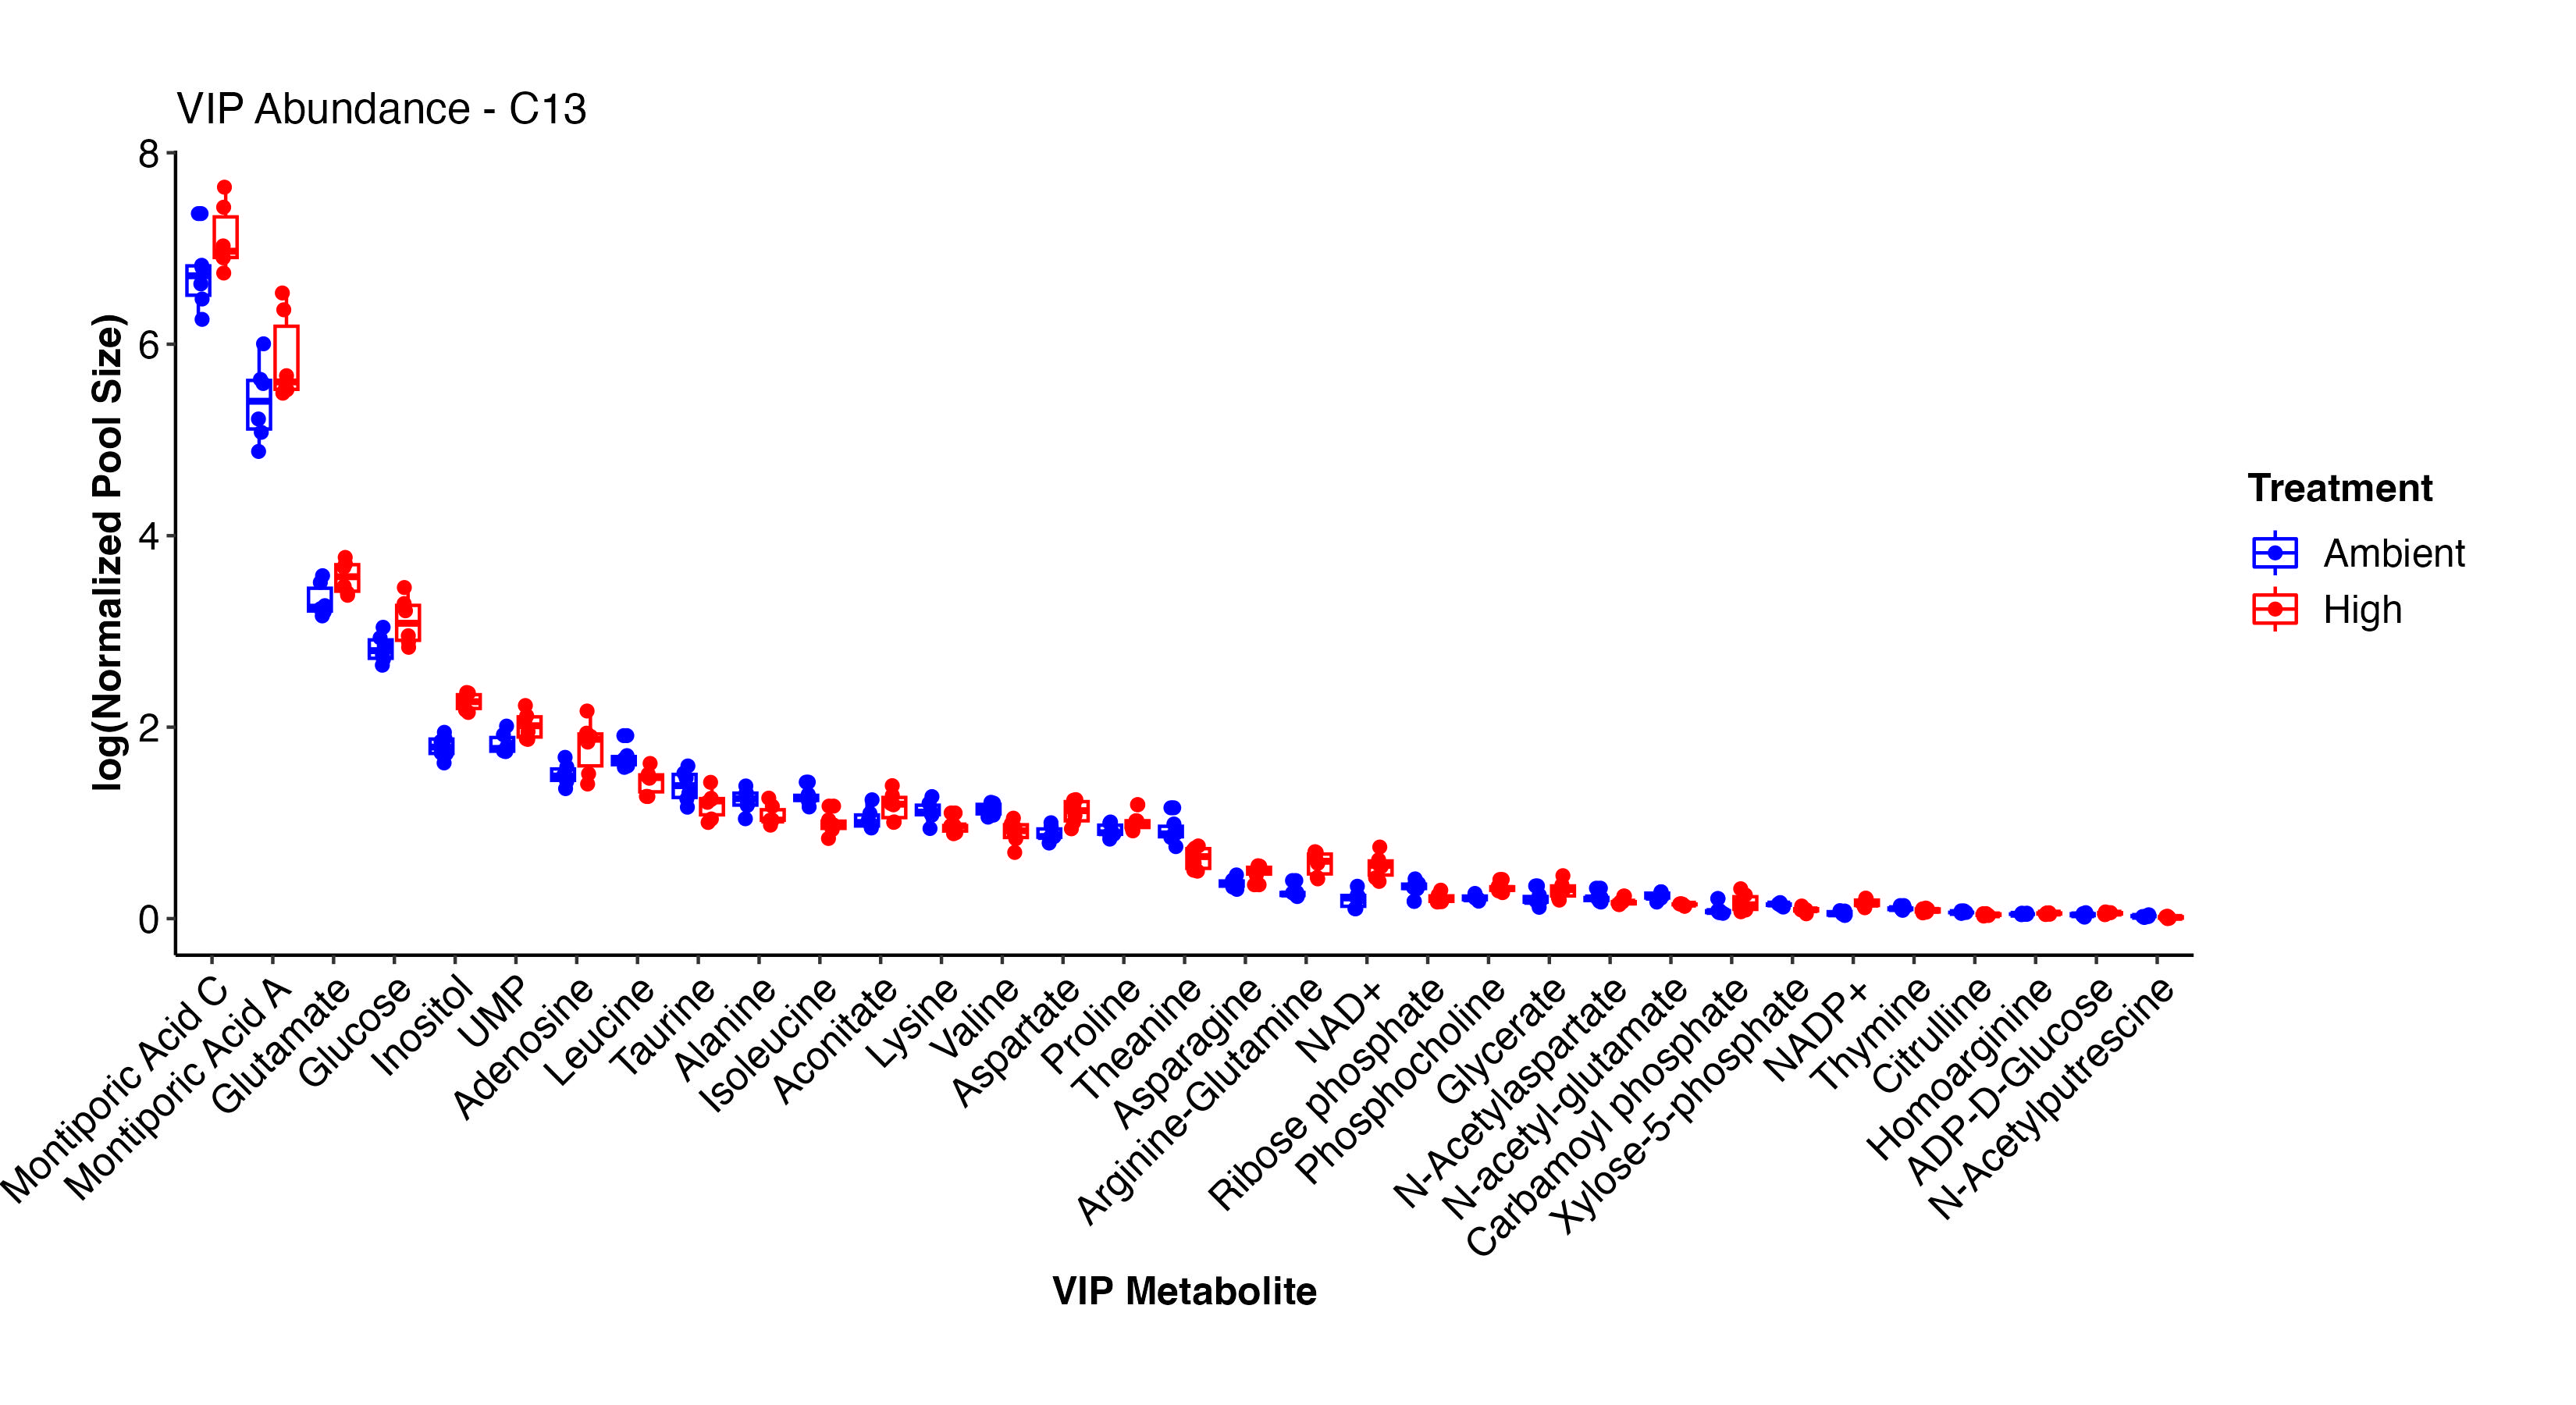
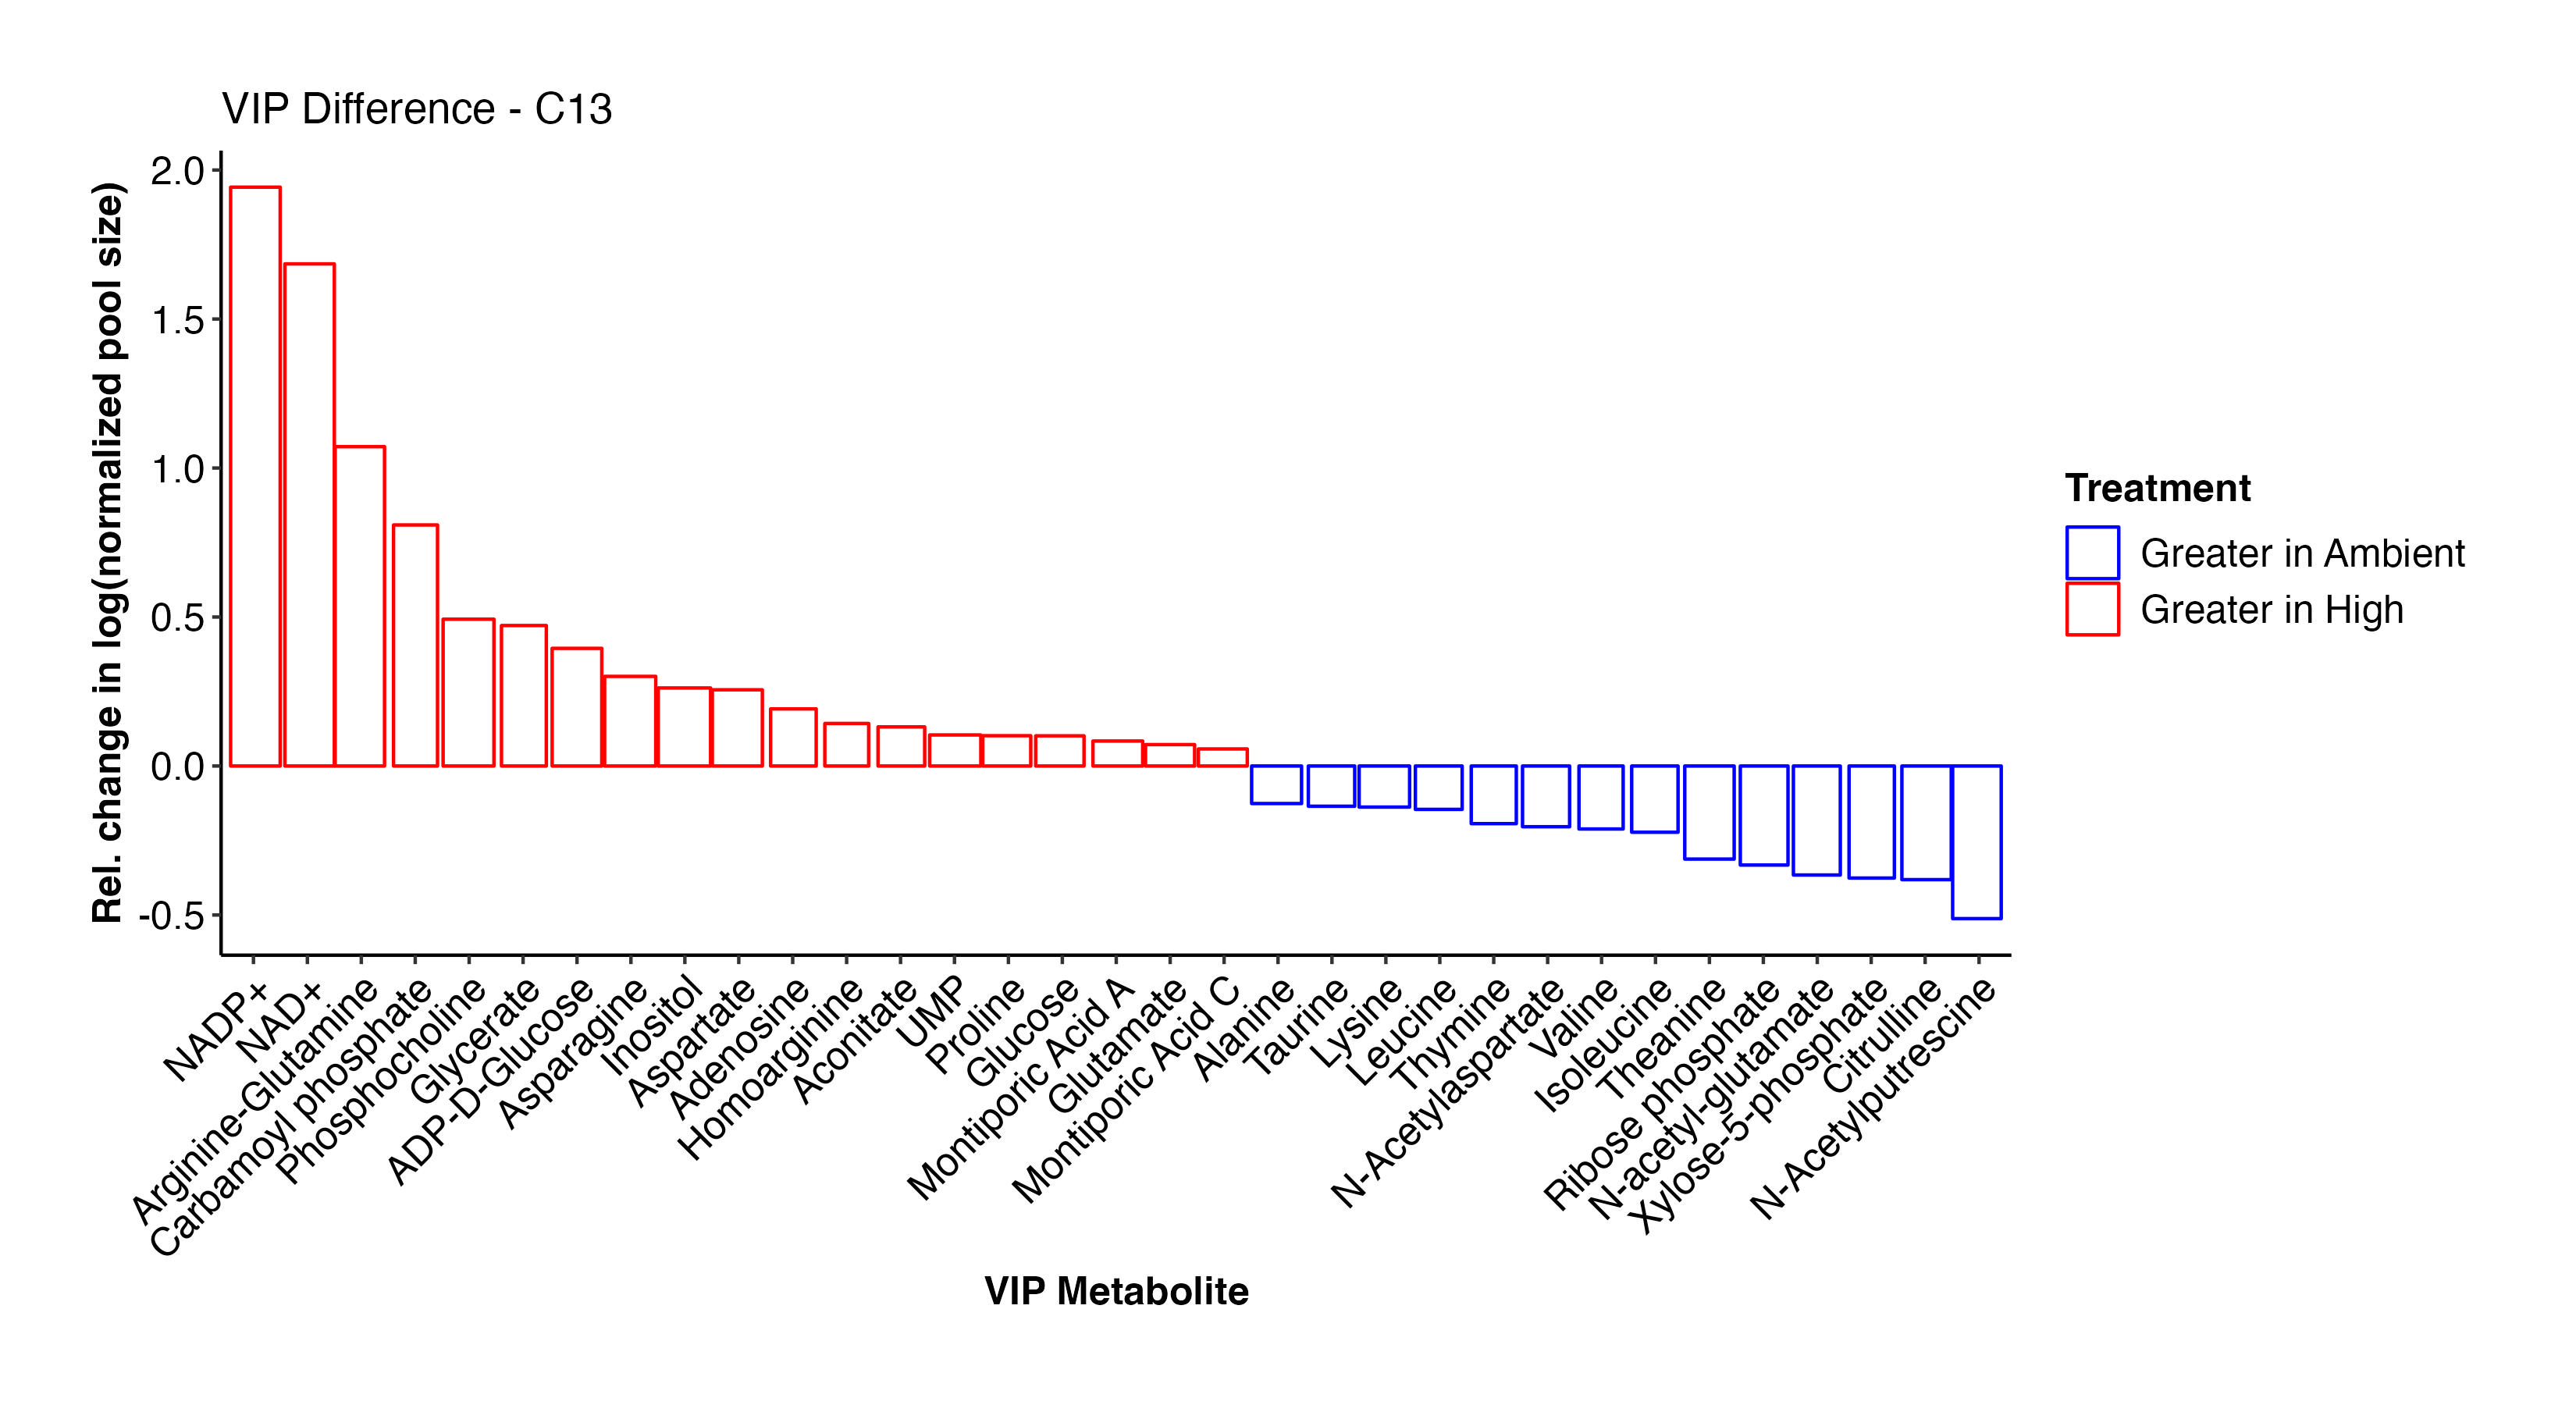
These two plots show the abundance and relative abundance of metabolites between temperature treatments in the C13 samples.
In the C13 samples, NAD+/NADP+, arginine-glutamine, glutamate, glucose, carbamoyl phosphate, glycerate, ADP-D-glucose, inositol, aspartate, aconitate, UMP, glucose, and Montiporic acids A and C were more abundant at high temperature. This list confirms what we saw in the C12 samples and further confirms the validity and reliability of our labeled dataset. Amino acids, cintrulline, xylose-5-phosphate, and other metabolites were lower at high temperature. These point to disruptions in nitrogen and carbon metabolism that we will further explore.
Pathway enrichment in Metaboanalyst
For both C13 and C12 samples, I uploaded the list of metabolites that are VIP’s at high and ambient temperature to the Metaboanalyst web interface for enrichment analysis to view the pathways that are enriched in these treatments.
Overall, the enrichment analysis of both isotope types shows similar results and interesting metabolic shifts between temperature treatments.
In the C13 samples, the following pathways were enriched at high temperature (FDR p<0.05):
- Alanine, aspartate, and glutamate metabolism (nitrogen assimilation)
- Arginine biosynthesis (conversion of glutamate into ornithine and then arginine or from the synthesis of arginine from ornithine through enzyme activity)
- Nicotinate and nictotinamide metabolism (metabolism of metabolic coenzymes NAD/NADP)
- Aminoacyl-tRNA biosynthesis (protein synthesis)
- Glyoxylate and dicarboxylate metabolism (production of glucose from fatty acids)
The enrichment of glyoxylate and dicarboxylate metabolism is particularly interesting and suggests that the larvae are utilizing more stored reserves for carbohydrate metabolism than translocatd carbon. We can look at this pathway in more detail.
Alanine, aspartate, and glutamate metabolism and glyoxylate and dicarboxylate metabolism were also enriched in the C12 samples.
I also ran the list of metabolites that were enriched at ambient temperature in the C13 samples (FDR p<0.05):
- Aminoacyl-tRNA biosynthesis (protein synthesis)
- Valine, leucine, and isoleucine biosynthesis
These were also enriched in the C12 samples in addition to arginine biosynthesis. Overall, this shows that we have similar enrichment results between isotope treatments and that metabolite pool size differs between temperature treatments.
3. Is metabolite atom enrichment different between dark and light treatments?
In order to determine whether labeled carbon in metabolites was incorporated from translocated photosynthate products or from host incorporation of inorganic carbon. To do this, we will look at enrichment of metabolites in the light C13 (n=12) and the dark C13 treatments (n=4).
First, I looked at enrichment for each metabolite between the dark and light samples.
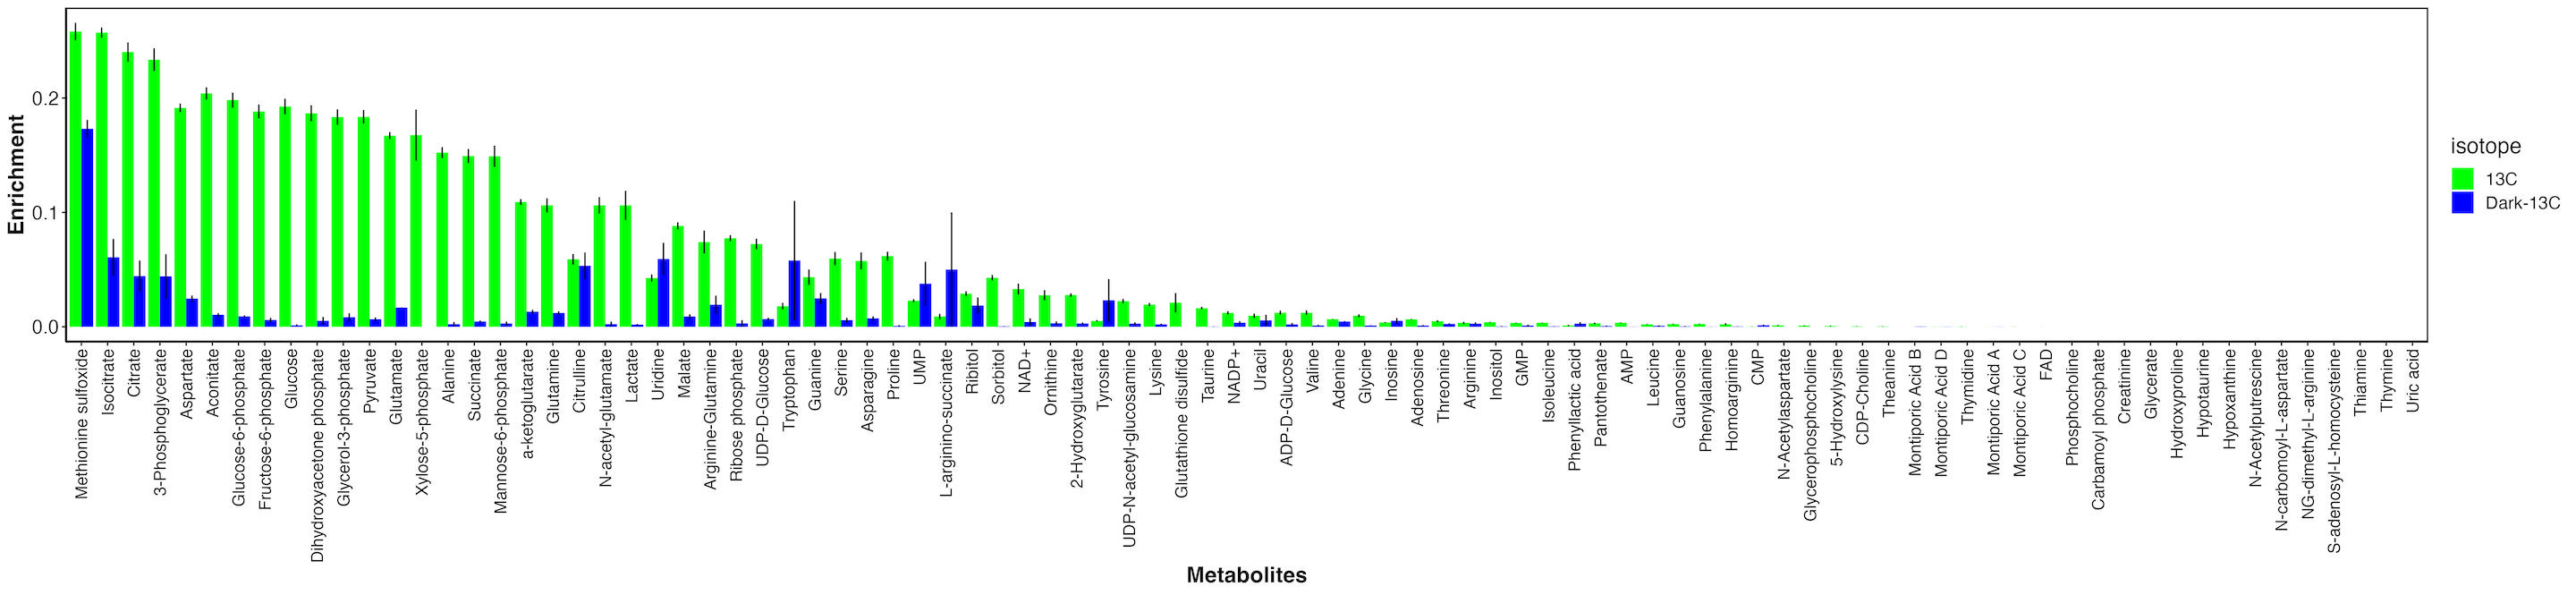
There are metabolties that have similar enrichment between dark and light samples and those that have much higher enrichment in the light. This indicates that metabolites with similar enrichment levels are due to host incorporation because they are enriched in the absence of photosynthesis. In contrast, metabolites that are only labeled in the light are those with carbon incorporated from fixed carbon from the symbiont.
It is important to note that even for metabolites that are highly enriched in light as compared to dark, there is some residual enrichment in the dark. This is because the samples were not dark adapted prior to adding the label and therefore the small labeling is due to residual photosynthetic and metabolic activity at the start of the incubation. This is expected.
I then isolated the metabolites that we expect to have carbon from photosynthesis.
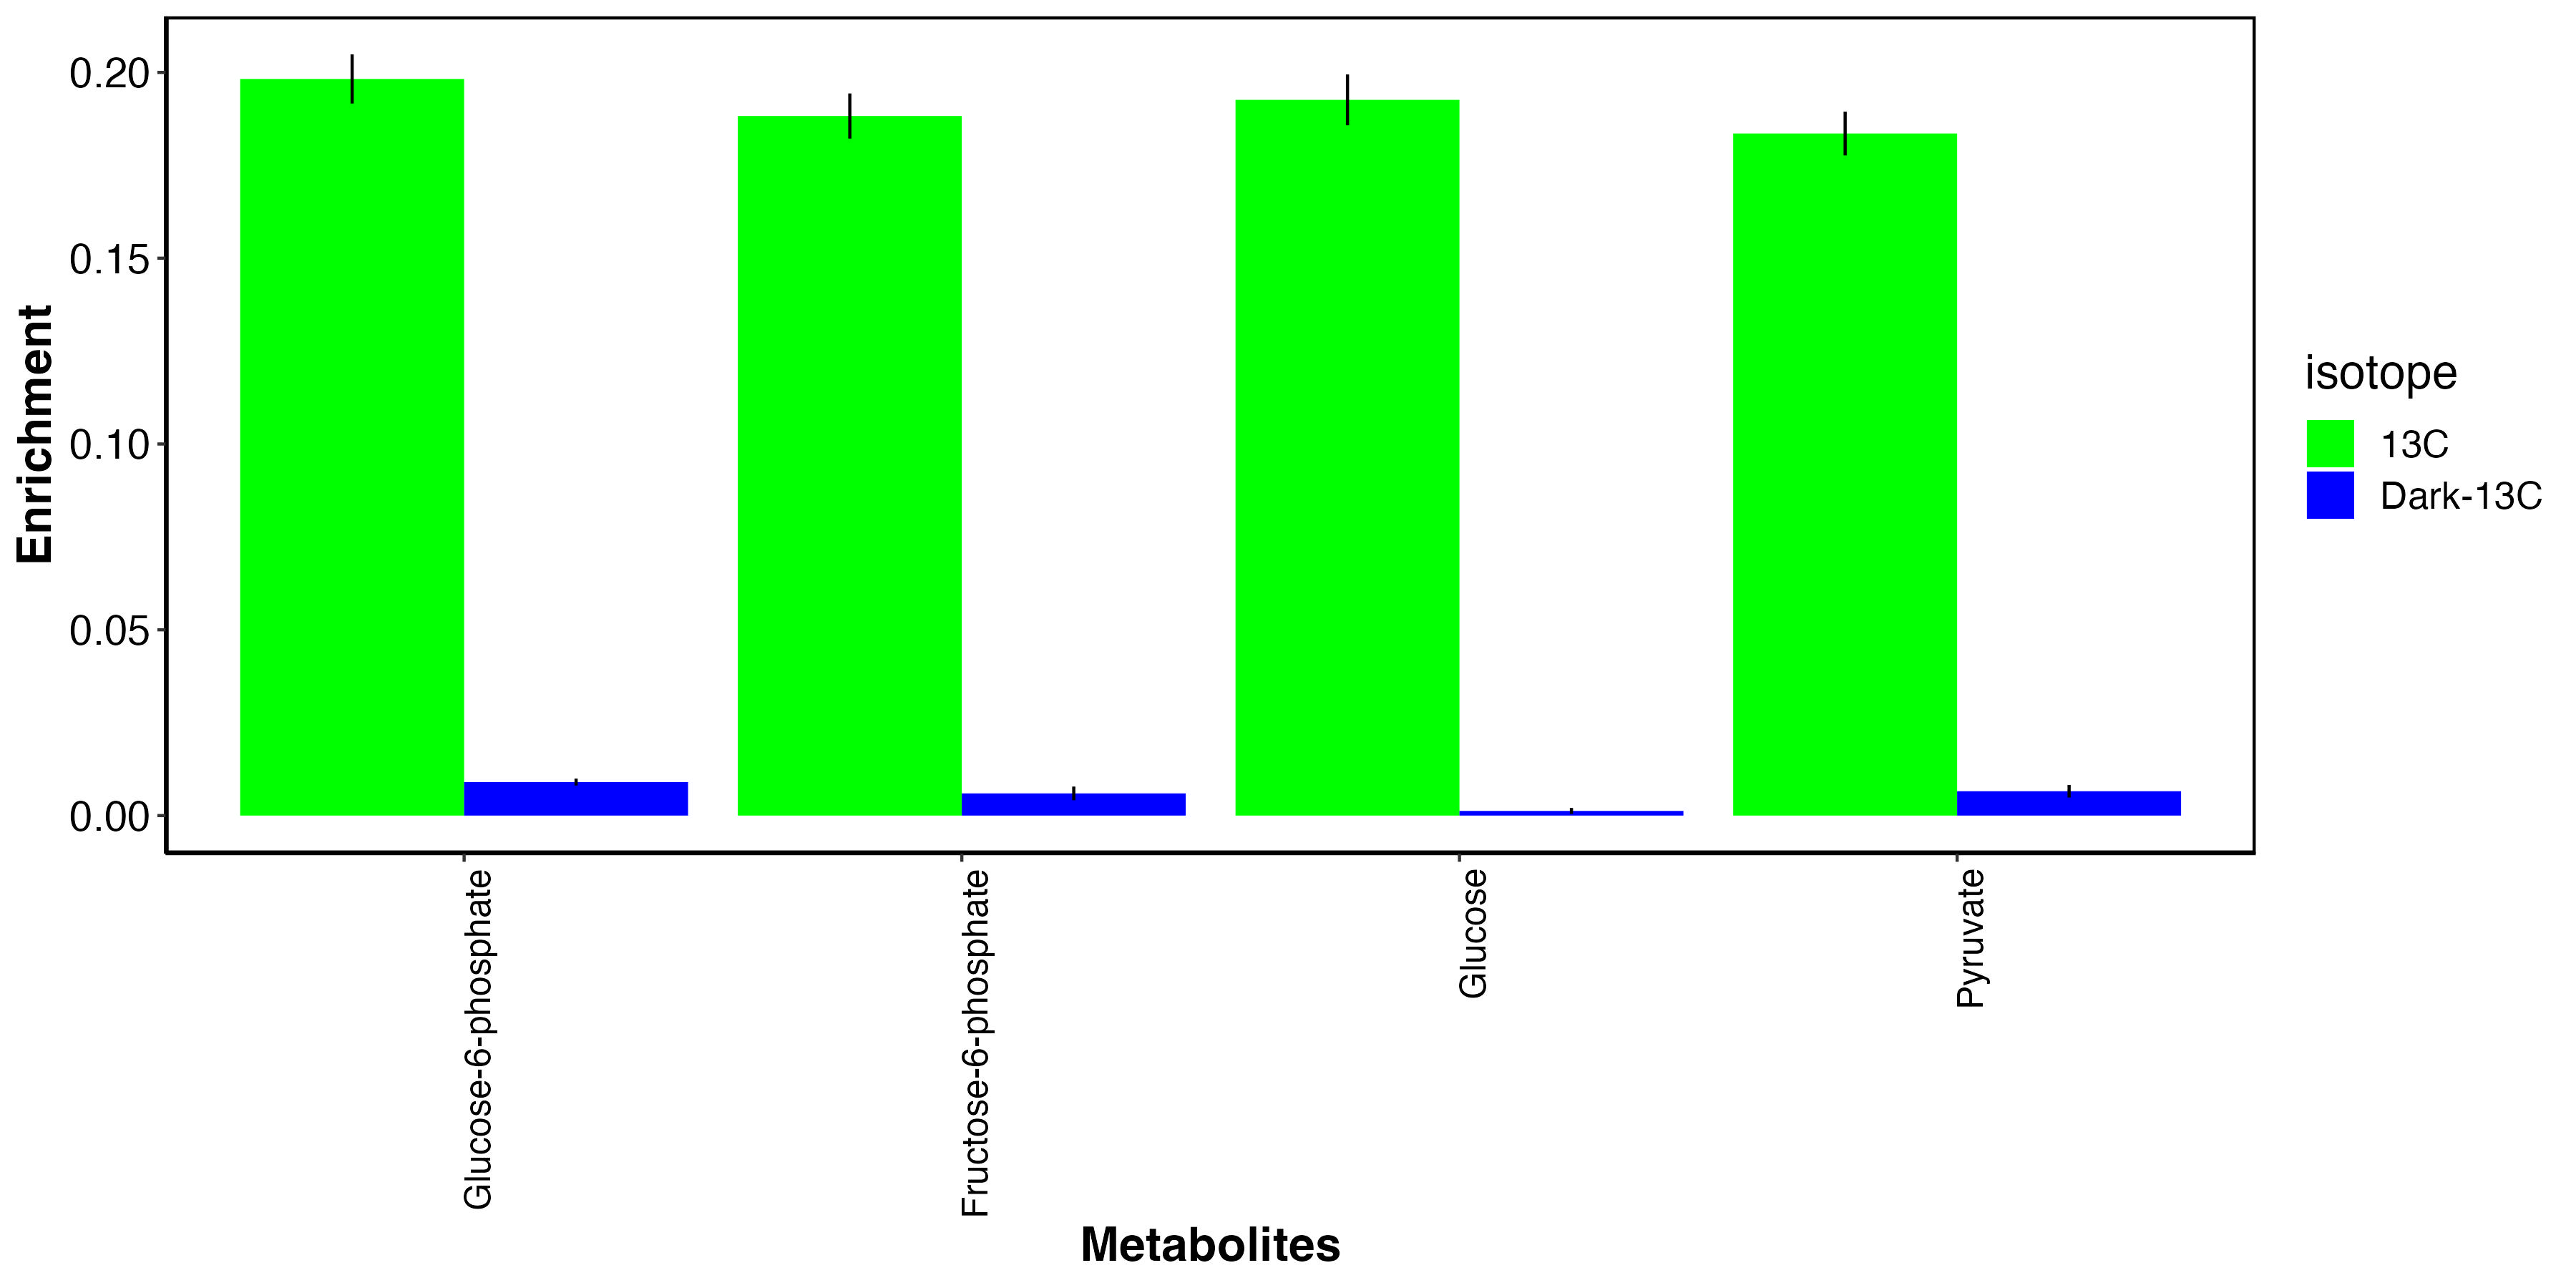
This plot shows that, as expected, glucose photosynthates and derivatives are highly labeled in the light and not in the dark. This indicates that fixed carbon in these metabolites is from photosynthate translocation to the host tissue.
I also looked at metabolites that had elevated enrichment in the dark.
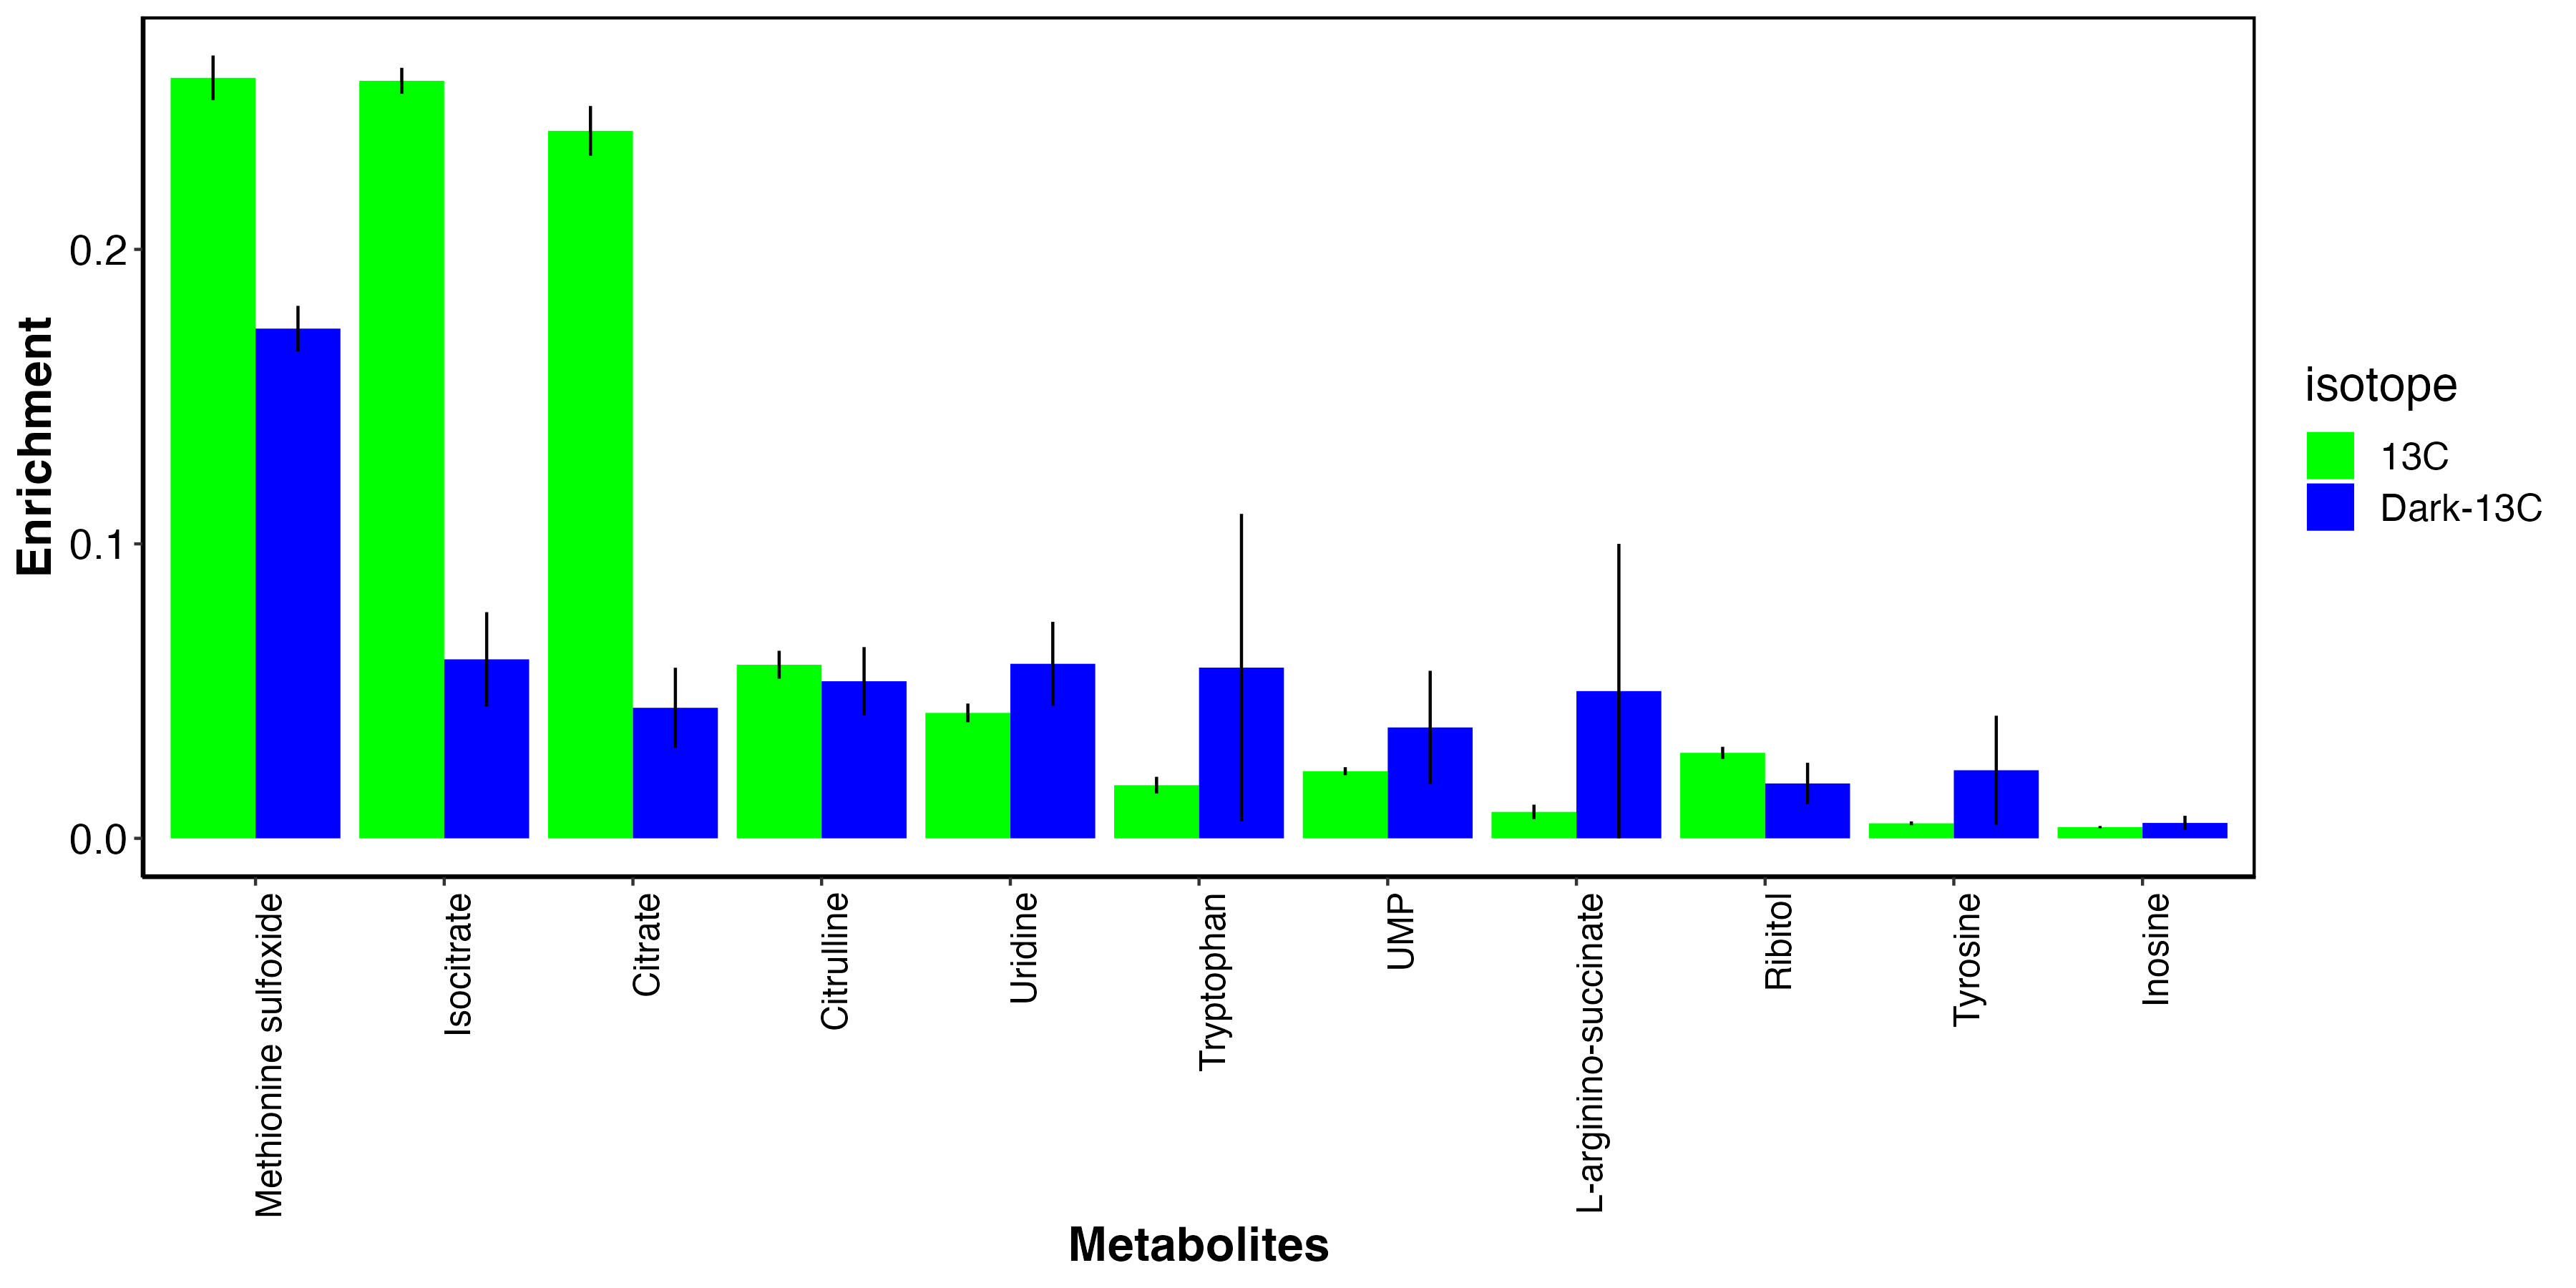
This shows that there may be some metabolites that incorporate carbon from host uptake of inorganic carbon. These include methionine sulfoxide, an antioxidant, as well as several amino acids and nitrogen metabolism intermediates.
We will use this information to look at differentially enriched metabolites and hypothesize the origin of the carbon during biosynthesis in the context of our temperature treatments and symbiotic relationship.
4. Is metabolite atom enrichment different between temperature treatments?
I next analyzed metabolite enrichment between treatments, which is the likelihood that a particular carbon within a metabolite will be labeled. This is expressed as a proportion. A higher enrichment value indicates higher label incorporation on a per-atom basis. Below, I will analyze the proportion of metabolites that have a labeled carbon and we expect similar results between the two data types.
PCA
As done above, I started with a PCA analysis to visualize differences. Here, our data are still in multivariate format in the form of a matrix with enrichment values for each of 90 metabolites for each sample.
Enrichment values are approx. an order of magnitude higher in the C13 samples than the C12 and C13 dark samples as expected. We are only analyzing C13 samples in this analysis.
  isotope     mean
  <fct>      <dbl>
1 12C      0.00301
2 13C      0.0535
3 Dark-13C 0.00976
A PCA and PERMANOVA analysis shows that enrichment significantly varies between treatments.
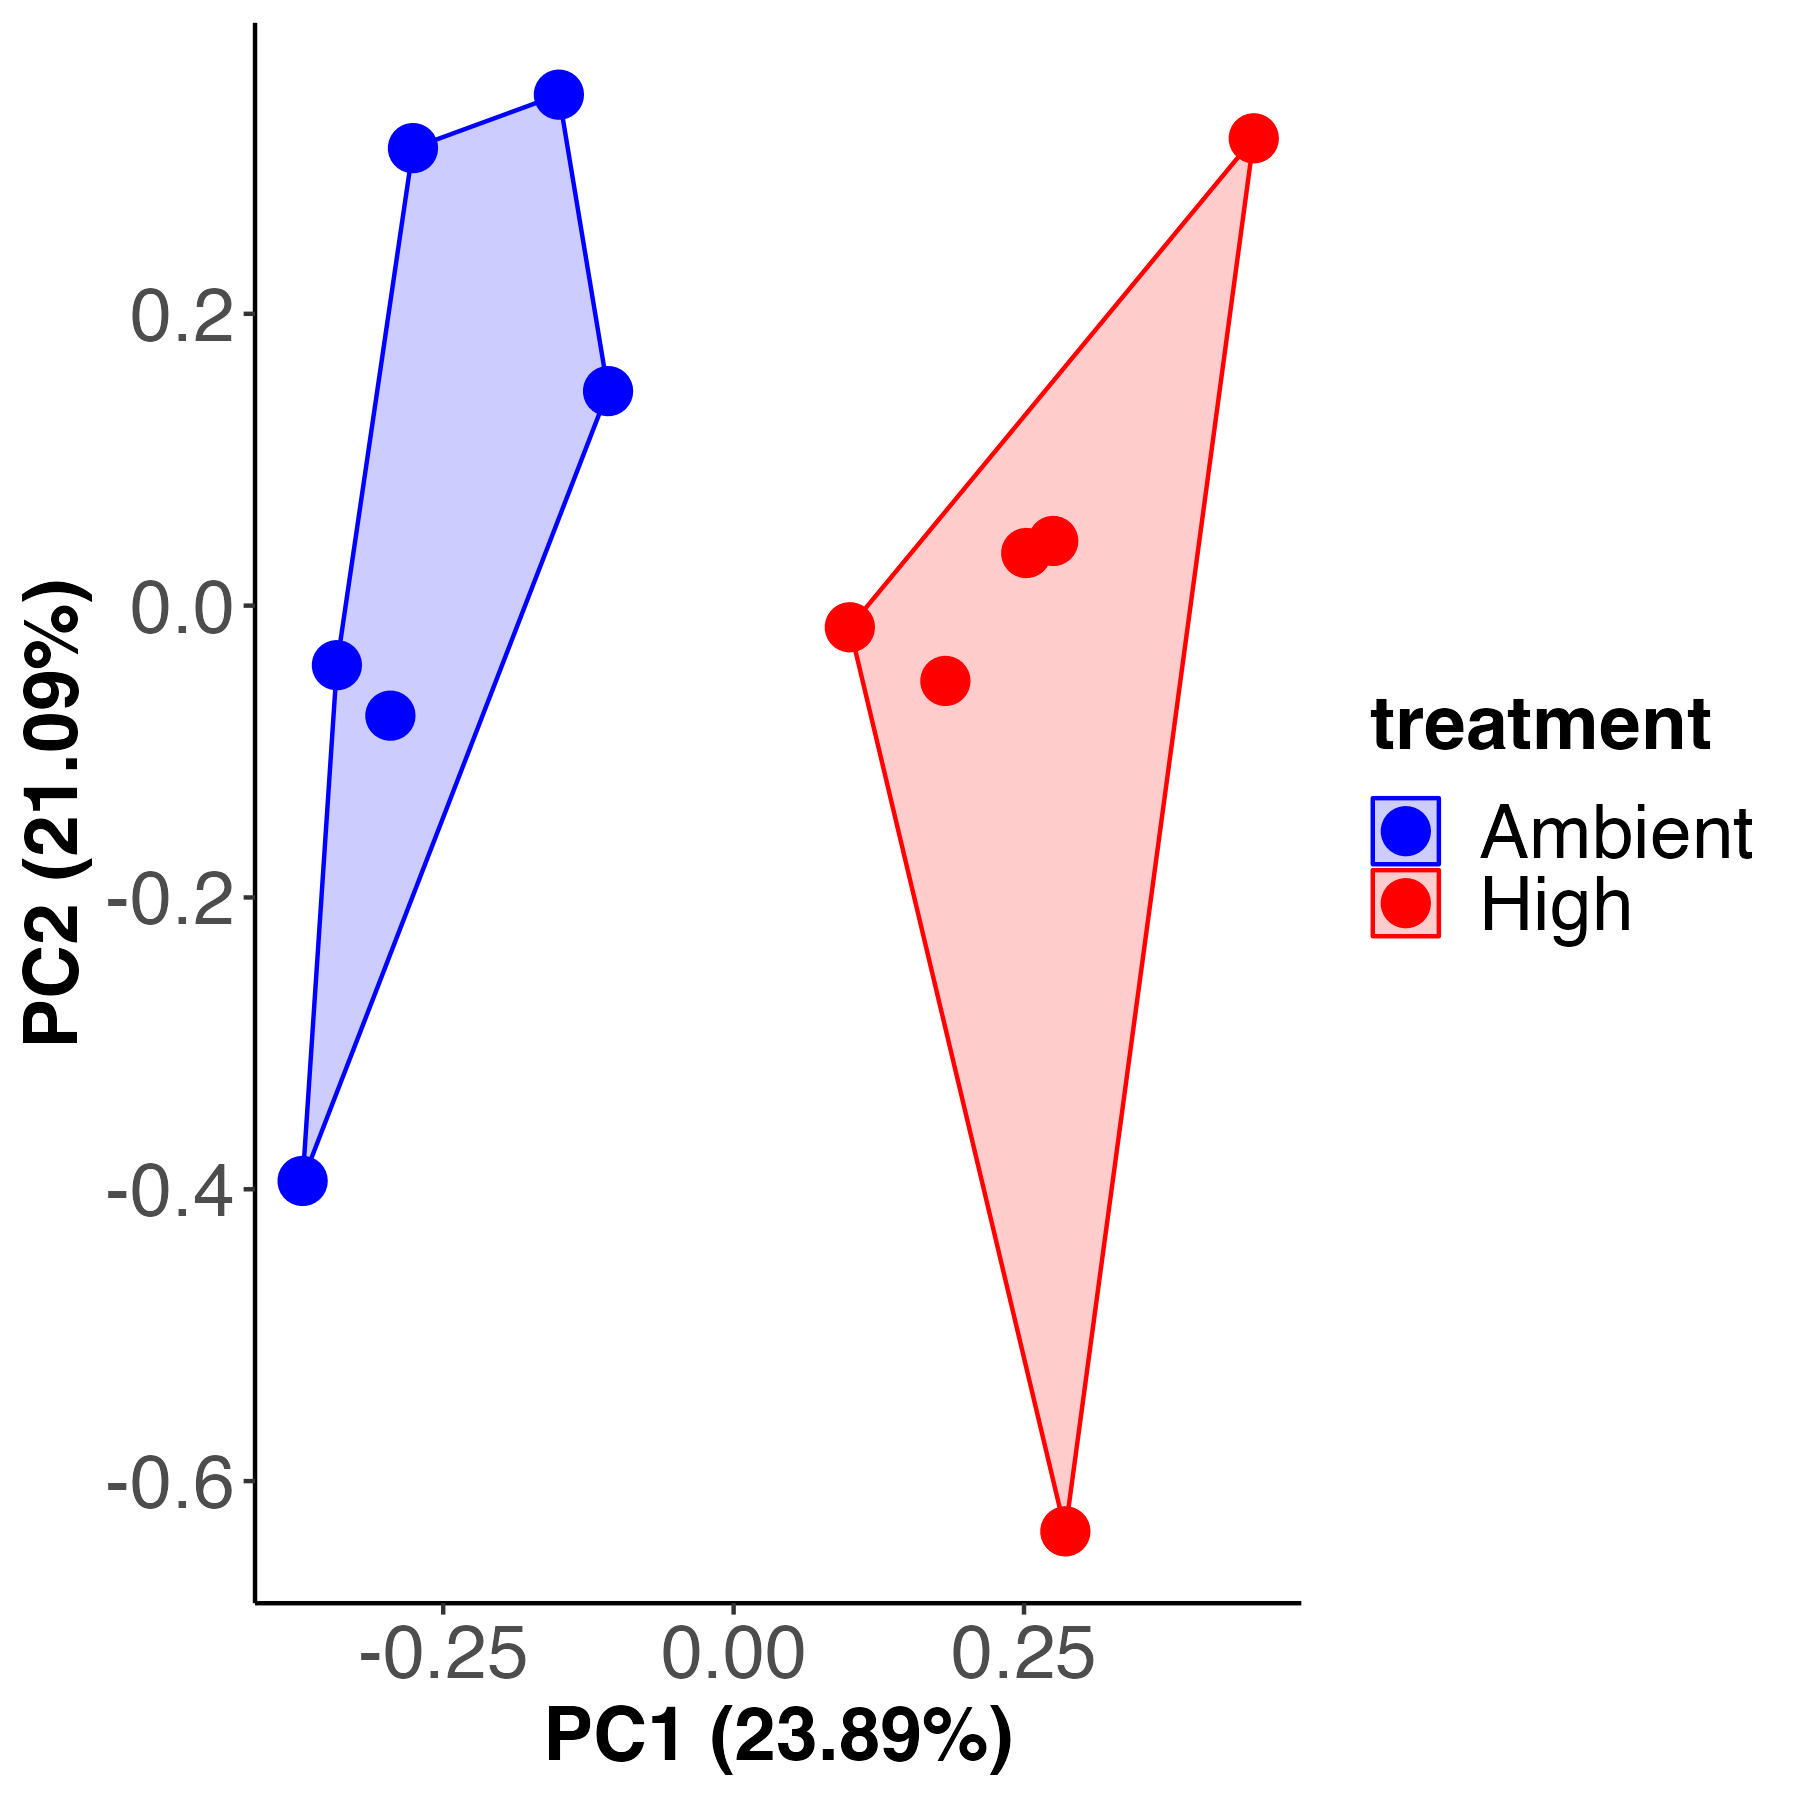
Permutation test for adonis under reduced model
Terms added sequentially (first to last)
Permutation: free
Number of permutations: 999

adonis2(formula = vegan ~ treatment, data = enrichment_pca_13C, method = "eu")
          Df SumOfSqs      R2      F Pr(>F)
treatment  1   193.45 0.22839 2.9599  0.005 **
Residual  10   653.55 0.77161
Total     11   847.00 1.00000
Treatment accounts for 22% of the variance with 77% residual variance. These values are the same as variance described by treatment for metabolite pool size above.
I then proceeded with a PLS-DA and VIP analysis in the same workflow as done above.
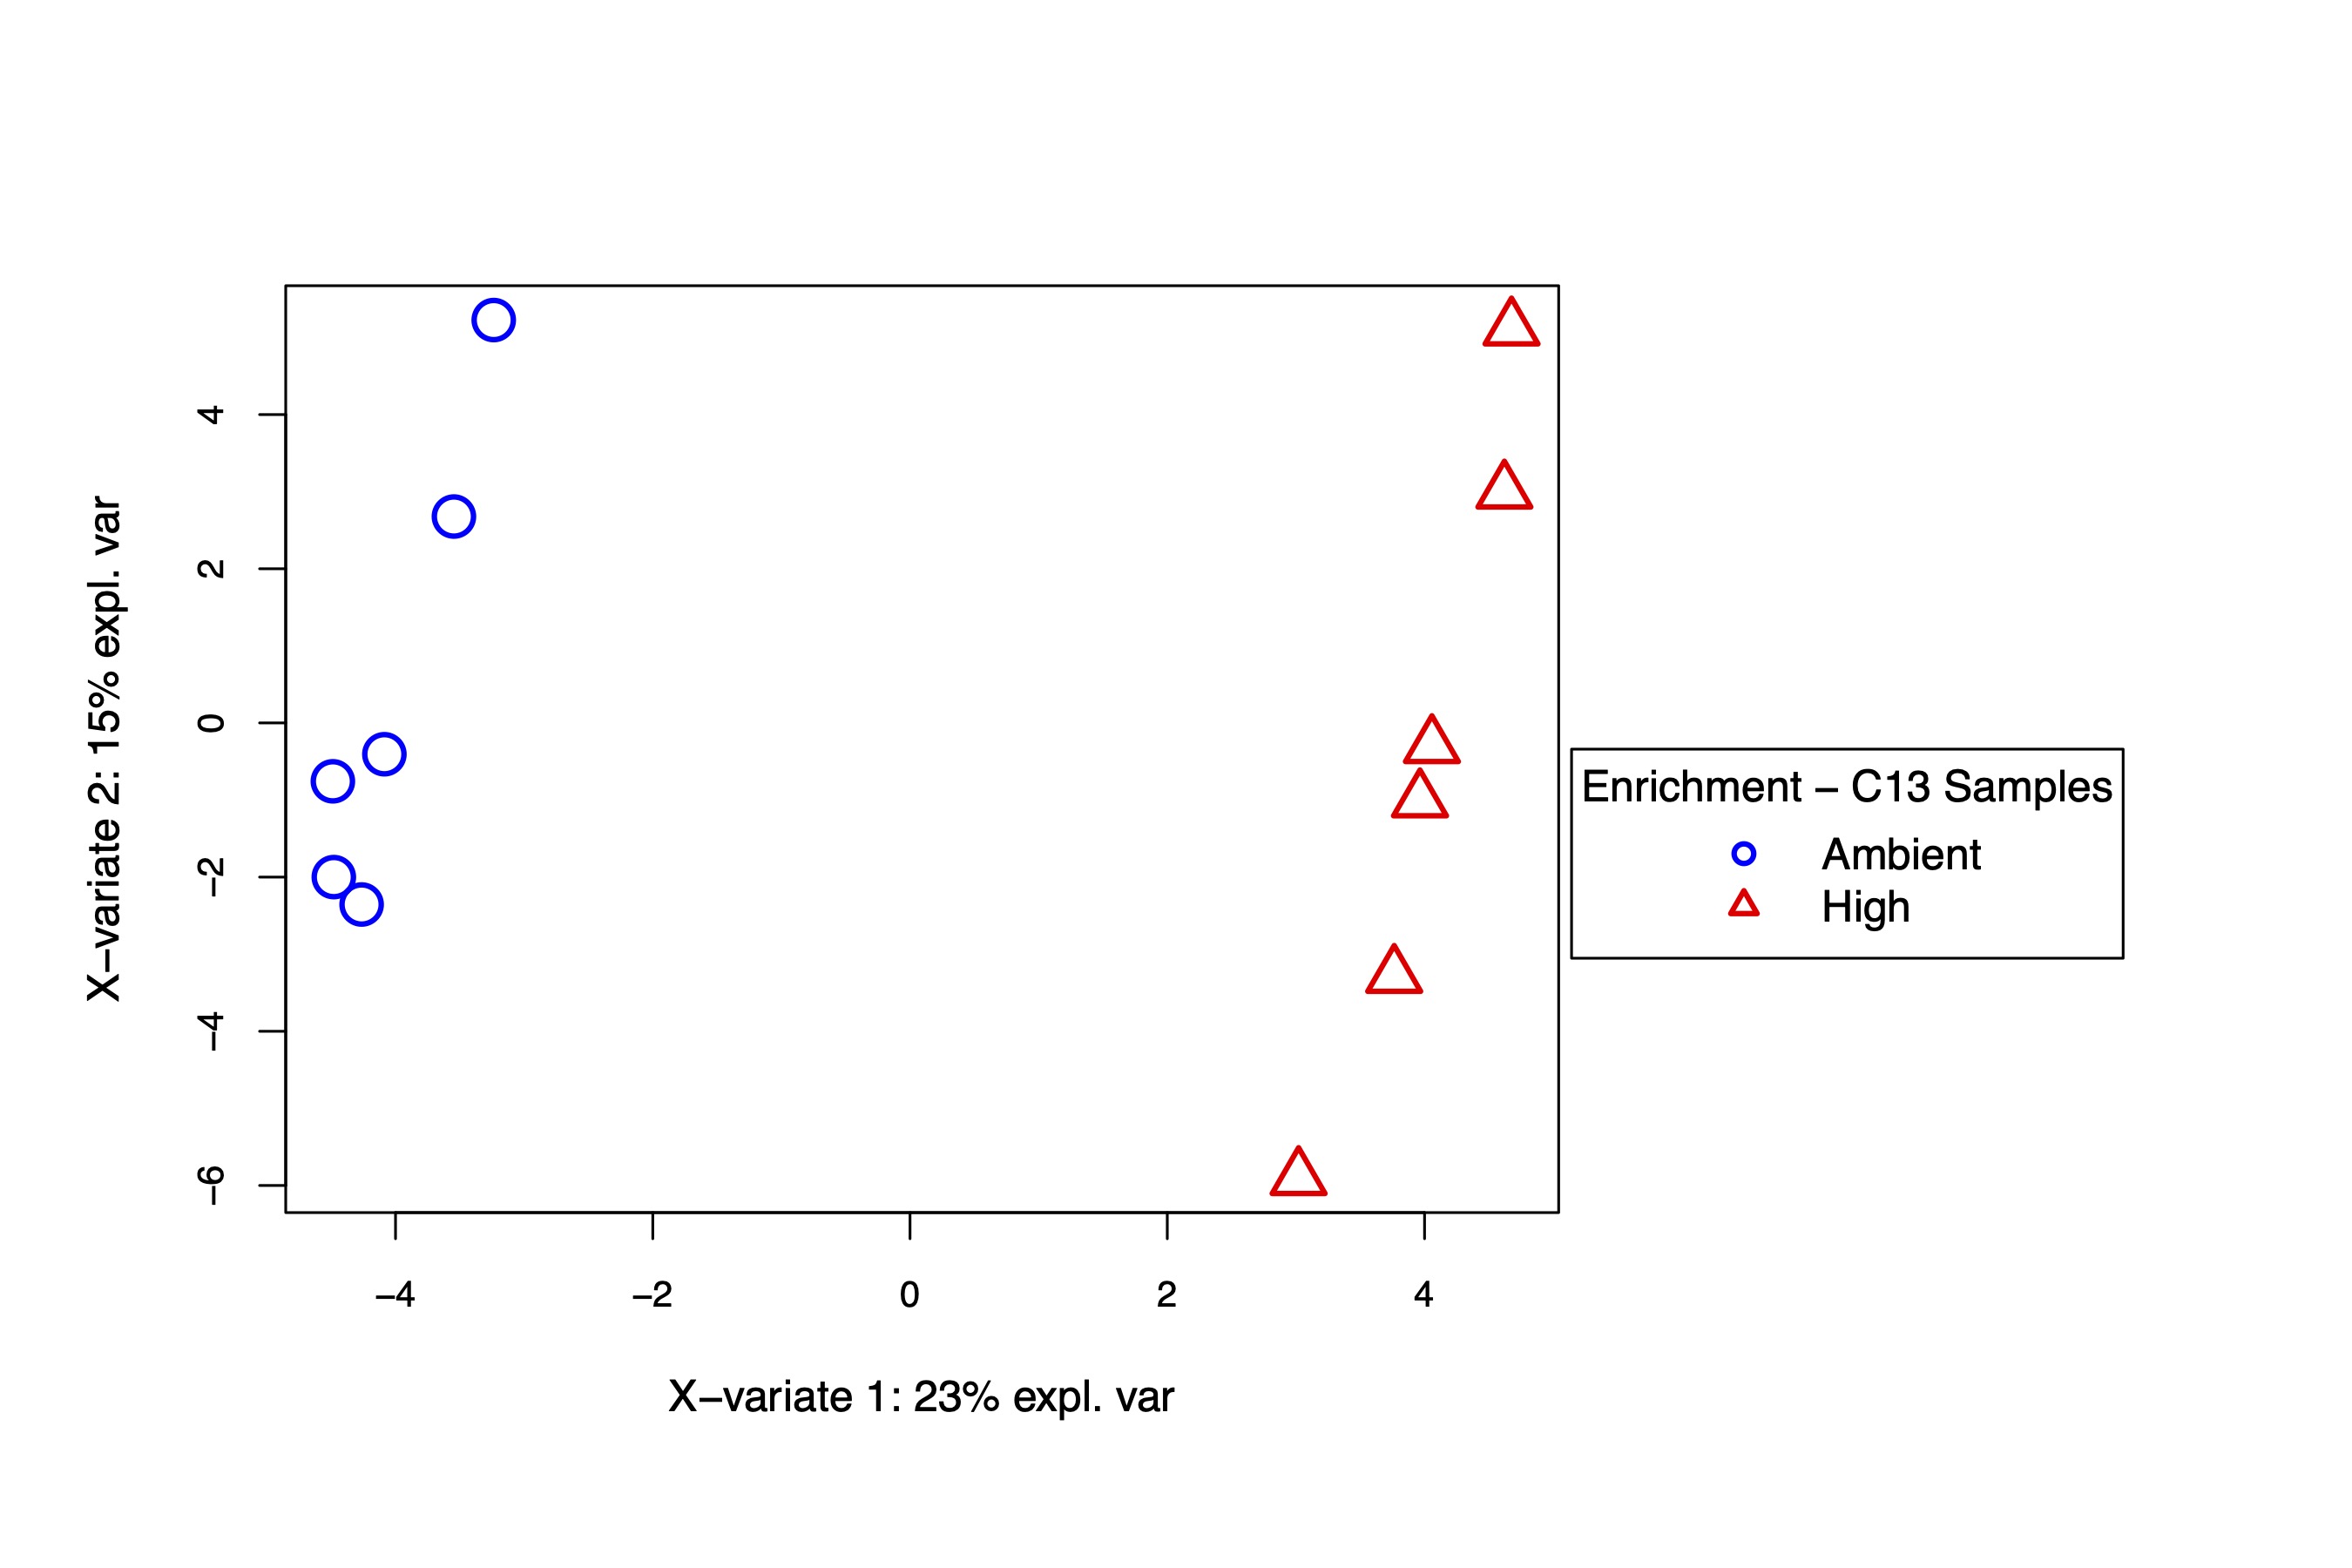
PLS-DA and VIP analysis
The PLS-DA visualization shows separation in metabolite enrichment between temperature treatments.
As done above, I then viewed the enrichment values for the VIP metabolites both as enrichment proportions and as relative difference between ambient and high temperature treatments.
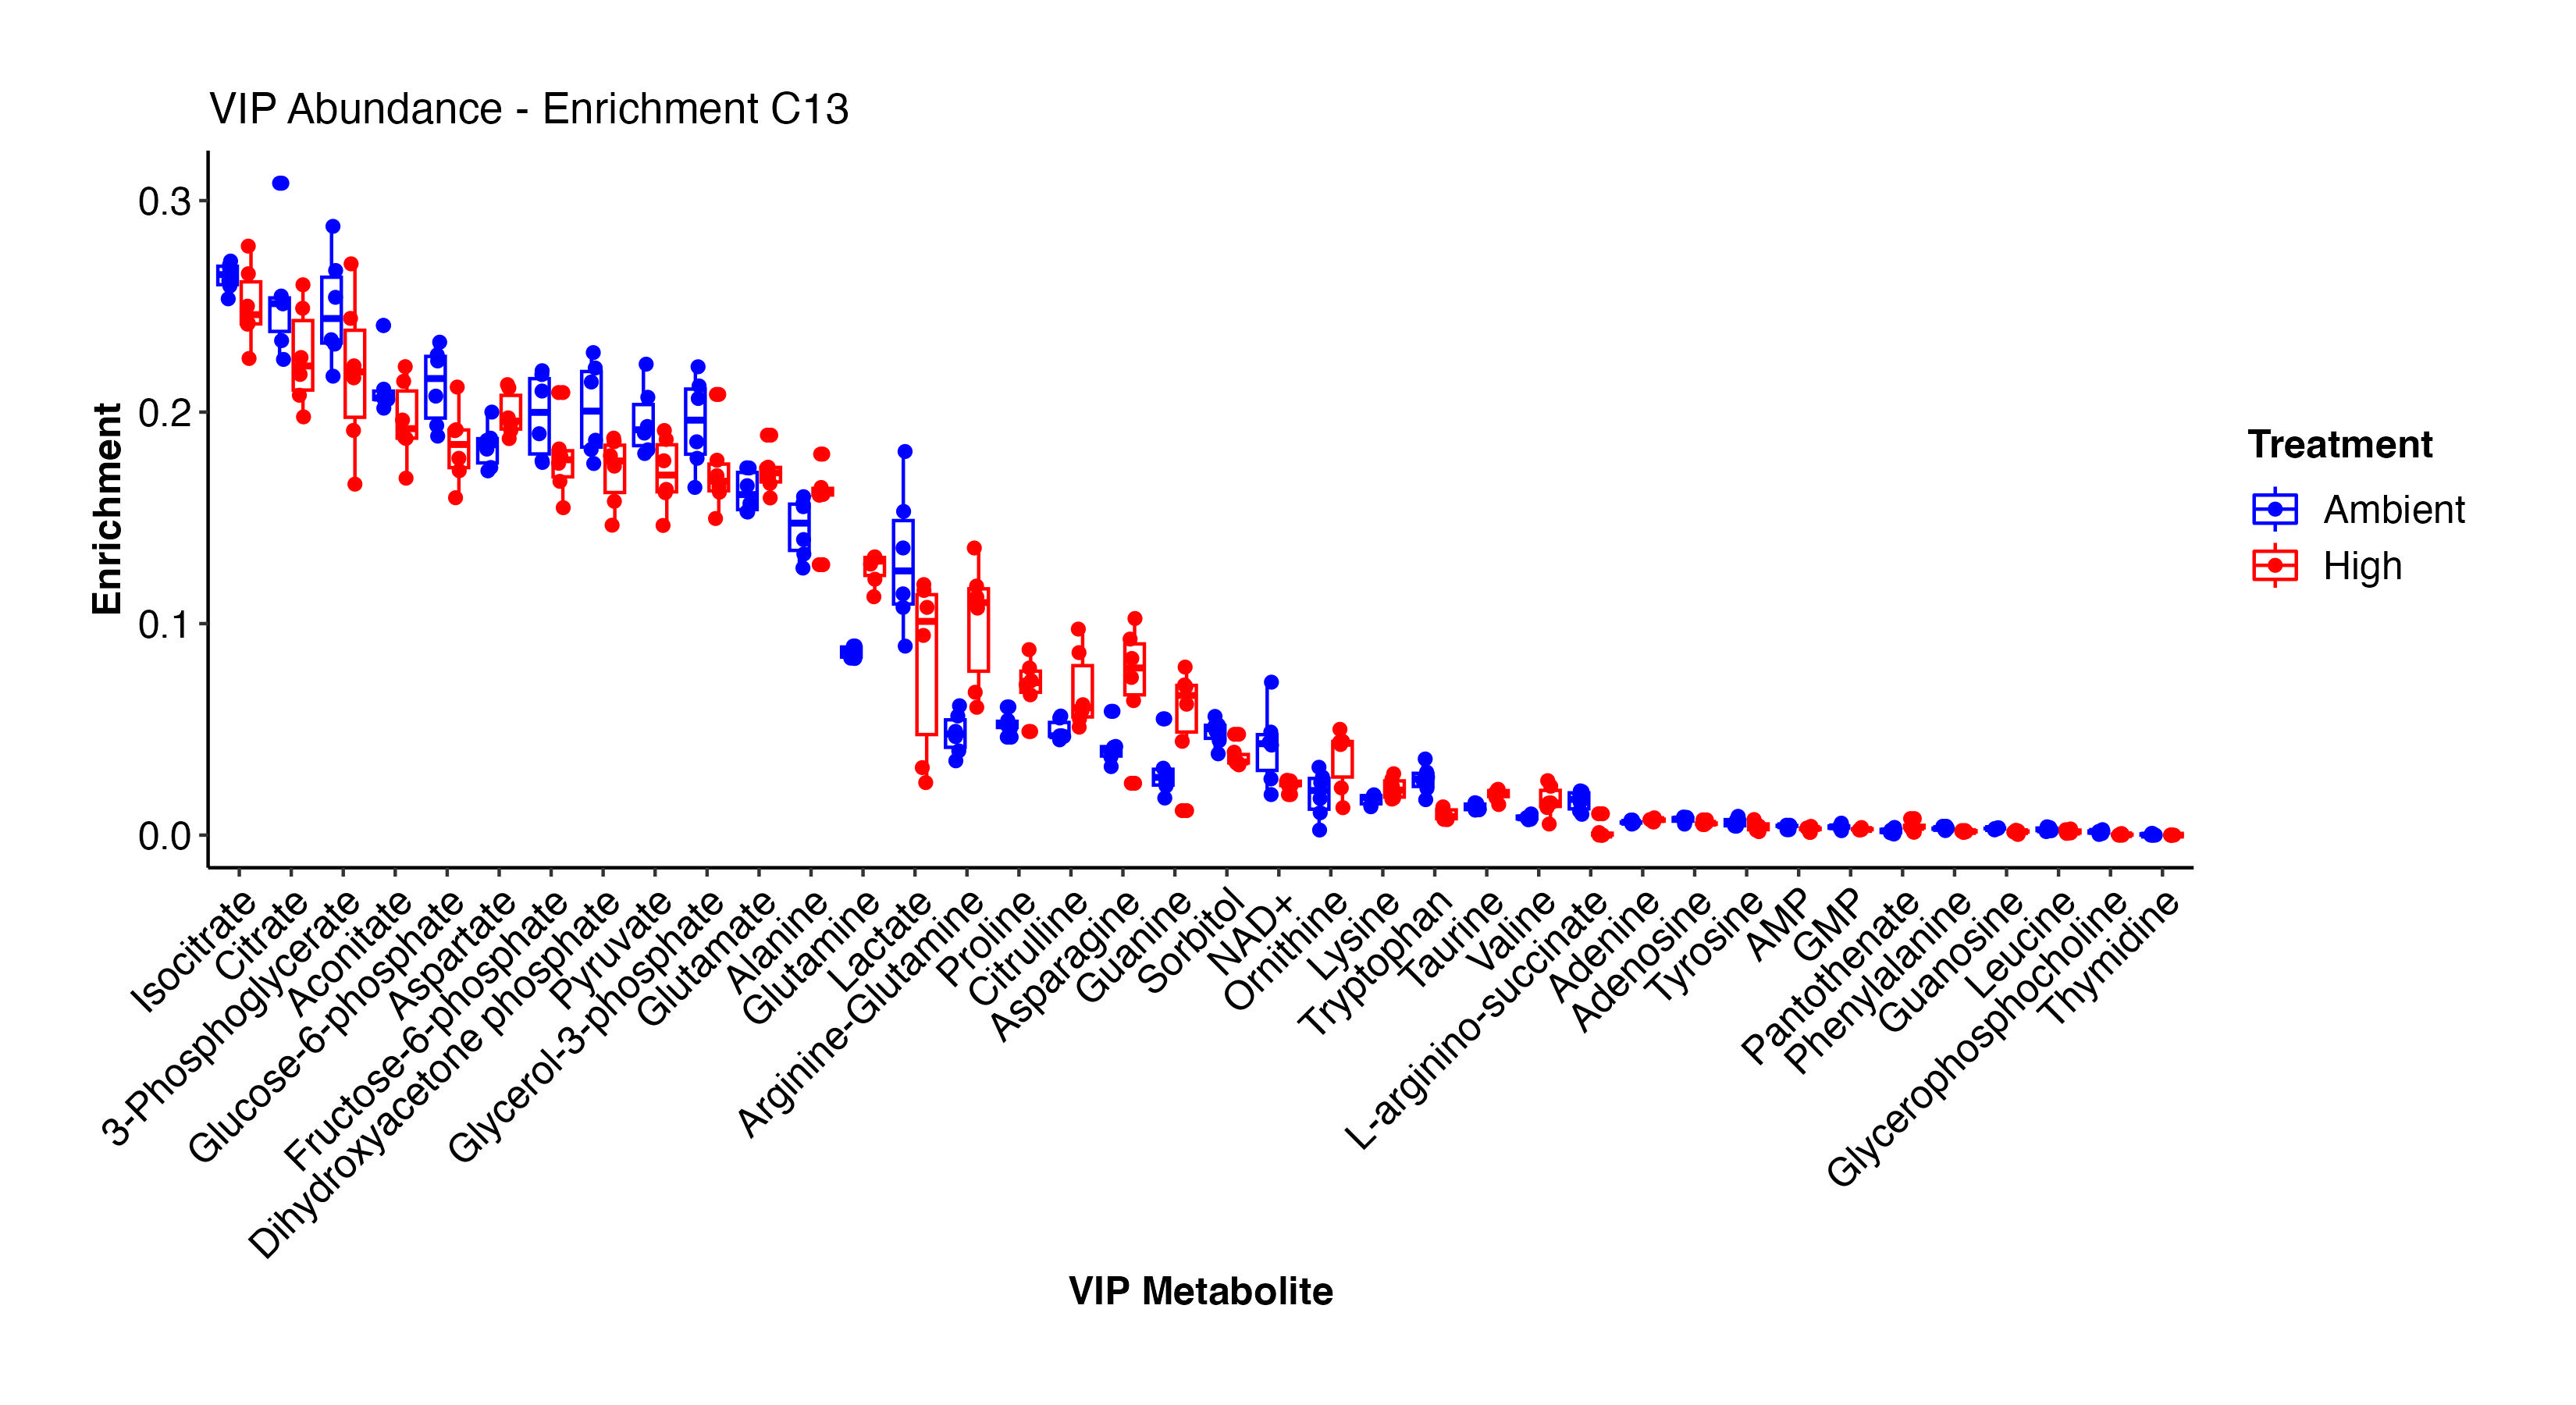
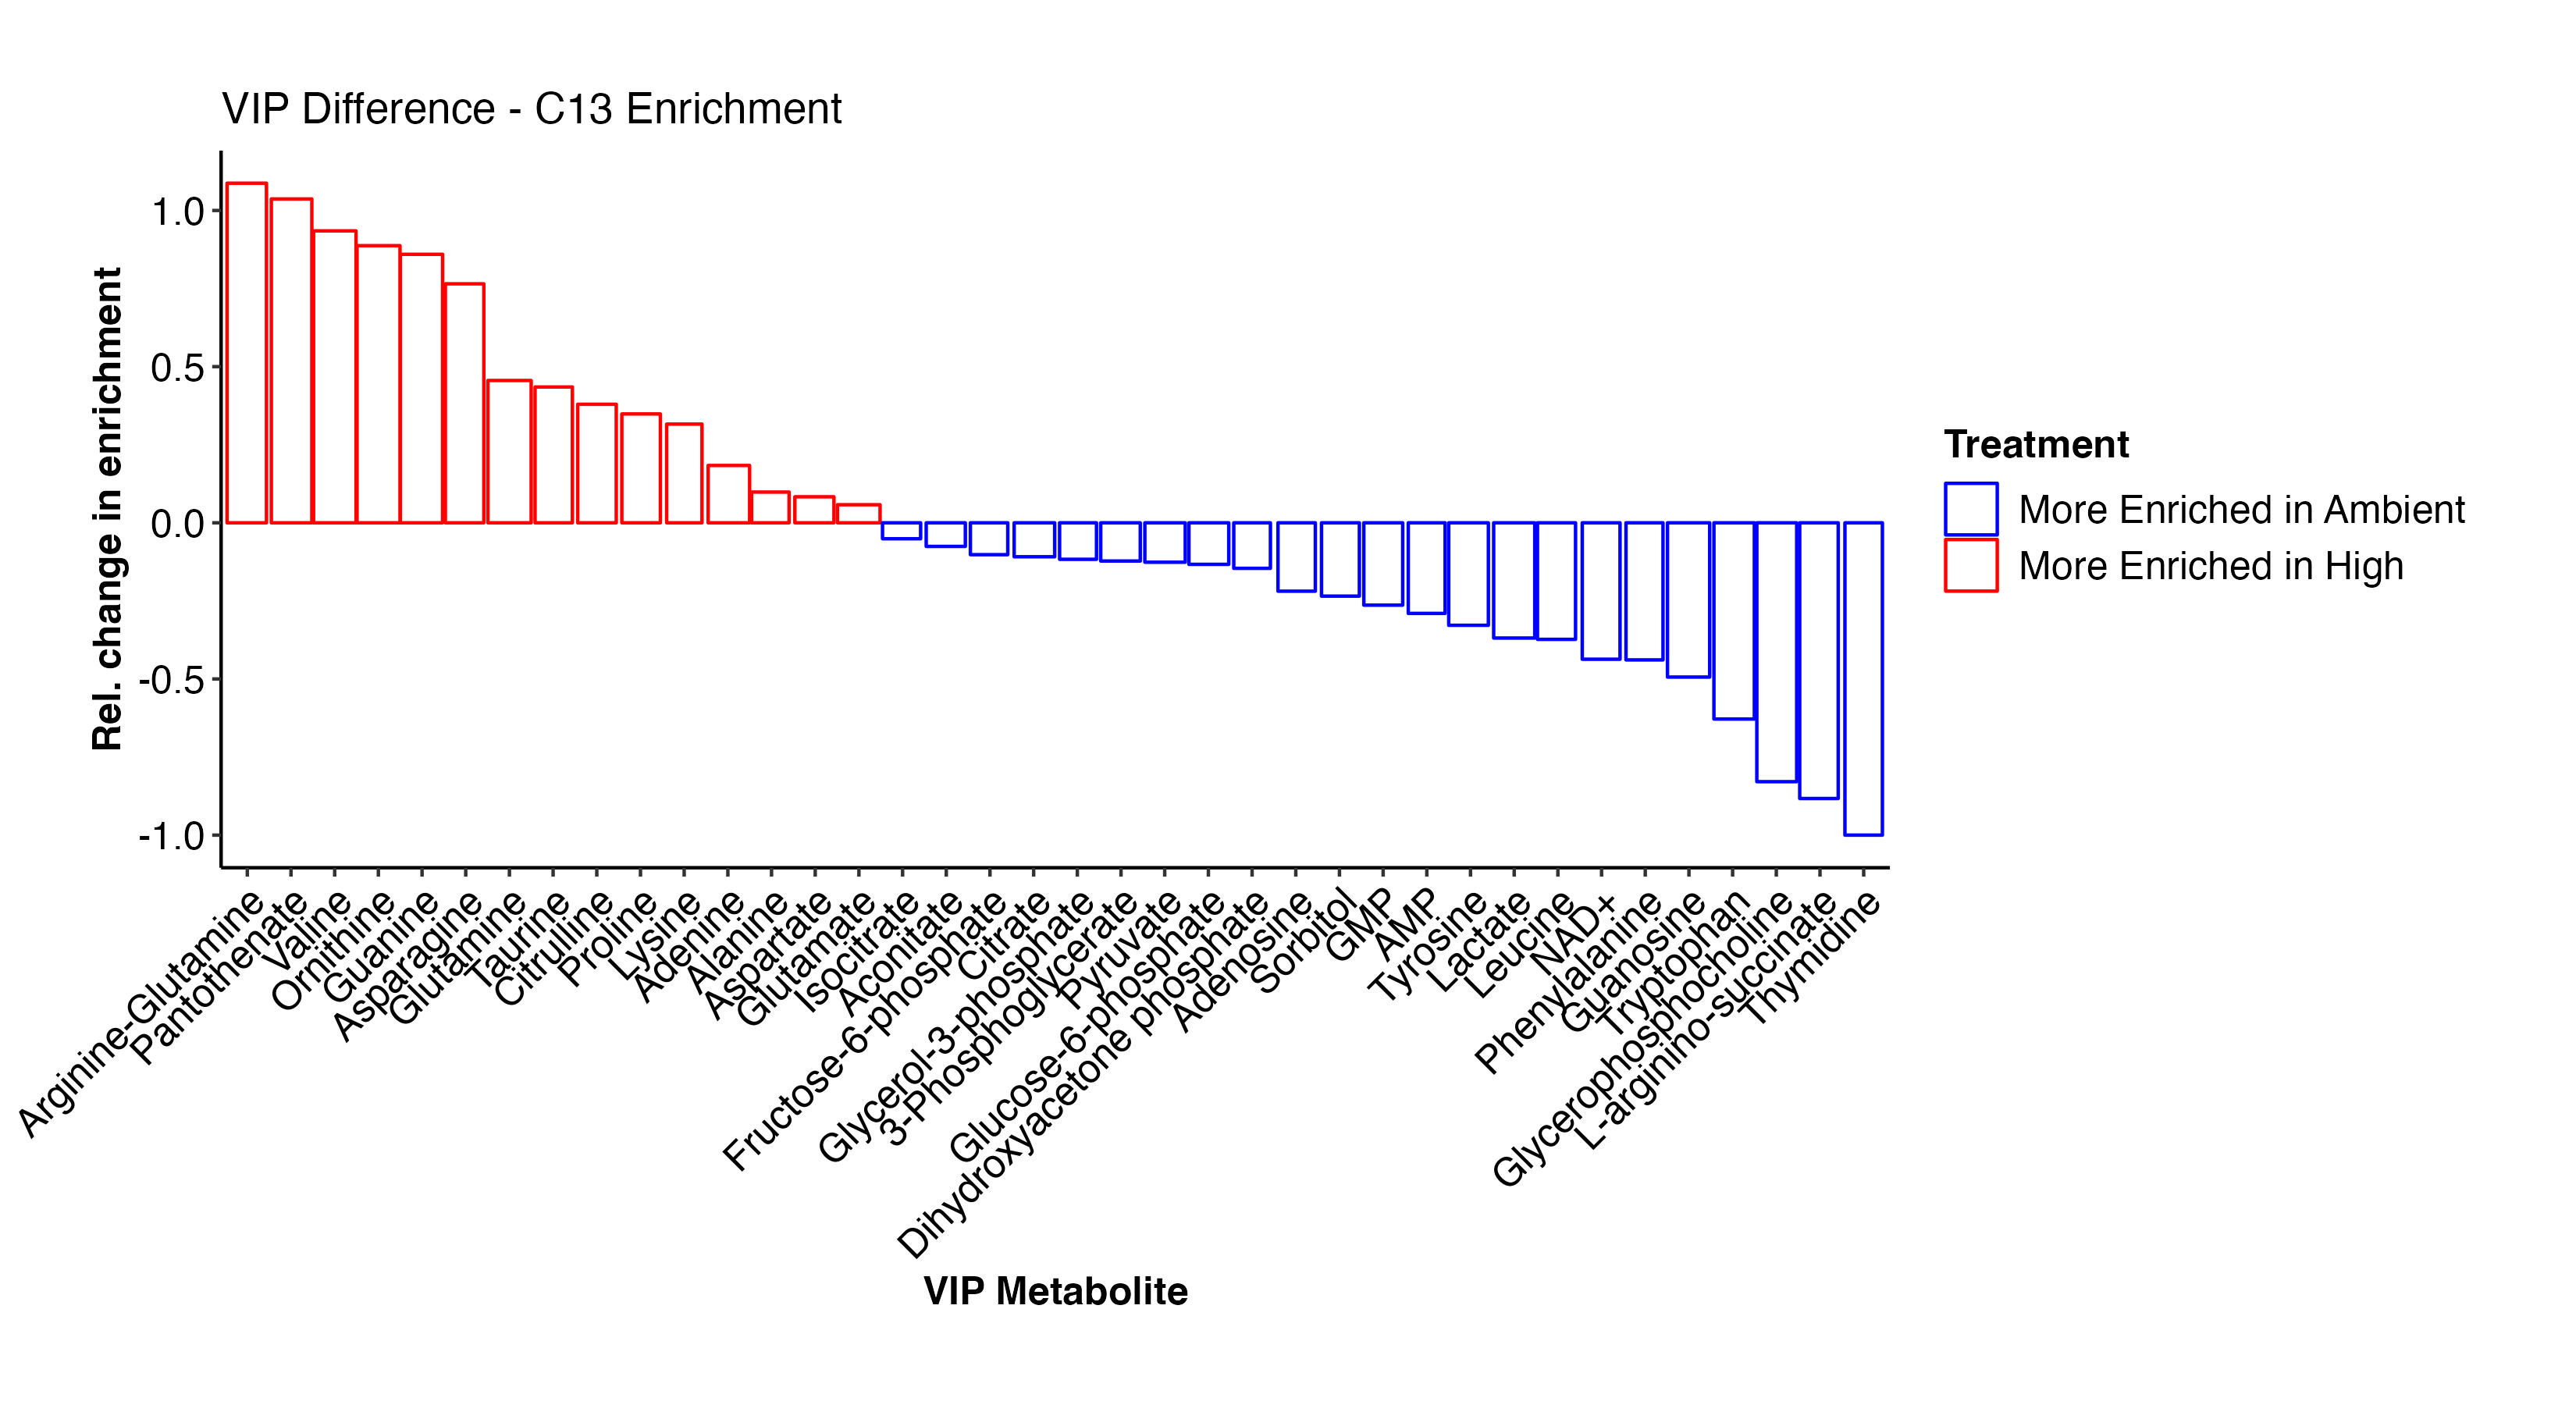
There are some really interesting results here! At high temperature, there is higher enrichment in arginine-glutamine, asparagine, glutamine, proline, lysince, adenine, alanine, glutamate, and other amino acids. These metabolites are all involved in nitrogen metabolism. In contrast, at ambient temperature, there is enrichment in F6P, G3P, citrate, pyruvate, GMP, AMP, lactate, and some amino acids. This suggests that there is differential enrichment in glycolysis and central carbon metabolism between treatments. This is particularly interesting in the context of thermal stress in larvae and signals disruption in metabolism and symbiosis.
Pathway enrichment in Metaboanalyst
High temperature - KEGG Pathways (FDR p<0.05):
- Aminoacyl-tRNA biosynthesis
- Arginine biosynthesis
- Alanine, aspartate, and glutamate metabolism
- Pantothenate and CoA biosynthesis
- D-Glutamine and D-glutamate metabolism
- Nitrogen metabolism
Ambient temperature - KEGG Pathways (FDR p<0.05):
- Glycolysis/gluconeogenesis
- Citrate cycle
- Glyoxylate and dicaroxylate metabolism
- Phenylalanine, tyrosine, and tryptophan biosynthesis
There are very different pathways that are differentially enriched in labeling at our temperatures. At high temperature metabolites involved in nitrogen metabolism have higher label enrichment values. In contrast, at ambient temperature, metabolites have higher enrichment in glucose metabolism pathways including glycolysis, the TCA cycle, and glyoxylate metabolism. We will look at these pathways in detail below.
5. Is metabolite labeling proportion different between dark and light treatments?
I next analyzed metabolite labeling proportion, which is the proportion of metabolites in the total pool that have at least one labeled carbon atom.
In order to determine whether labeled carbon in metabolites was incorporated from translocated photosynthate products or from host incorporation of inorganic carbon. As done above for enrichment, we will look at labeling of metabolites in the light C13 (n=12) and the dark C13 treatments (n=4).
First, I looked at labeling for each metabolite between the dark and light samples.
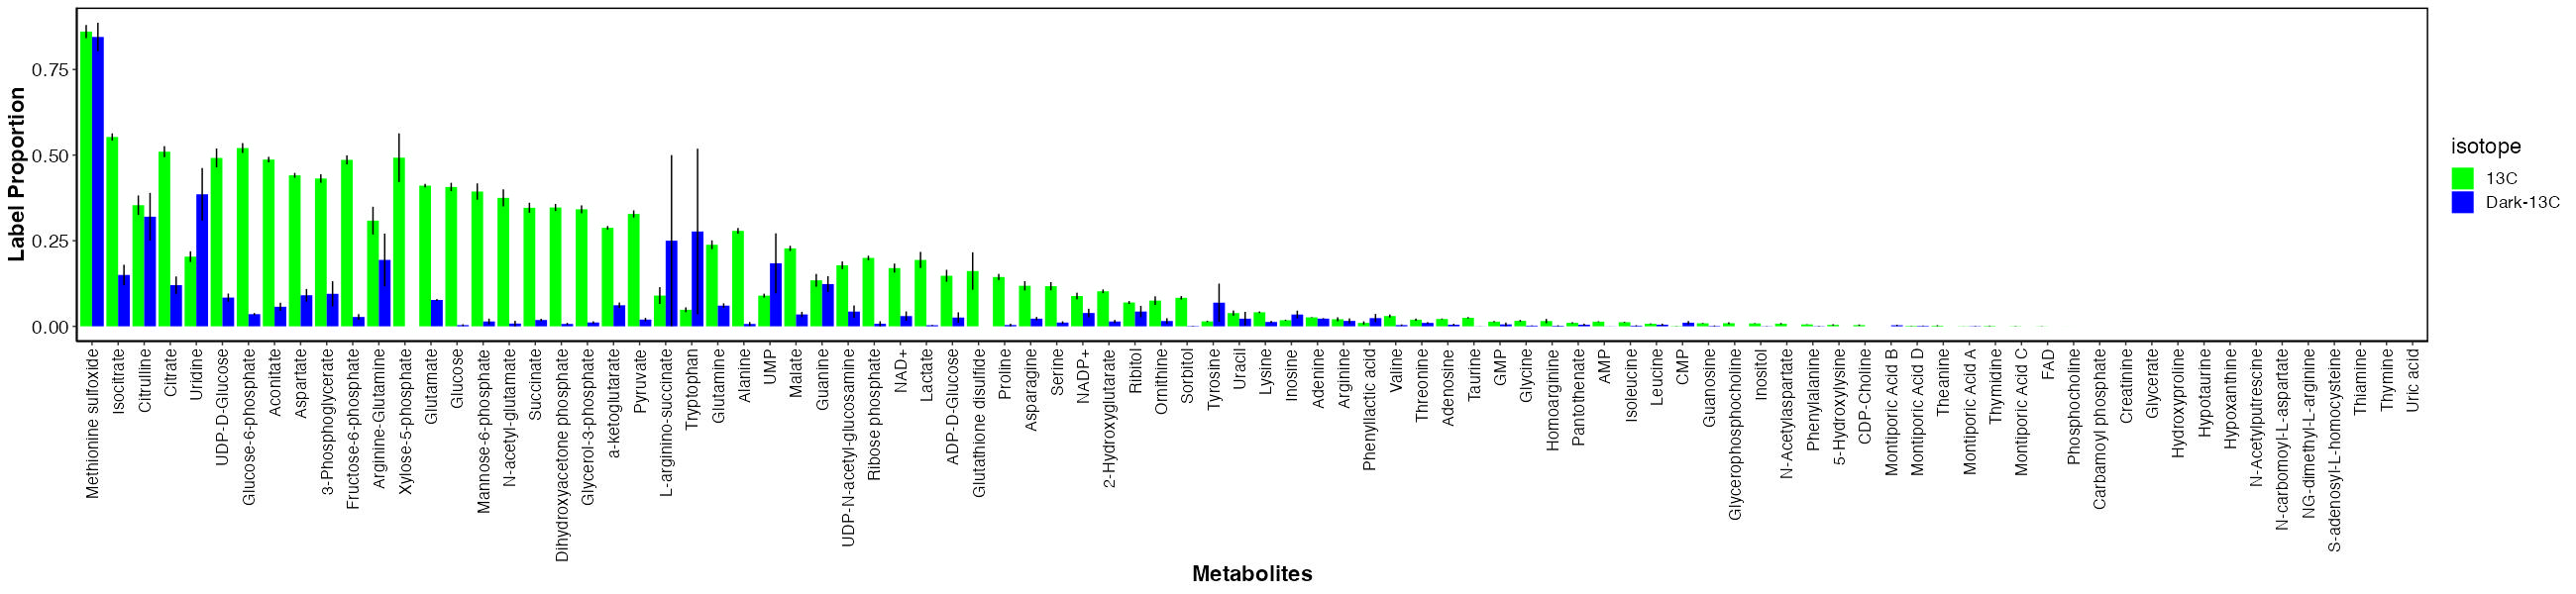
There are metabolties that have similar labeling between dark and light samples and those that have much higher labeling in the light. This indicates that metabolites with similar labeling levels are due to host incorporation because they are labeled in the absence of photosynthesis. In contrast, metabolites that are only labeled in the light are those with carbon incorporated from fixed carbon from the symbiont.
It is important to note that even for metabolites that are highly labeled in light as compared to dark, there is some residual enrichment in the dark. This is because the samples were not dark adapted prior to adding the label and therefore the small labeling is due to residual photosynthetic and metabolic activity at the start of the incubation. This is expected.
I then isolated the metabolites that we expect to have carbon from photosynthesis.
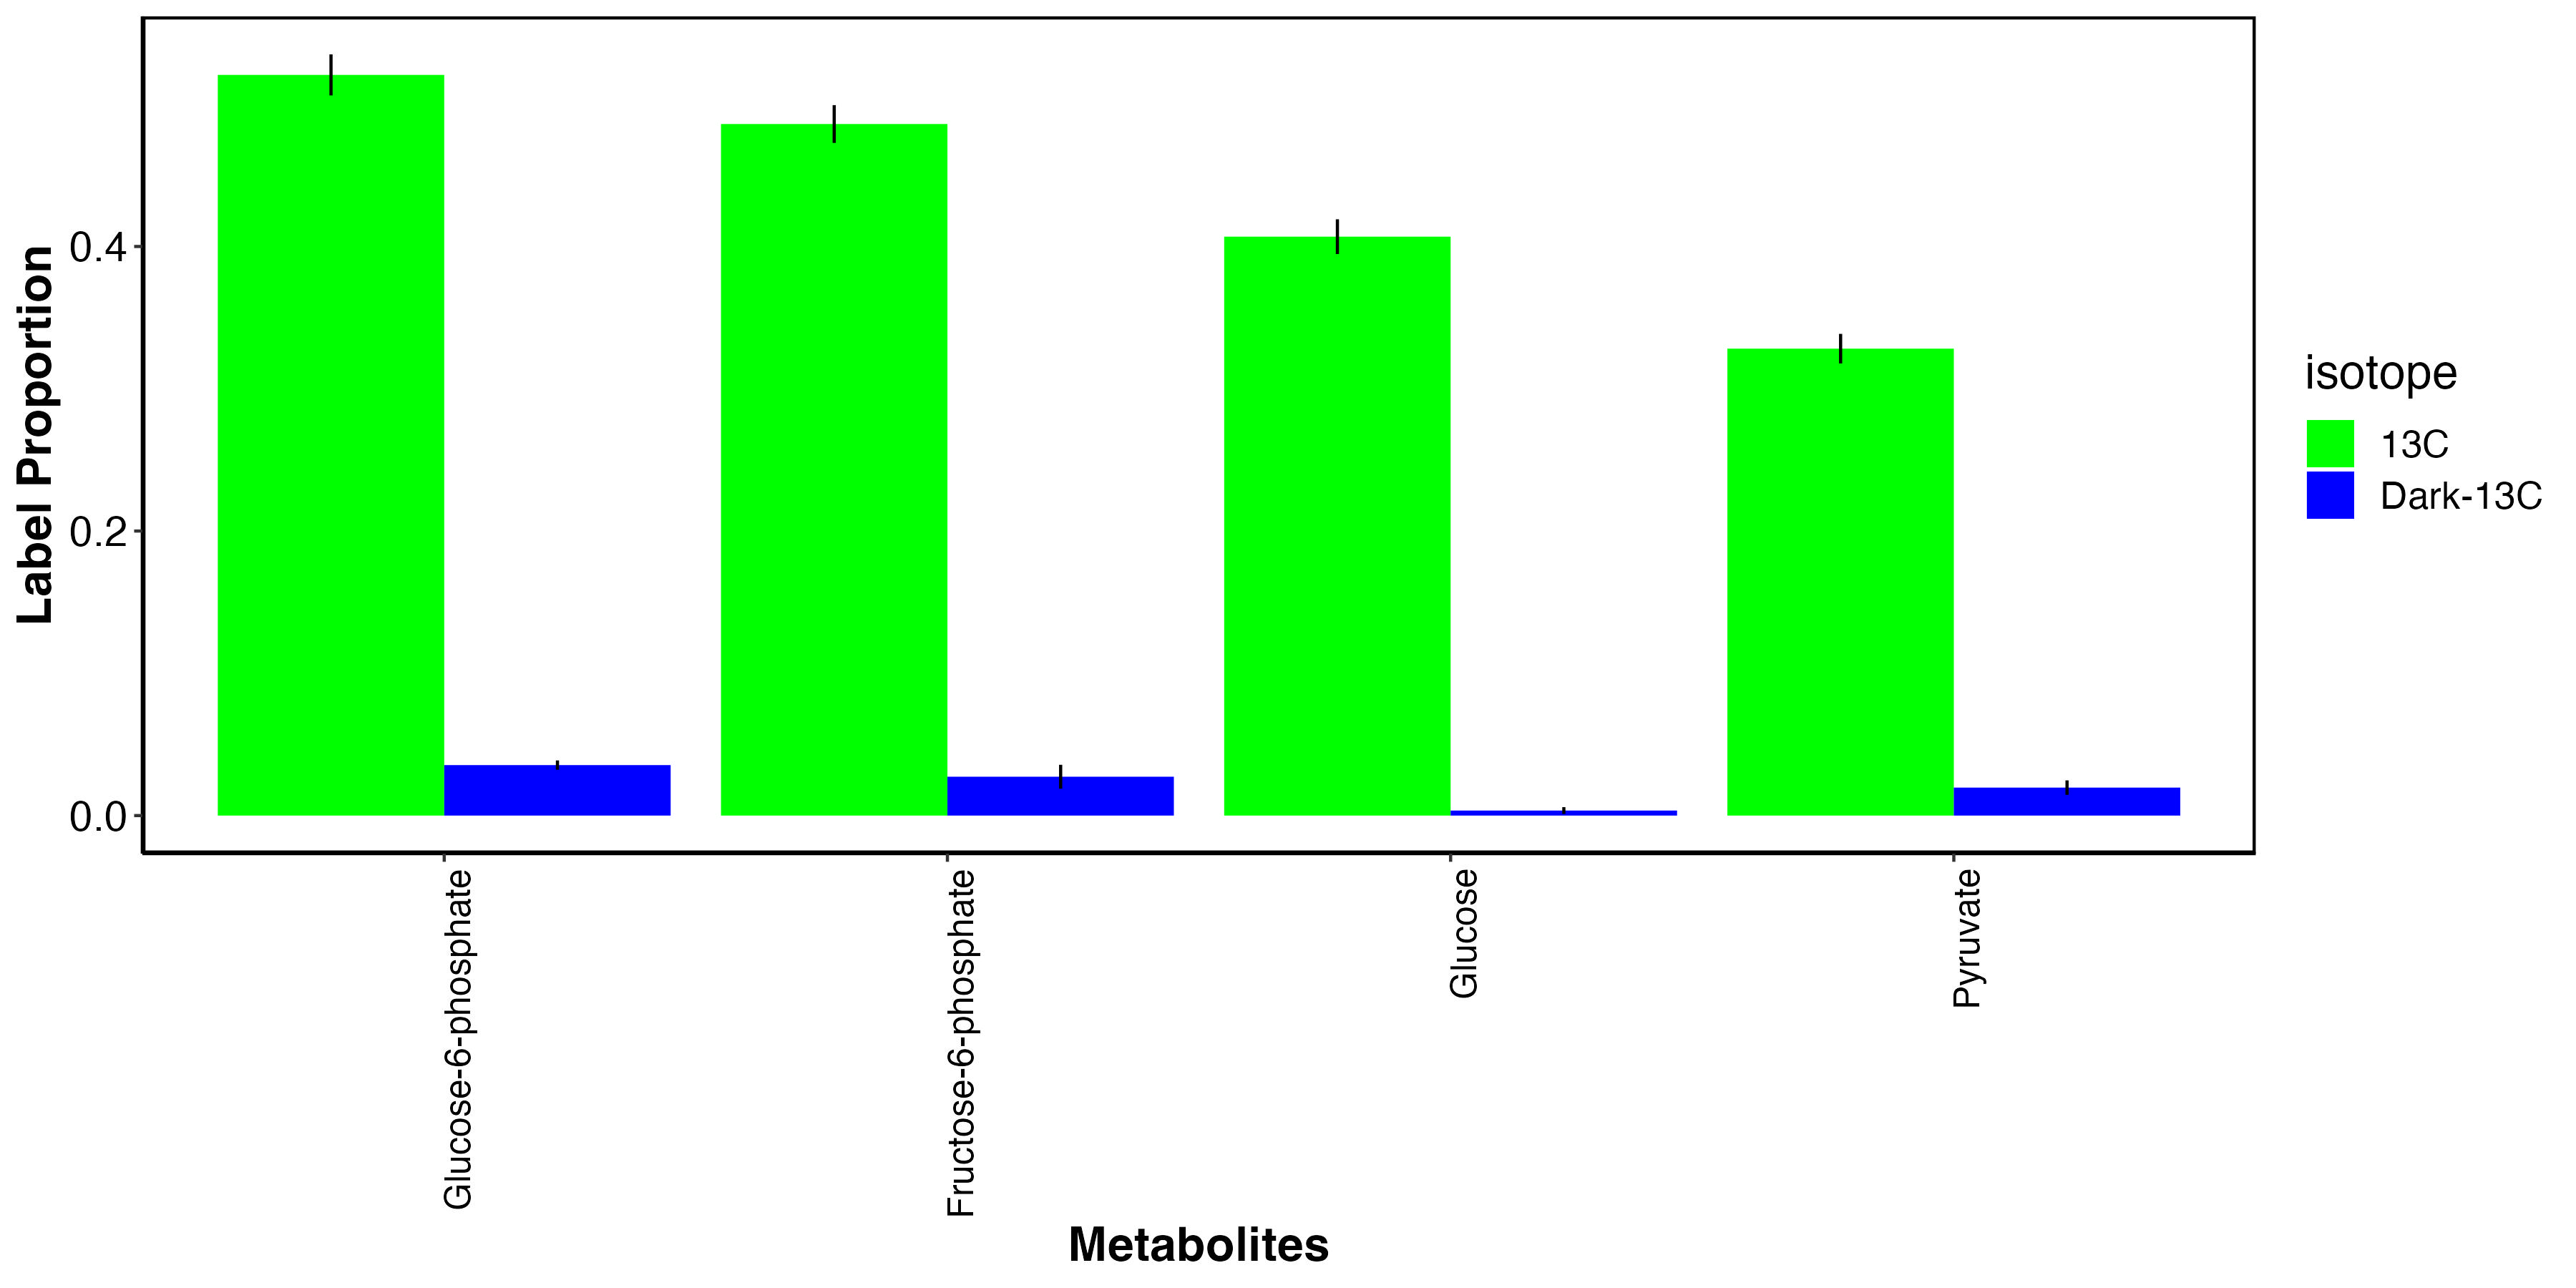
This plot shows that, as expected, glucose photosynthates and derivatives are highly labeled in the light and not in the dark. This indicates that fixed carbon in these metabolites is from photosynthate translocation to the host tissue.
I also looked at metabolites that had elevated labeling in the dark.
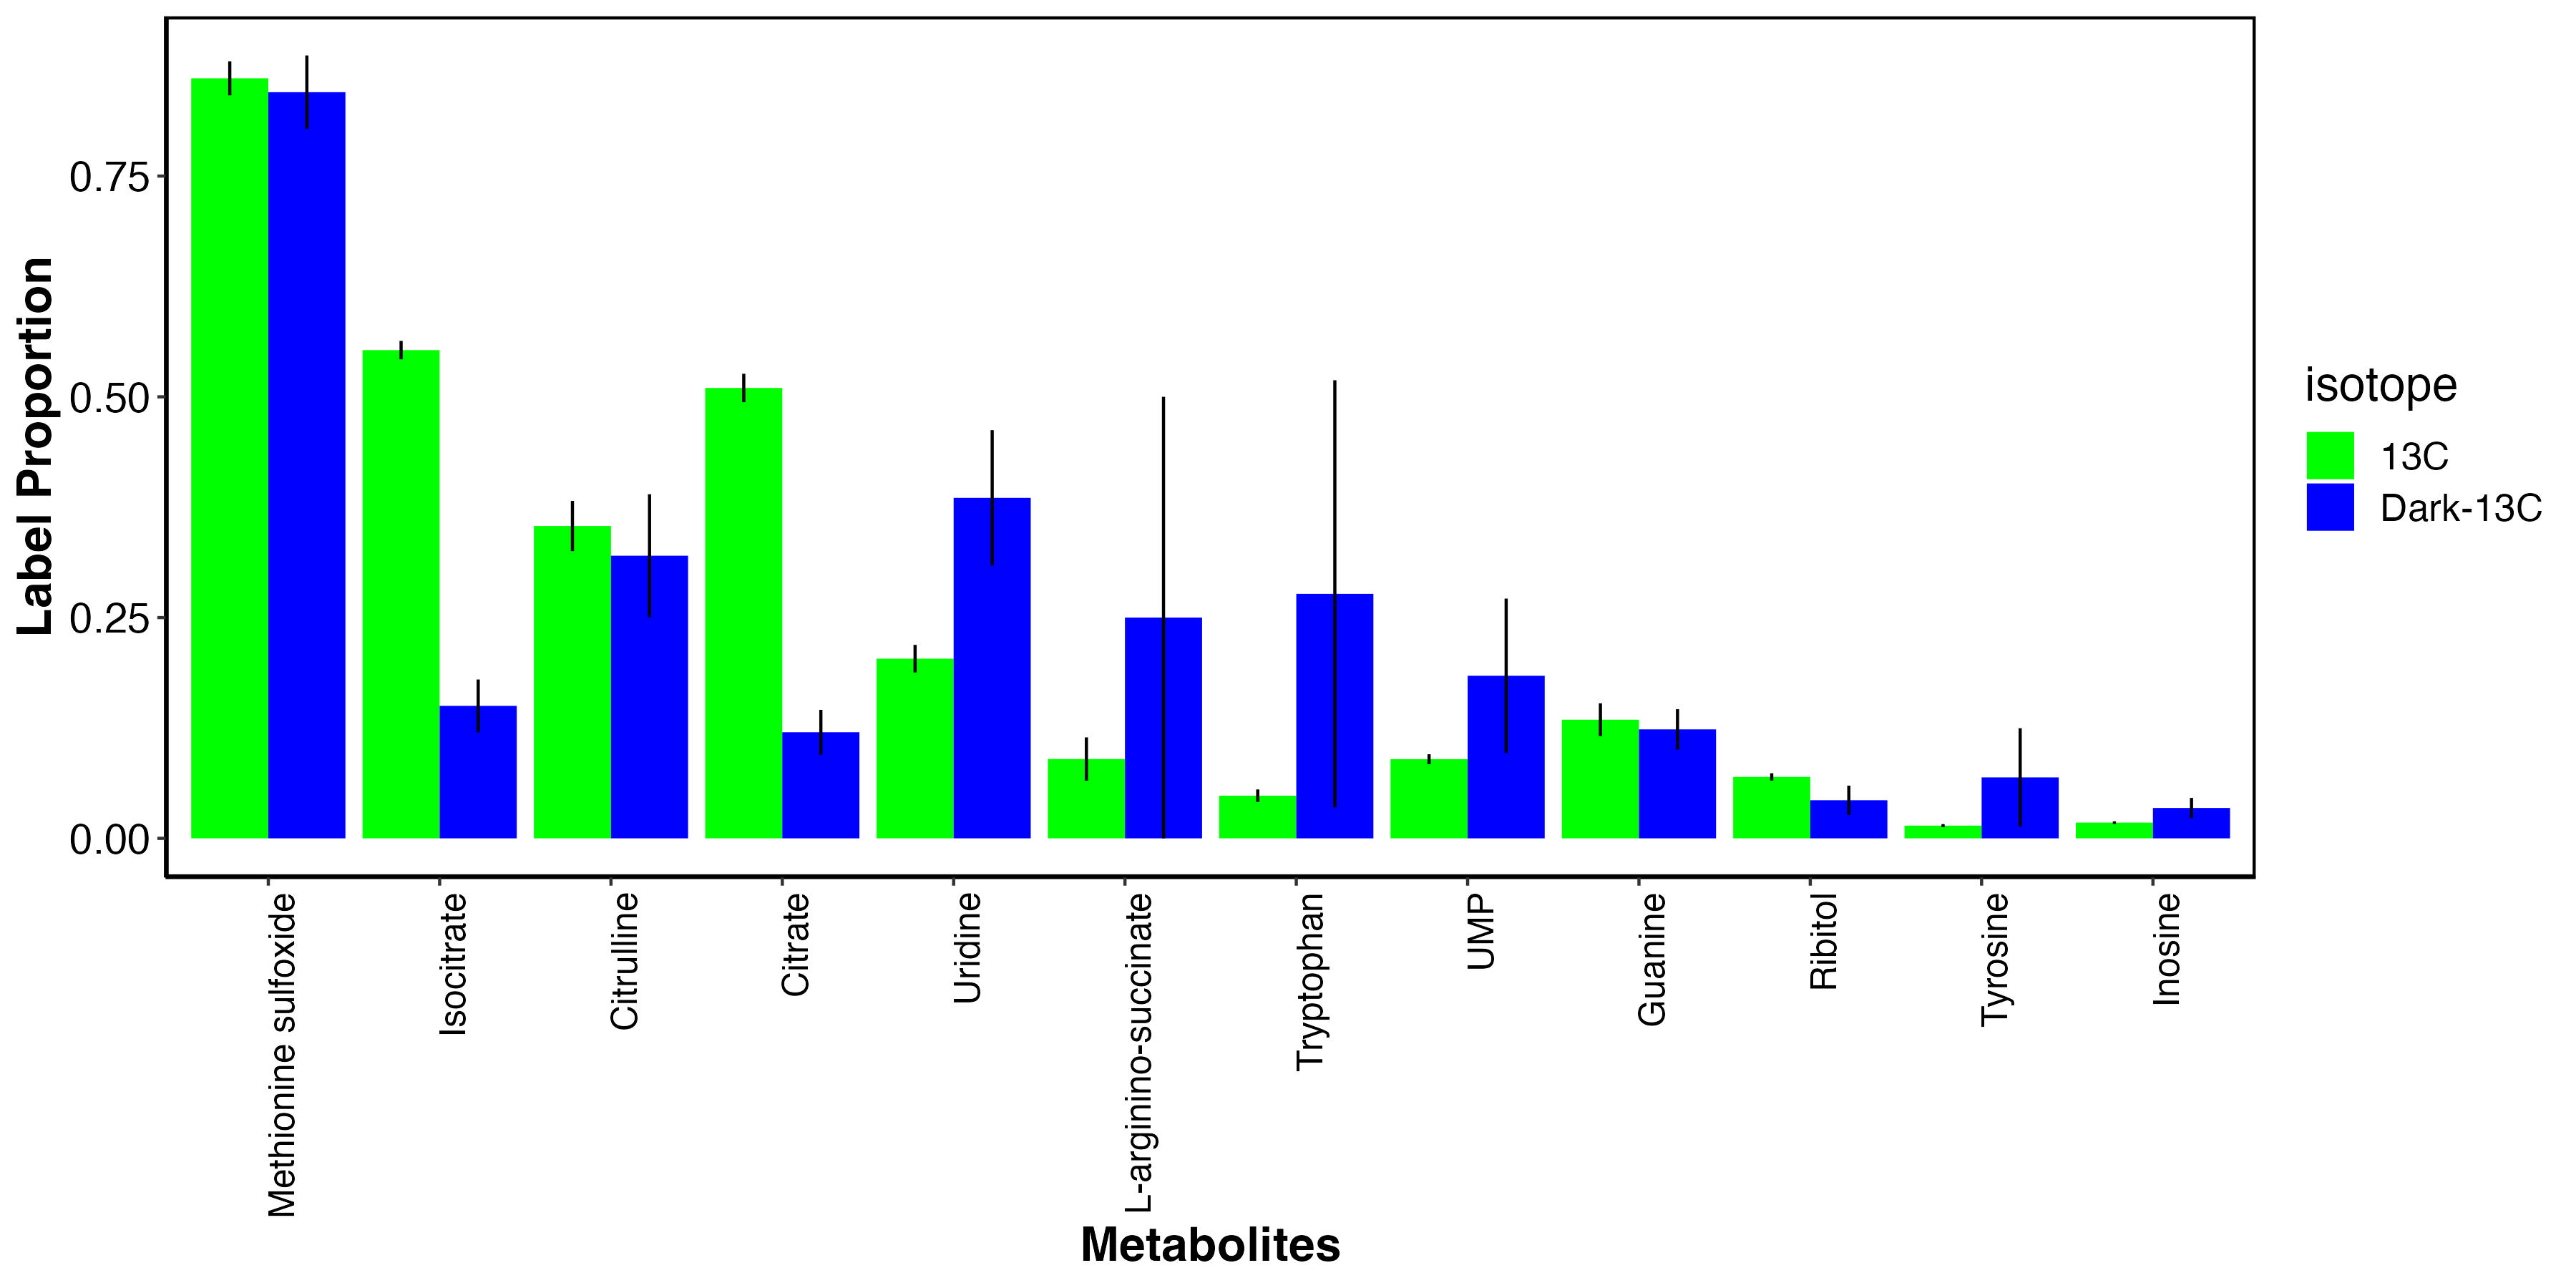
This shows that there may be some metabolites that incorporate carbon from host uptake of inorganic carbon. These include methionine sulfoxide, an antioxidant, as well as several amino acids and nitrogen metabolism intermediates. These results are very similar to enrichment results above.
We will use this information to look at differentially labeled metabolites and hypothesize the origin of the carbon during biosynthesis in the context of our temperature treatments and symbiotic relationship.
6. Is metabolite labeling proportion different between temperature treatments?
I then analyzed metabolite labeling proportion across temperature treatments.
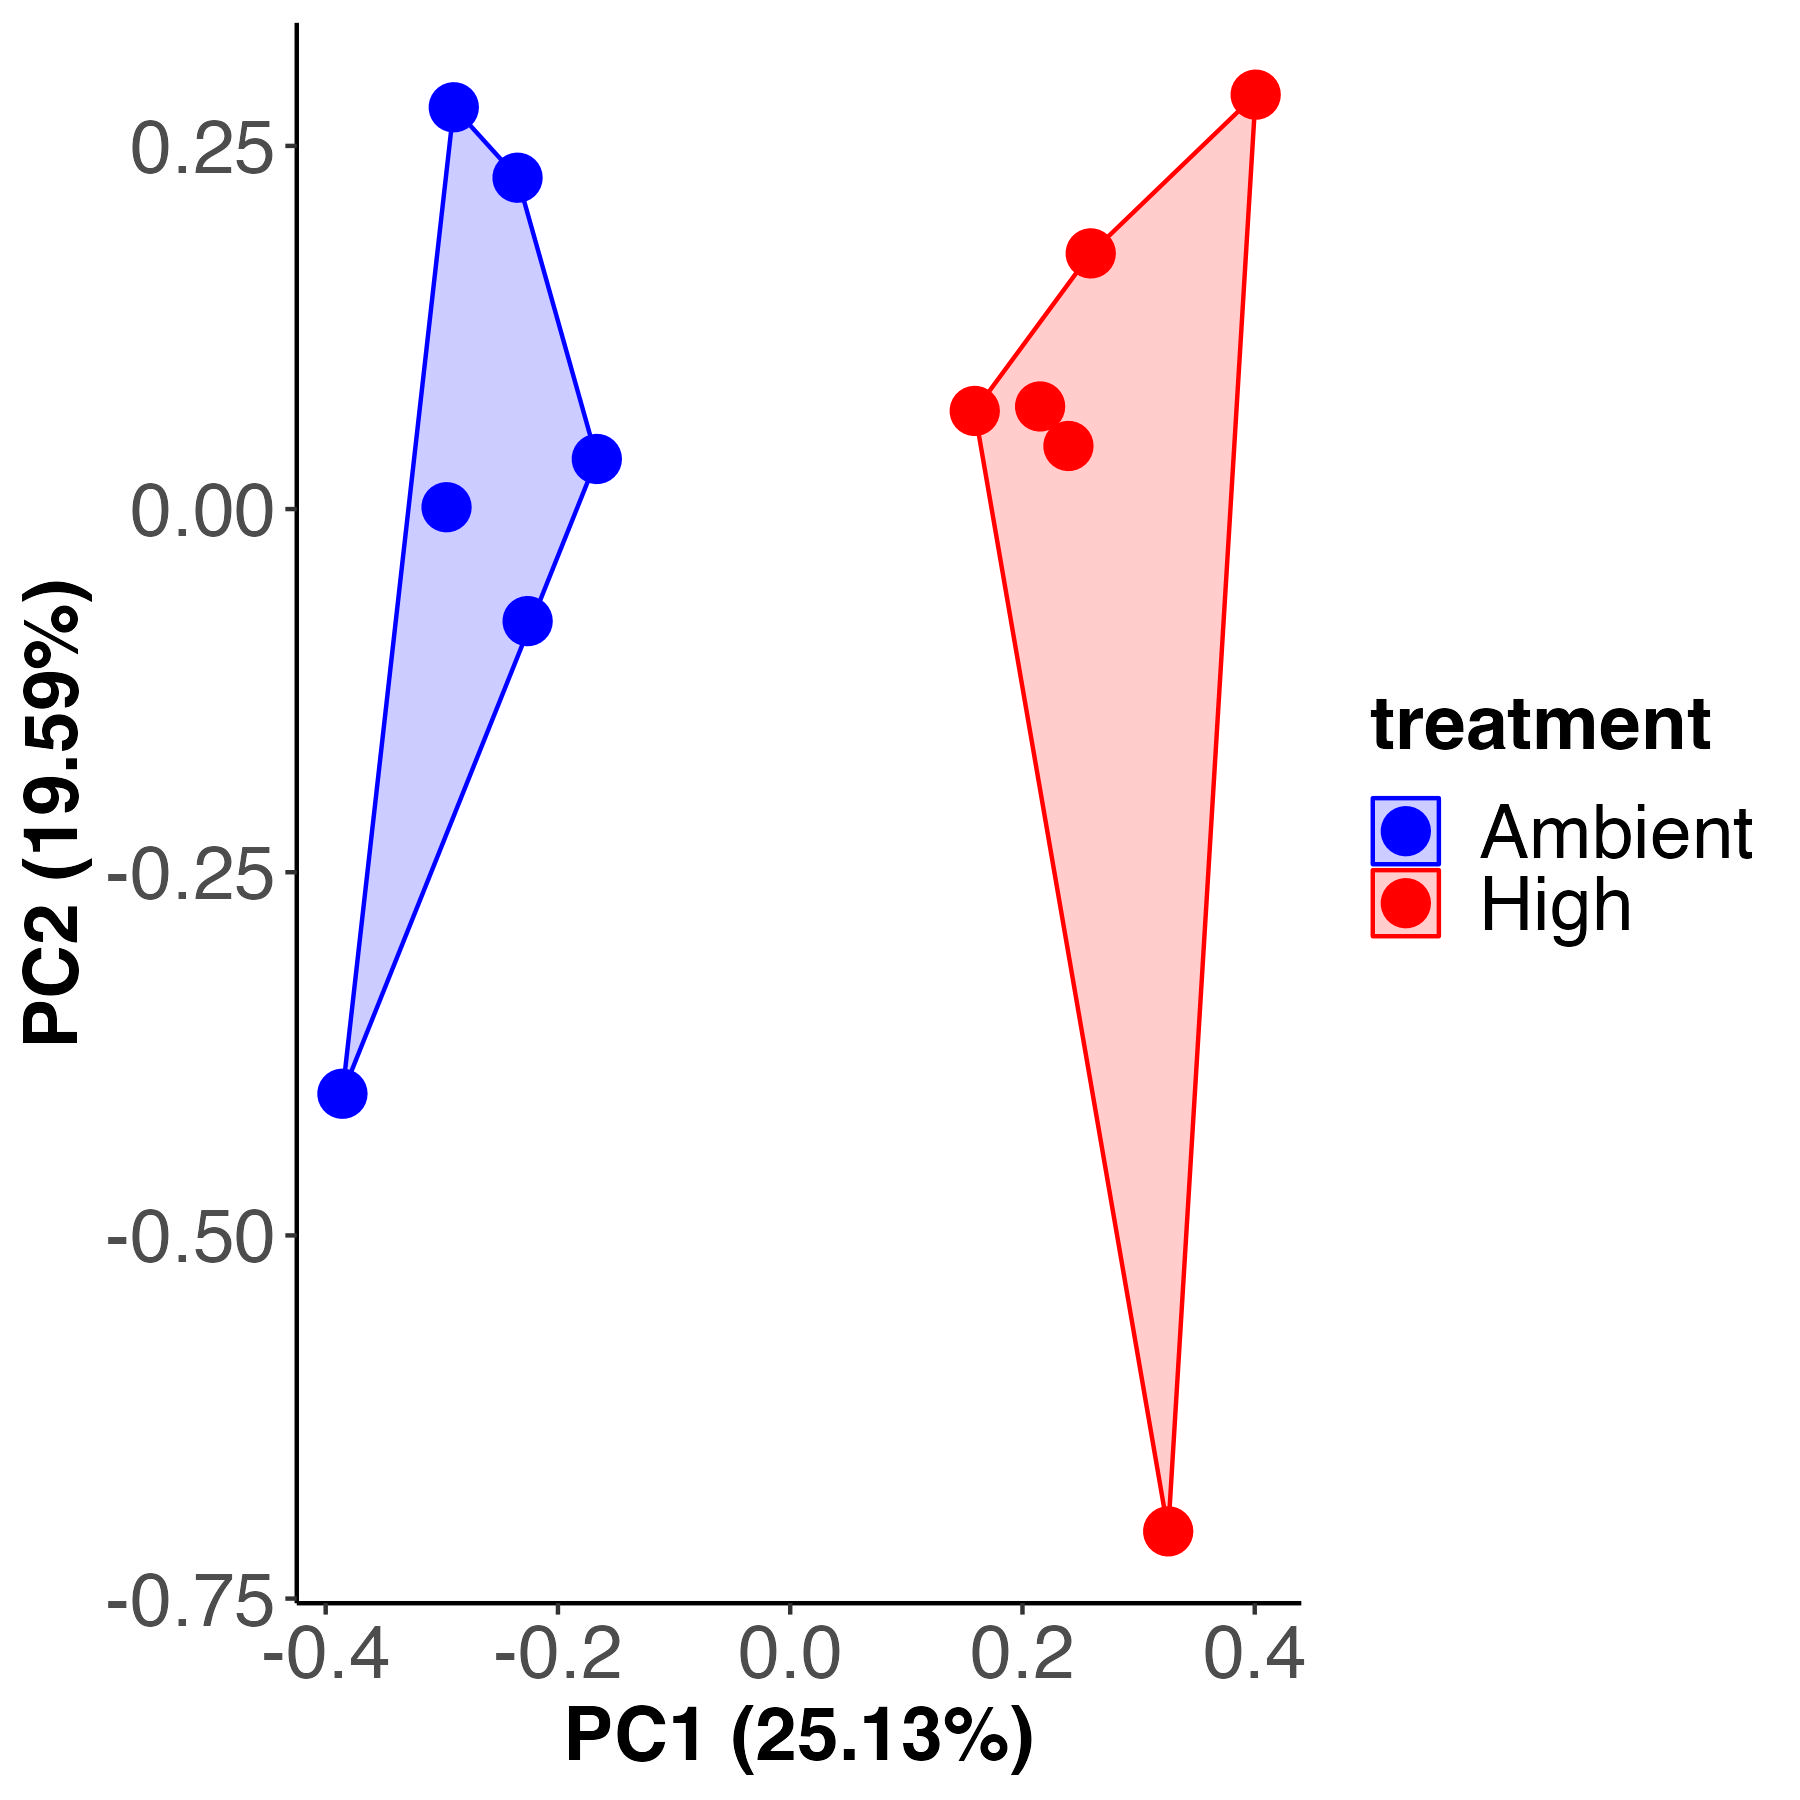
PCA
Permutation test for adonis under reduced model
Terms added sequentially (first to last)
Permutation: free
Number of permutations: 999

adonis2(formula = vegan ~ treatment, data = labeling_pca_13C, method = "eu")
          Df SumOfSqs     R2      F Pr(>F)
treatment  1   205.65 0.2428 3.2065  0.001 ***
Residual  10   641.35 0.7572
Total     11   847.00 1.0000
Metabolite labeling is different by temperature treatment, accounting for 24% of the variance with 76% residual variance, similar to previous metrics.
PLS-DA and VIP analysis
A supervised PLS-DA analysis also shows separation in metabolite labeling profiles by temperature treatment.
I then extracted VIPs and plotted labeling proportions as well as relative difference between treatments for each metabolite. Overall, we see similar labeling patterns between treatments as in the enrichment data, but there are slight variations in specific metabolites that I would like to look into in more detail in additional analyses.
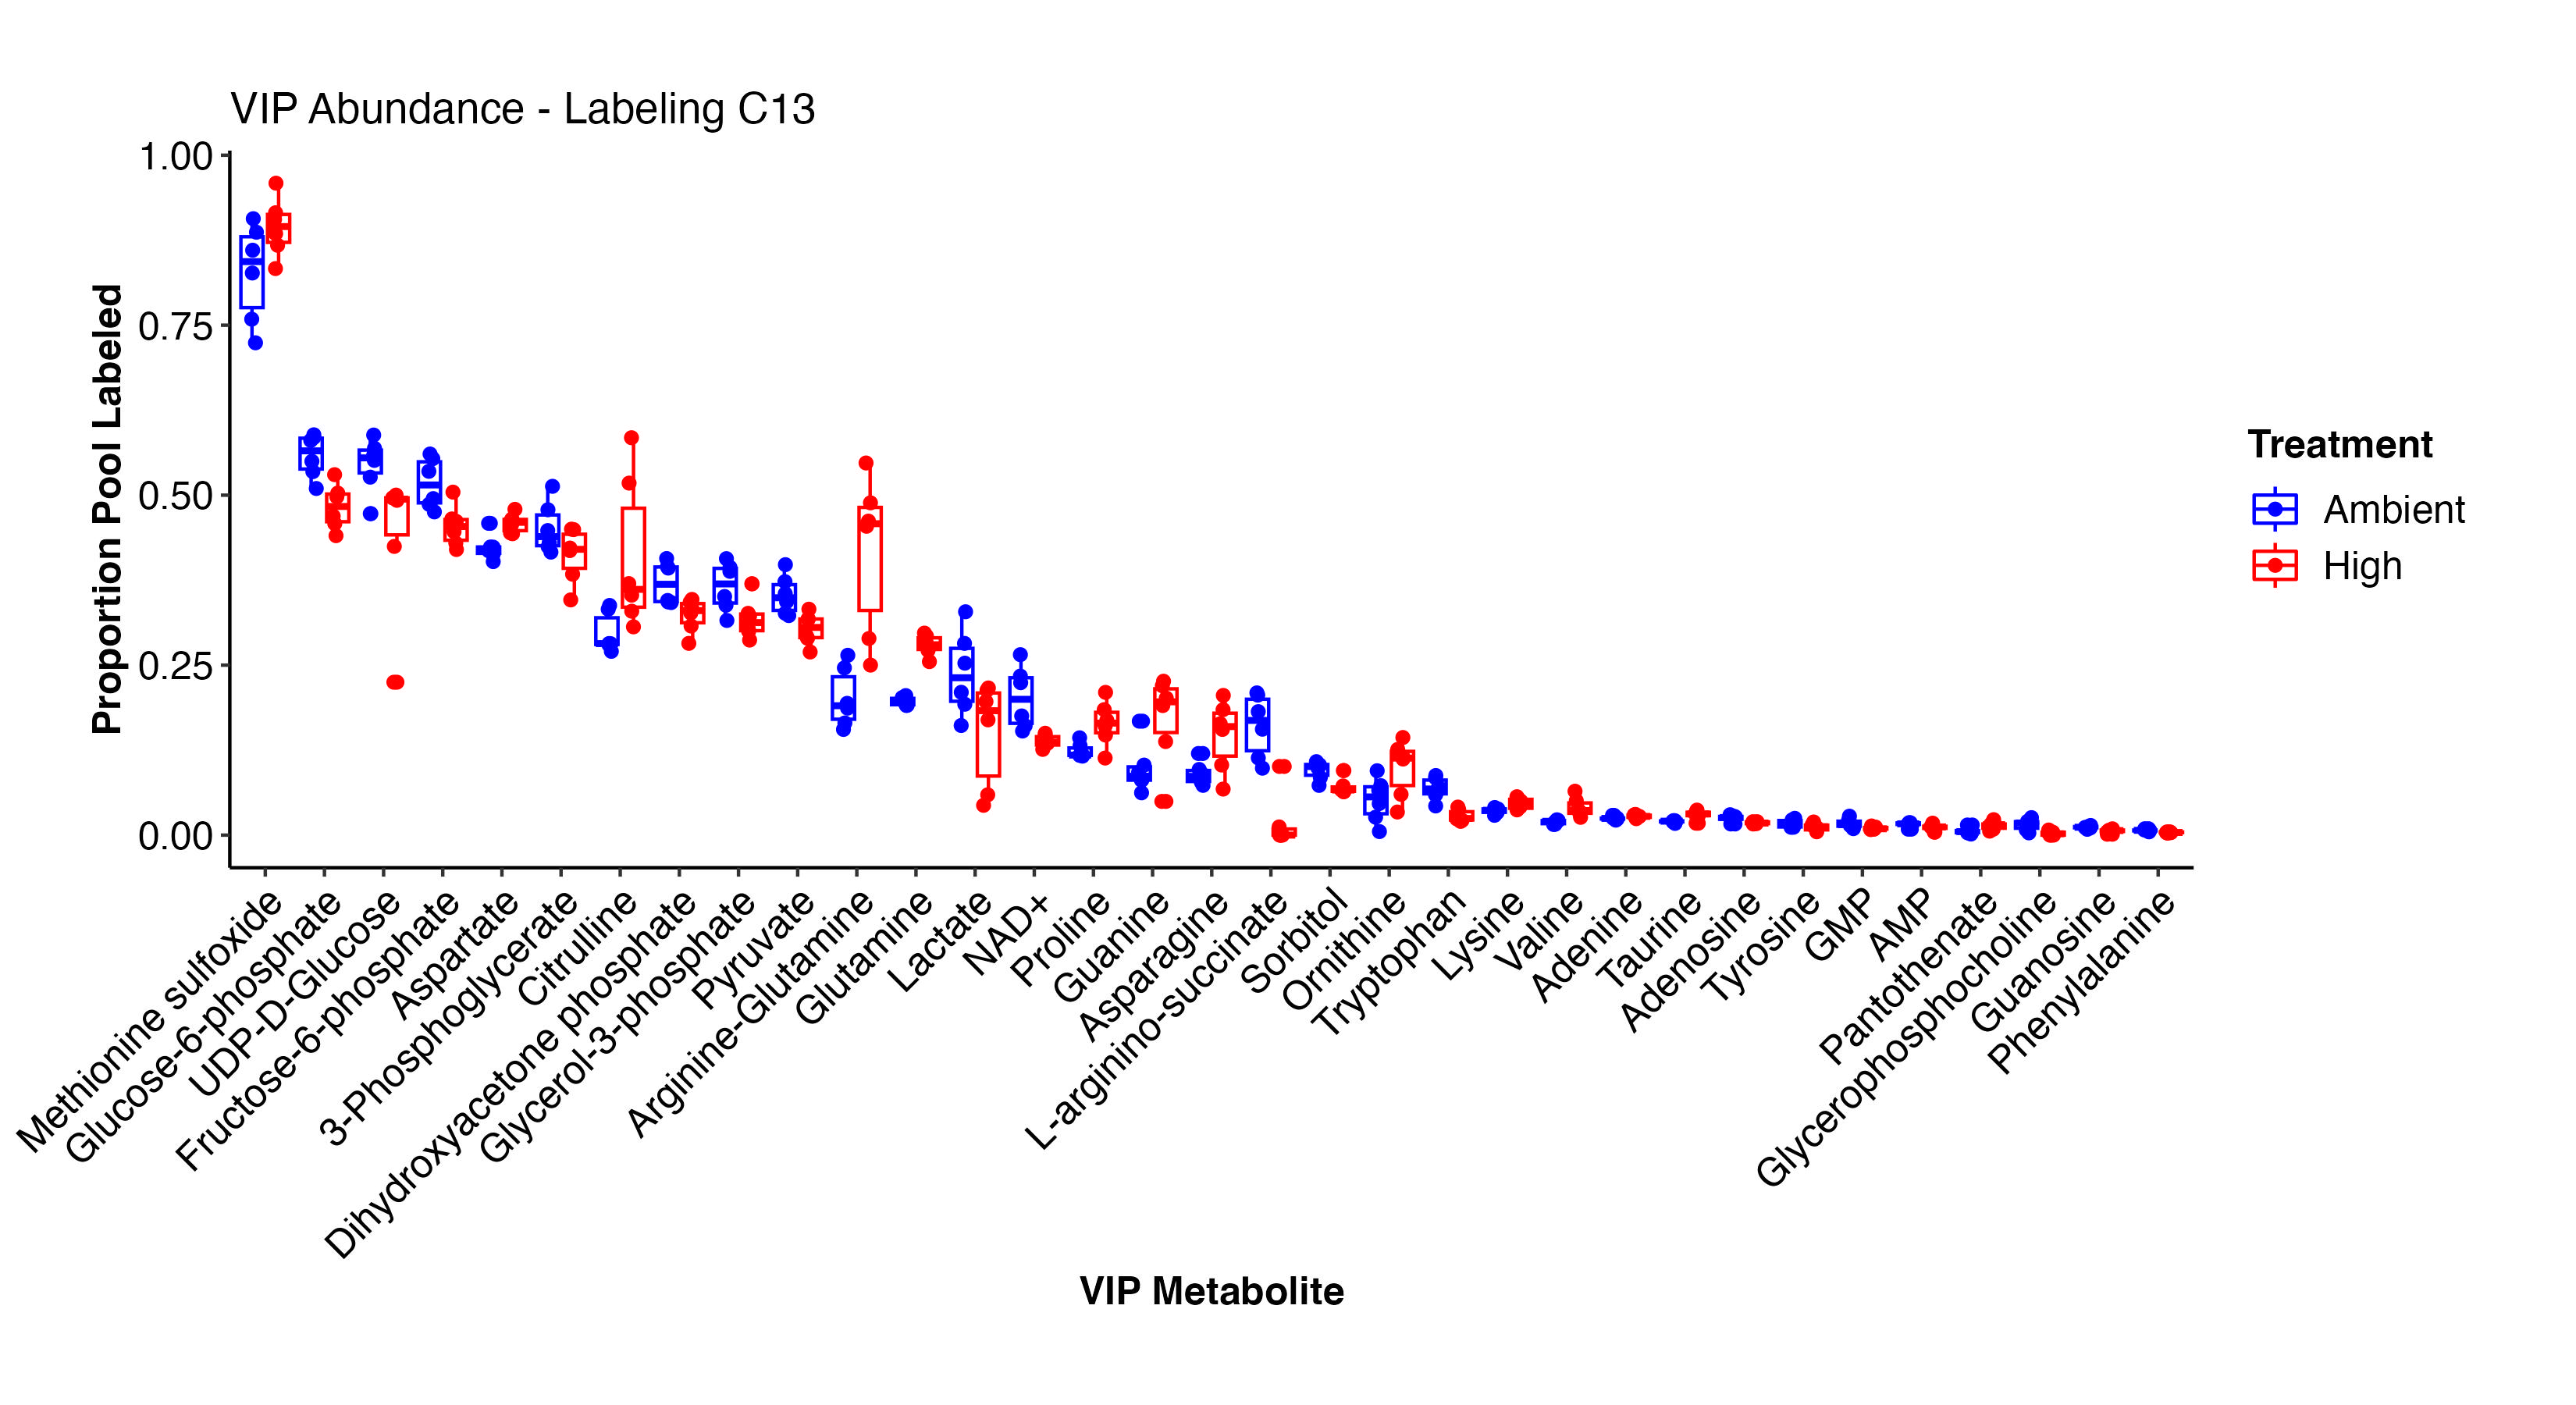
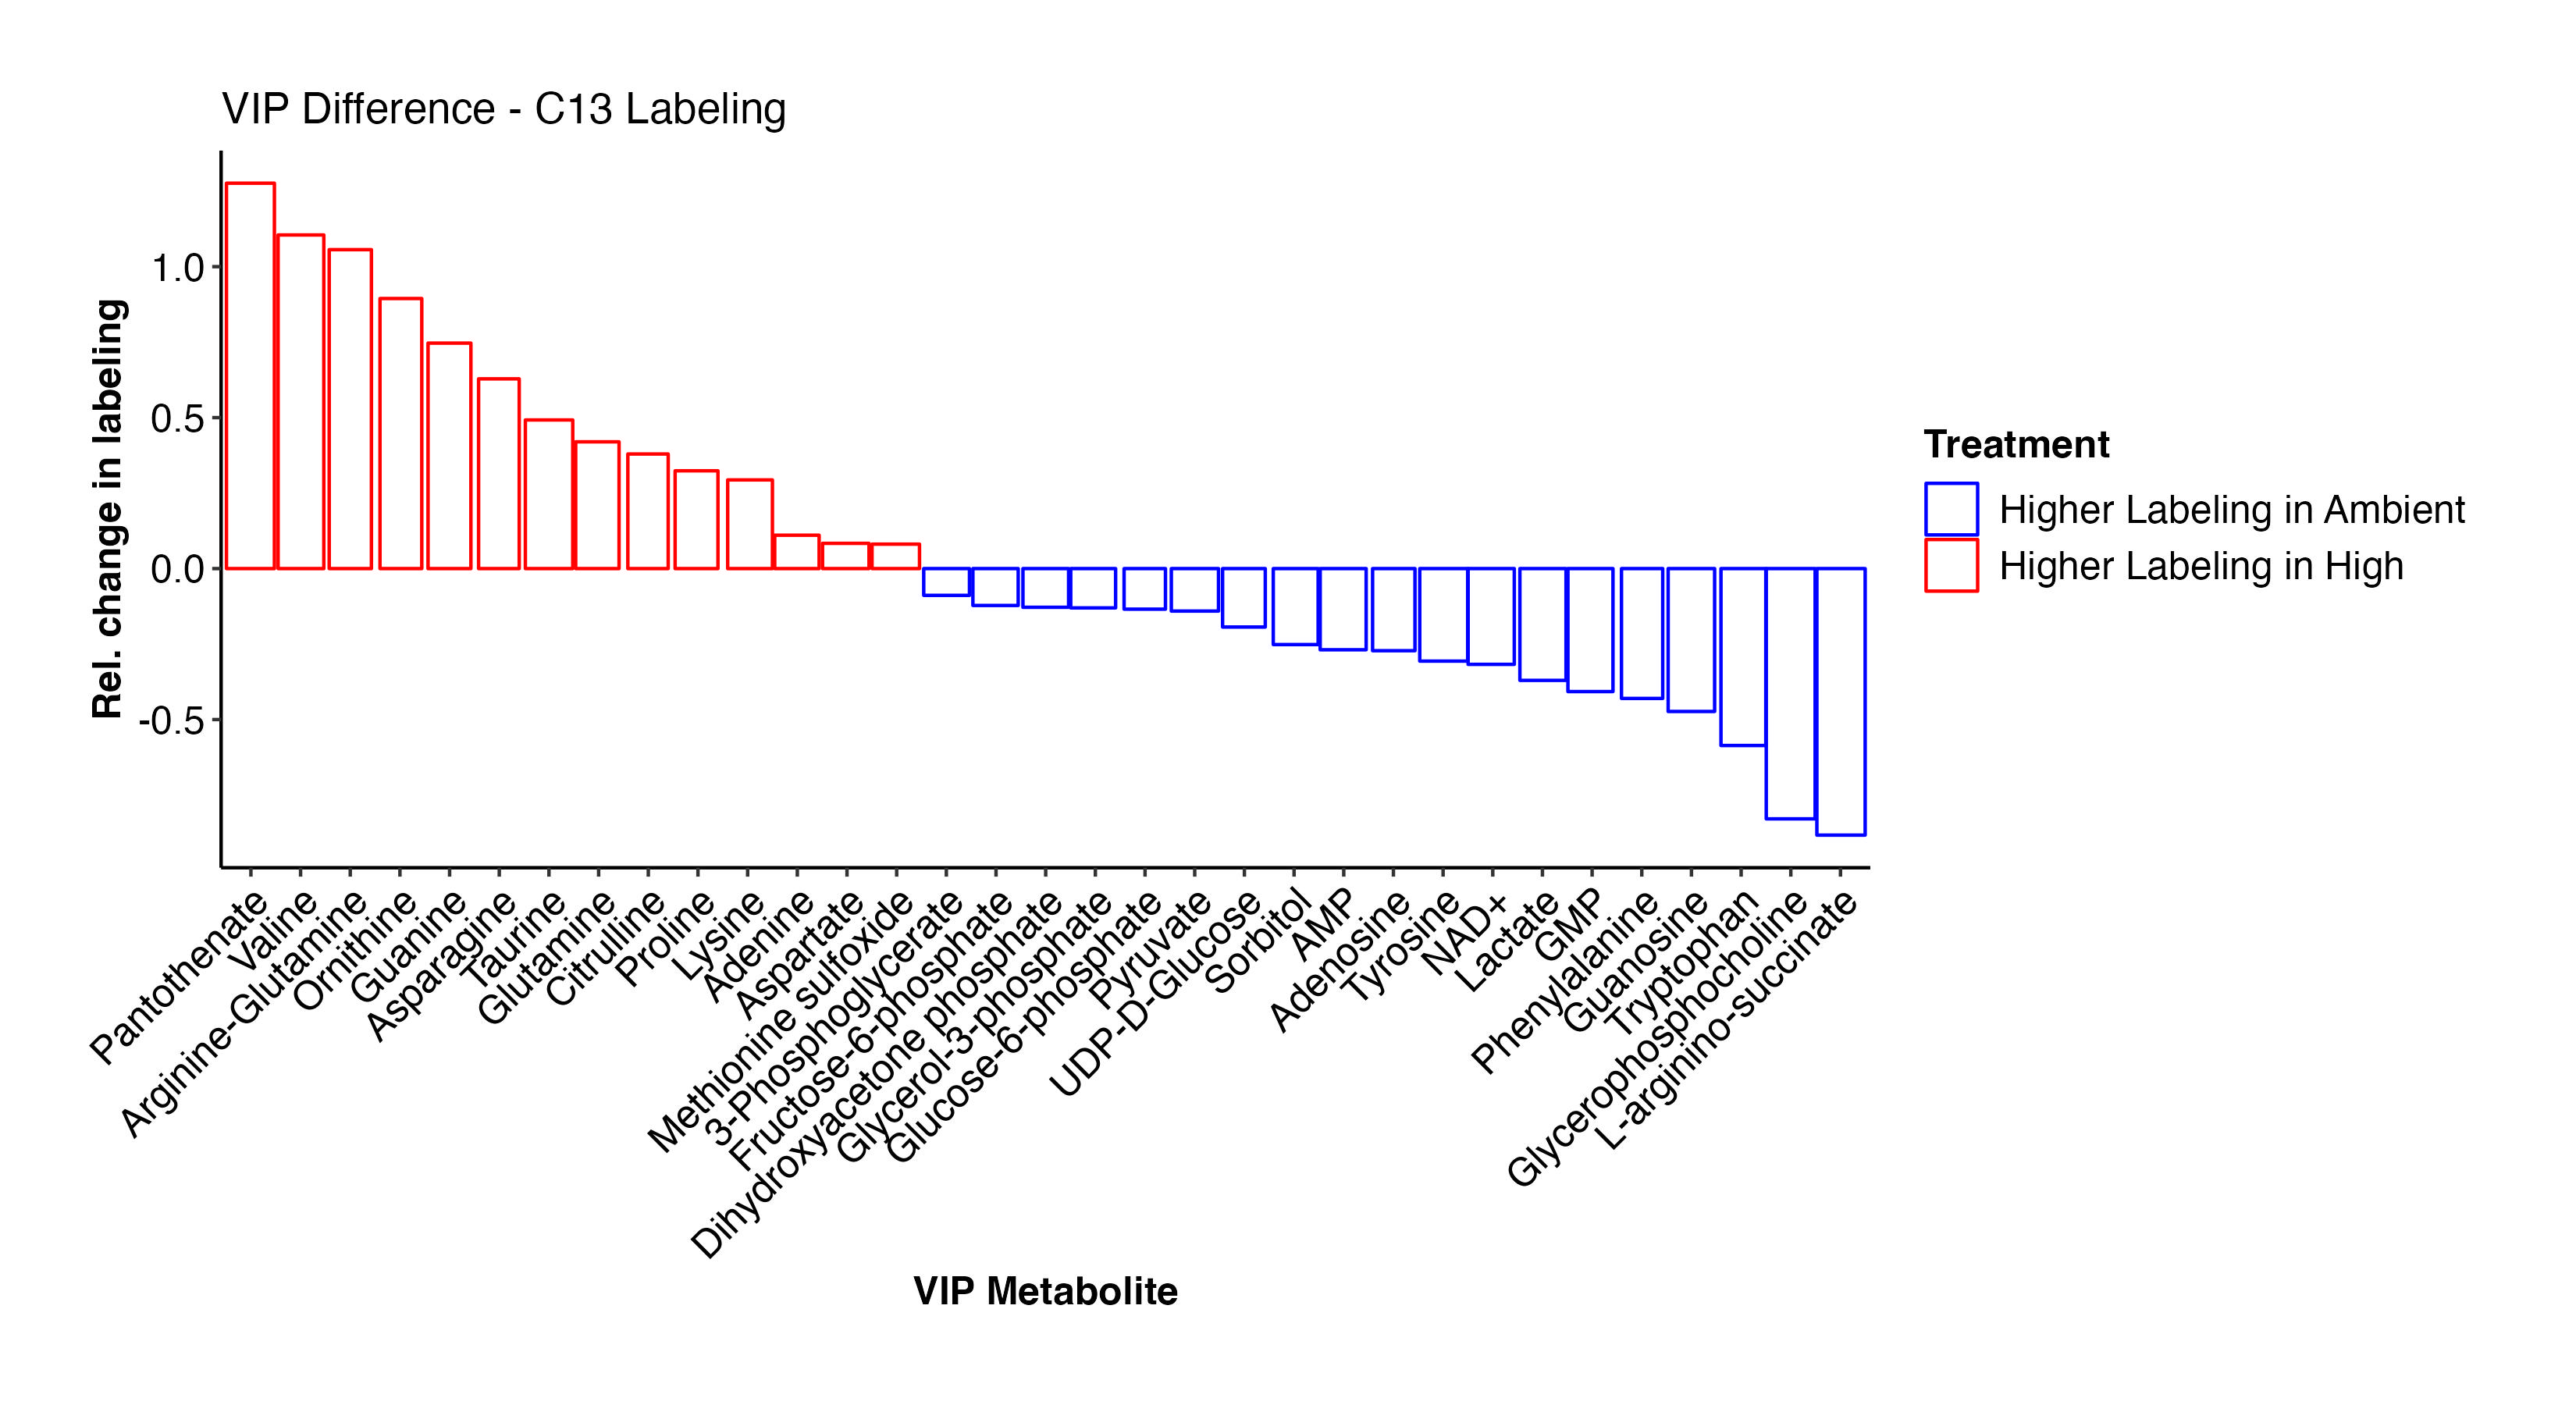
Pantothenate, valine, arginine-glutamine, asparagine, glutamine, prline, lysine, adenine, aspartate, methionine sulfoxide, and other metabolites have higher labeling at high temperature and indicate shifts in label incorporation in nitrogen and amino acid metabolism. In contrast, there is increased labeling in F6P, G3P, glycerol-3-phosphate, pyruvate, UDP-D-Glucose, adenosine, NAD+, lactate, phenylalanine, and other metabolites related to carbon and glucose metabolism. These results are similar to what we saw for enrichment levels above.
Pathway enrichment in Metaboanalyst
I again ran the VIPs for high and ambient temperature in Metaboanalyst to view enrichment of KEGG pathways.
High temperature KEGG Pathways (FDR p<0.05):
- Aminoacyl-tRNA biosynthesis
- Arginine biosynthesis
- Pantothenate and CoA biosynthesis
- Alanine, aspartate, and glutamate metabolism
These pathways are involved in nitrogen and peptide metabolism as well as precursers to coenzyme A and carrier proteins. Pantothenate is also known as vitamin B5.
Ambient temperature KEGG Pathways (FDR p<0.05):
- Glycolysis/gluconeogenesis
- Phenylalanine, tyrosine, and tryptophan biosynthesis
- Starch and sucrose metabolism
These are similar to enrichment results above. There is differential labeling in carbon metabolism with more labeling in ambient temperature, indicating potential decrease in translocation or shifts in metabolism at high temperature.
7. Does the location of carbon labeling differ for metabolites between treatments?
After viewing overall labeling proportion for each metabolite, I examined the proportion labeling at each position in each metabolite. In other words, the proportion of metabolites that have a label incorporated at the first carbon, second carbon, and so on. This can tell us more about the pathways for biosynthesis of each metabolite.
Linear models
To test for differential label incorporation by position in each metabolite in our C13 samples, I ran a linear model to test for the interaction between temperature and carbon location for each metabolite. I ran this model in a loop for each metabolite and then exported the results into a table. Finally, I applied an FDR p-value correction to account for multiple comparisons.
The model I used was aov(label ~ treatment * Position, data = .) for each metabolite. label is expressed as the proportion metabolites with a label incorporated at the respective position. Position is identified as the ordered carbon atom number (1, 2, 3, and so on). In particular, I am interested in the treatment:Position model term. A significant interaction would indicate that the label position is dependent on temperature treatment.
The code looked like this:
#Create an empty data frame to store the results
results_table <- data.frame(Compound = character(),
                            Effect = character(),
                            DF = numeric(),
                            SumSq = numeric(),
                            F_value = numeric(),
                            p_value = numeric())

#Loop over each compound in compound_list
for(compound in compound_list){

  #Fit the linear mixed effect model for each compound
  model <- fractions%>%
    filter(Compound==compound)%>%
    filter(isotope=="13C")%>%
    filter(Position>0)%>%
    mutate(Position=as.factor(Position))%>%

    aov(label ~ treatment * Position, data = .)

  #Extract the relevant coefficients for interaction of treatment x position
  anova_output <- anova(model)
  coef_summary <- tidy(anova_output)
  coef_summary <- as.data.frame(coef_summary)

  #Store the results in the results_table data frame
  results_table <- rbind(results_table, data.frame(Compound = compound,
                                                   Effect = coef_summary["term"],
                                                   DF = coef_summary["df"],
                                                   SumSq = coef_summary["sumsq"],
                                                   F_value = coef_summary["statistic"],
                                                   p_value = coef_summary["p.value"]))
}


results_table<-results_table%>%
  filter(!term=="Residuals")

#apply a p value correction (FDR) for multiple comparisons
results_table$adj_pvalues <- p.adjust(results_table$p.value, method = "fdr")

#view only p<0.05
results_table_sign<-results_table%>%
  filter(adj_pvalues<0.05)

head(results_table_sign)
There are 22 metabolites with significant treatment:position interactions.
 [1] "Aconitate"                "AMP"                      "Arginine-Glutamine"
 [4] "Citrulline"               "Fructose-6-phosphate"     "Glucose"
 [7] "Glucose-6-phosphate"      "Glutamine"                "Glycerophosphocholine"
[10] "Guanosine"                "Isocitrate"               "L-arginino-succinate"
[13] "Leucine"                  "NAD+"                     "Pantothenate"
[16] "Phenylalanine"            "Pyruvate"                 "Sorbitol"
[19] "Thymidine"                "Tryptophan"               "UDP-D-Glucose"
[22] "UDP-N-acetyl-glucosamine"
There are a few compounds that I find interesting in this list. Arg-Glutamine is interesting because we see it as an important differentiating metabolite in both pool size and labeling/enrichment analyses. F6P and G6P, important glycolysis intermediates are differentially labeled as is glucose. Pyruvate, an end product of glycolysis is also differentially labeled. This will require some knowledge of biochemistry to track down where each of these differentially labeled positions are coming from. Here are plots that visualize the labeling patterns for these interesting metabolites:
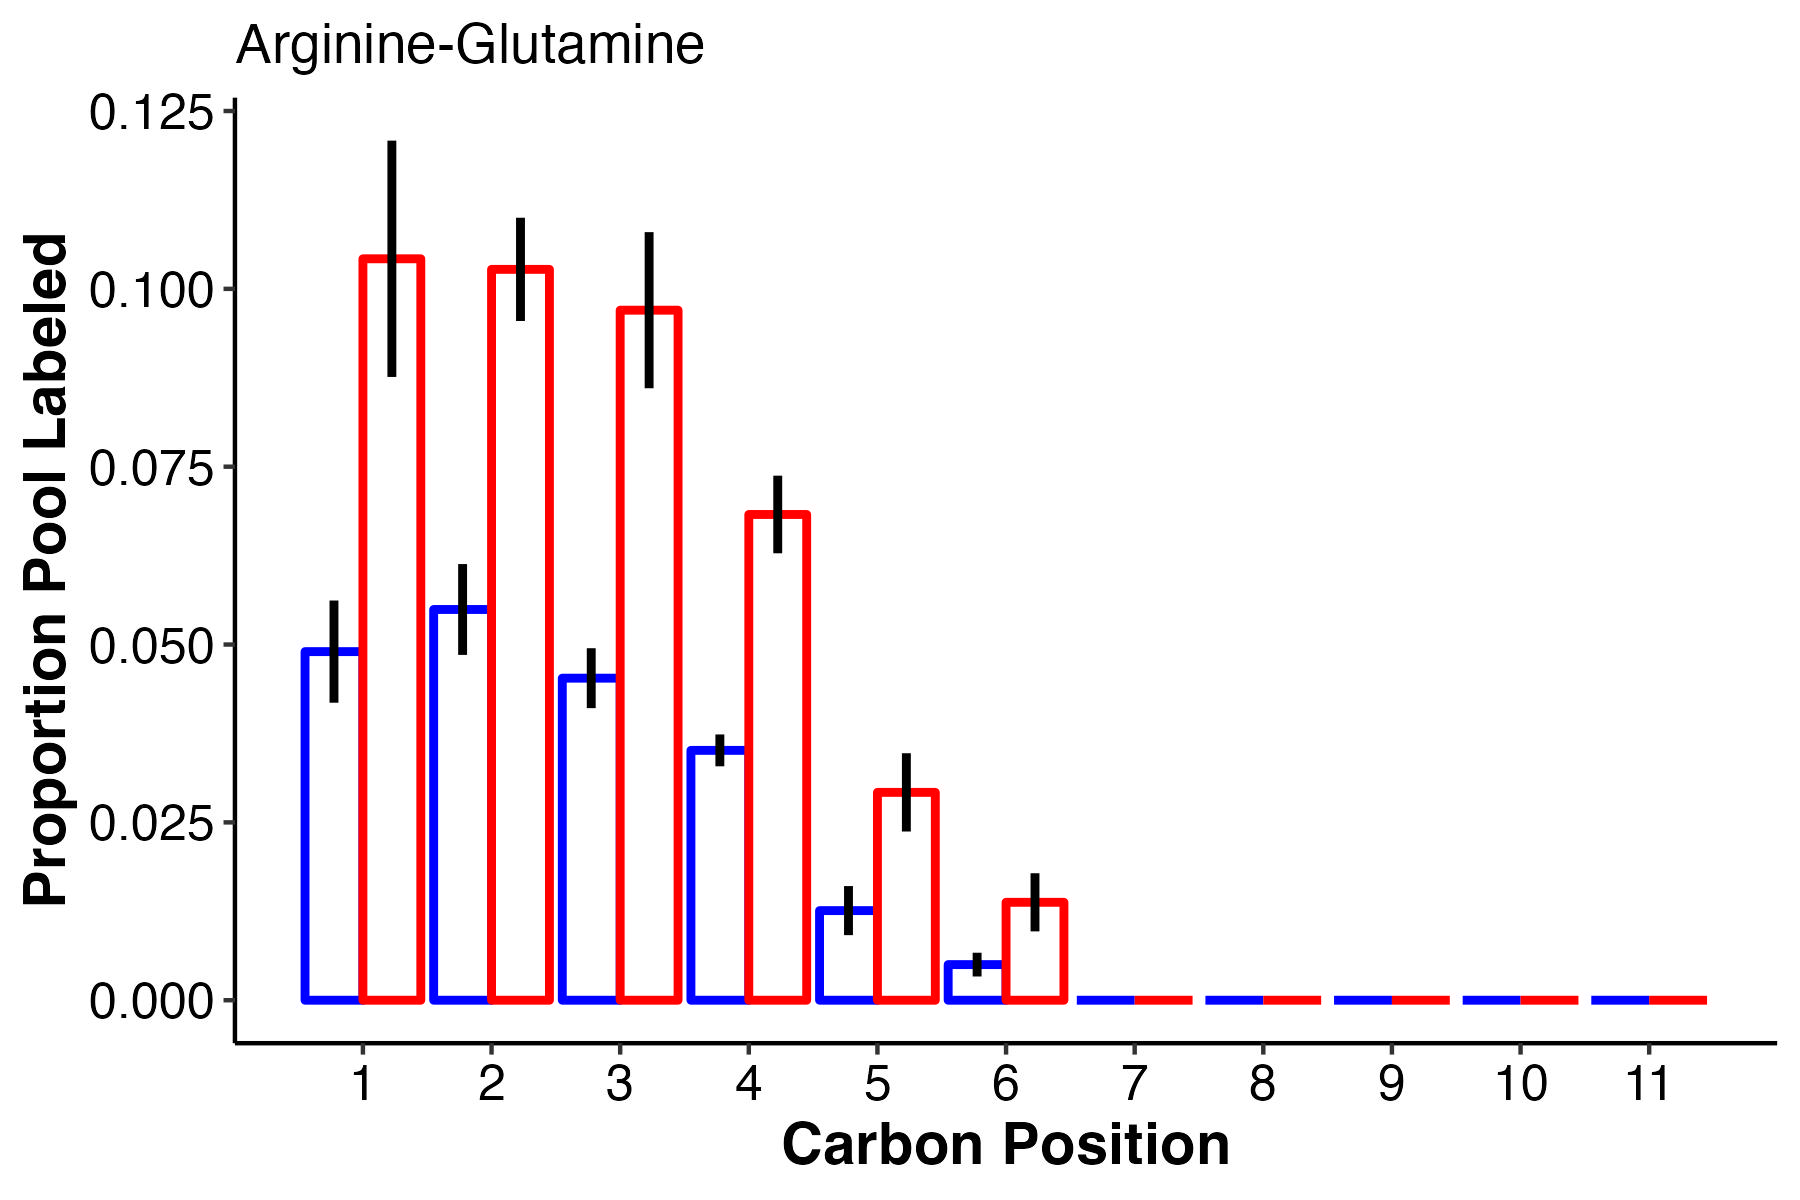
This shows that at carbons 1-6, arg-glu has more label incorporation at high temperature, with no labeling in carbons 7 and greater.
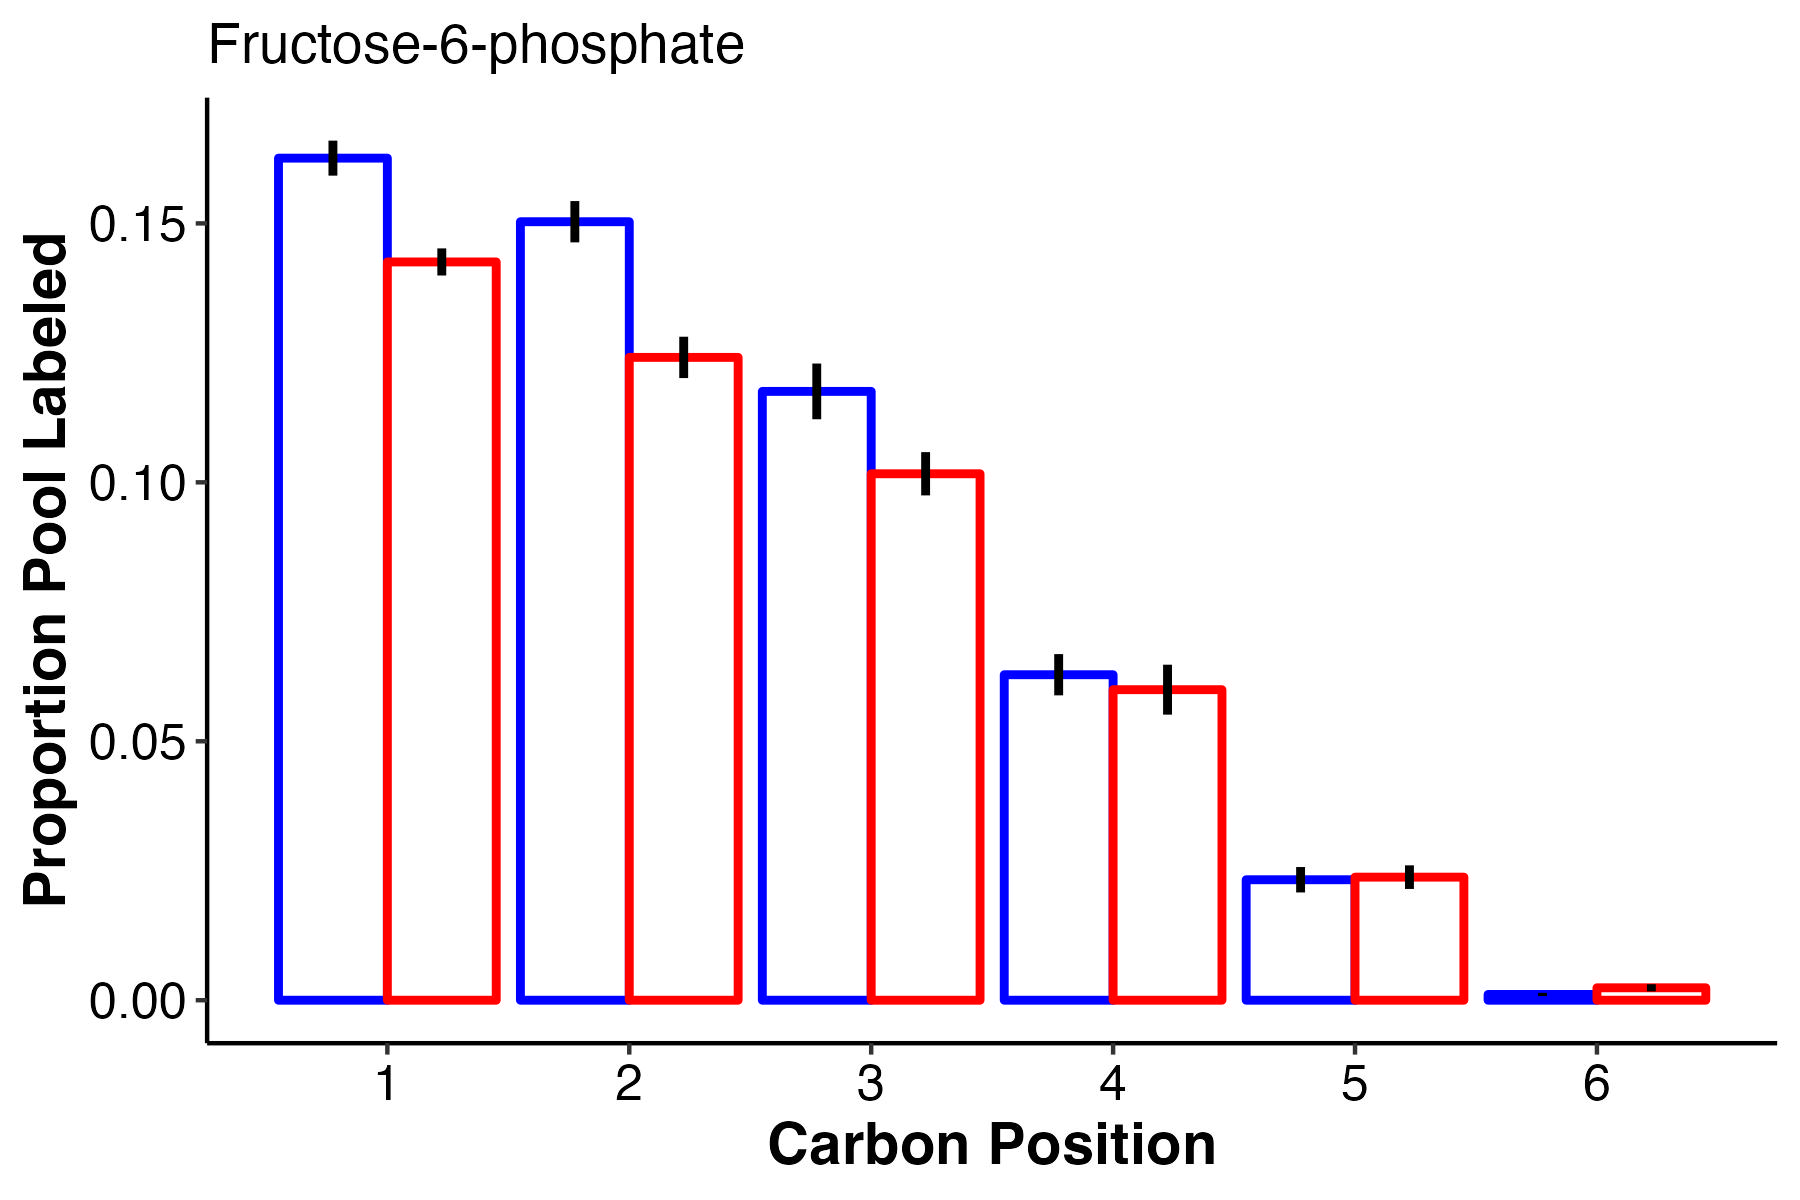
F6P, a glycolysis intermediate, has higher labeling in the first 3 carbons at ambient temperature, but equal labeling at carbons 4-6.
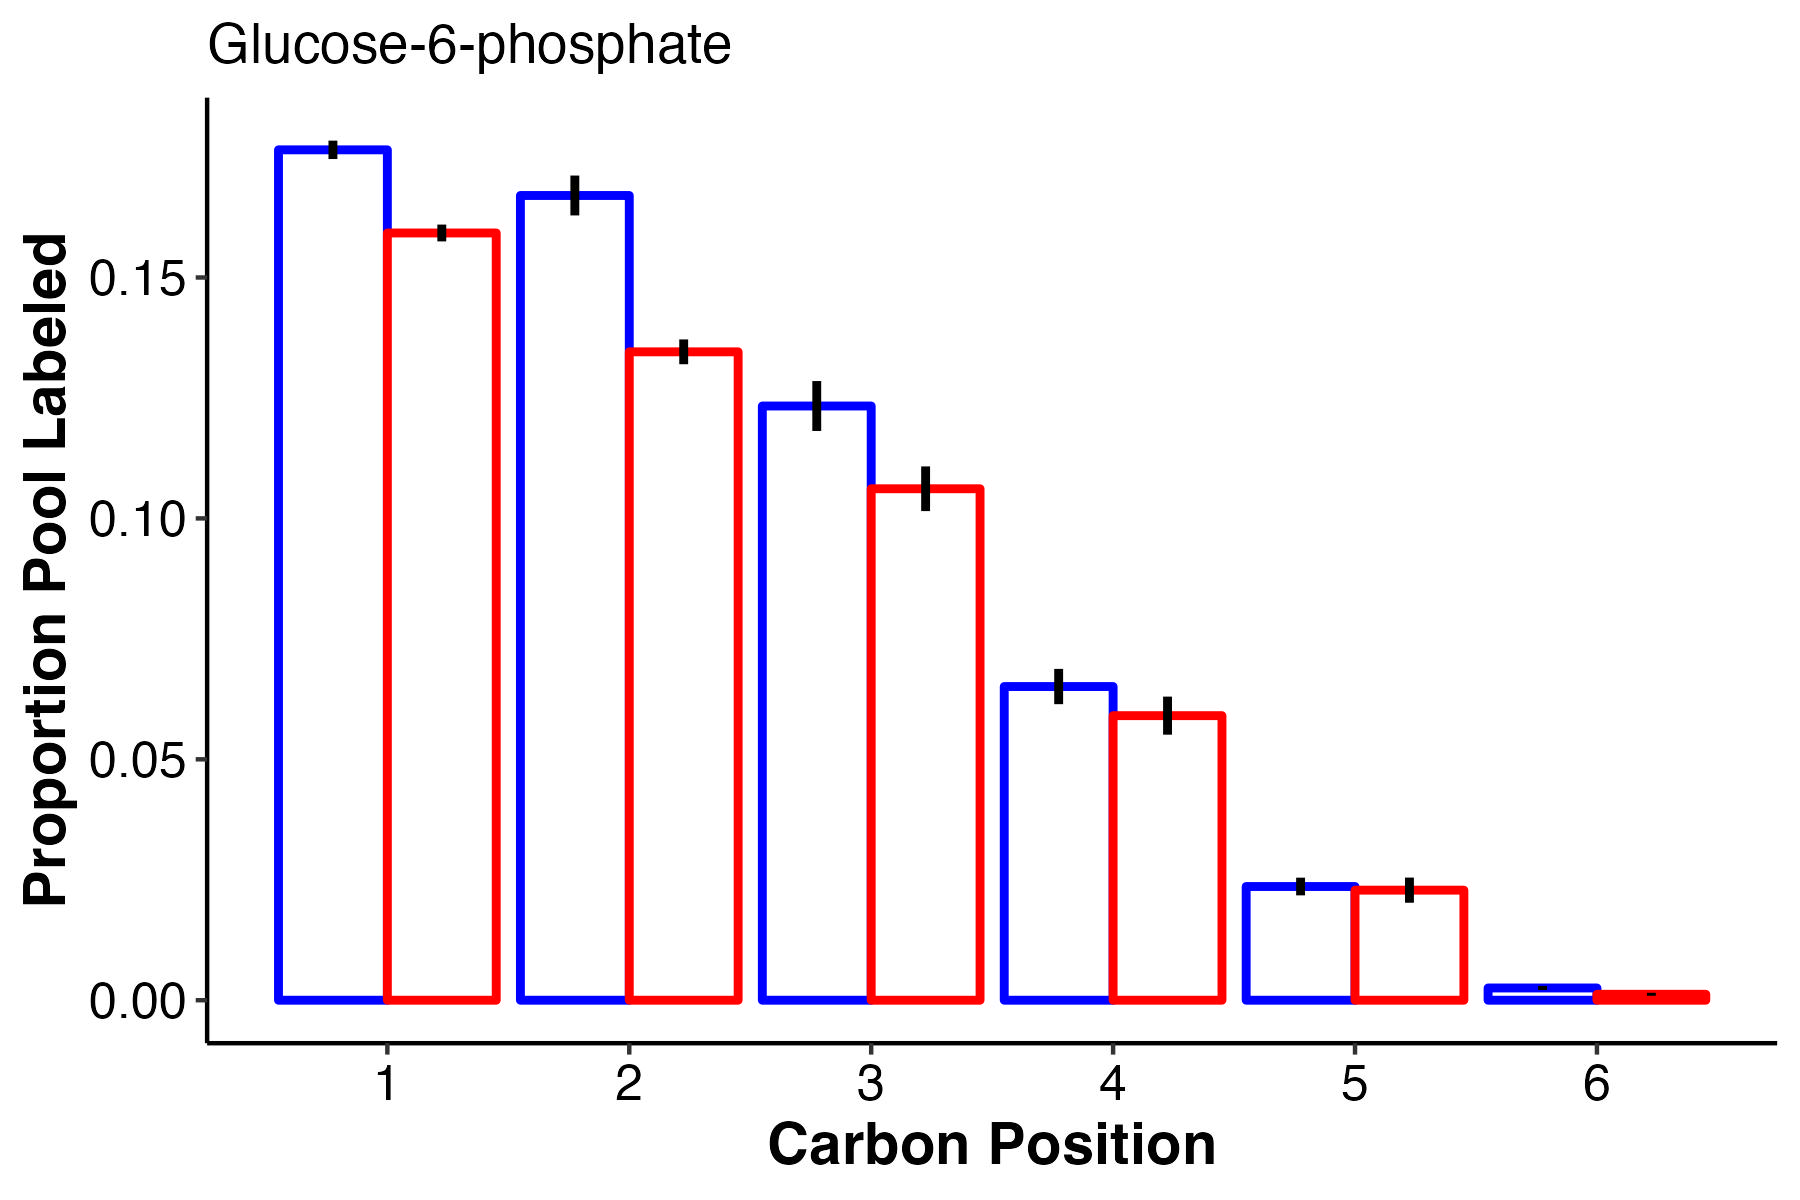
Another glycolysis intermediate, G6P also has higher labeling at carbons 1-3 with equal labelign in carbons 4-6.
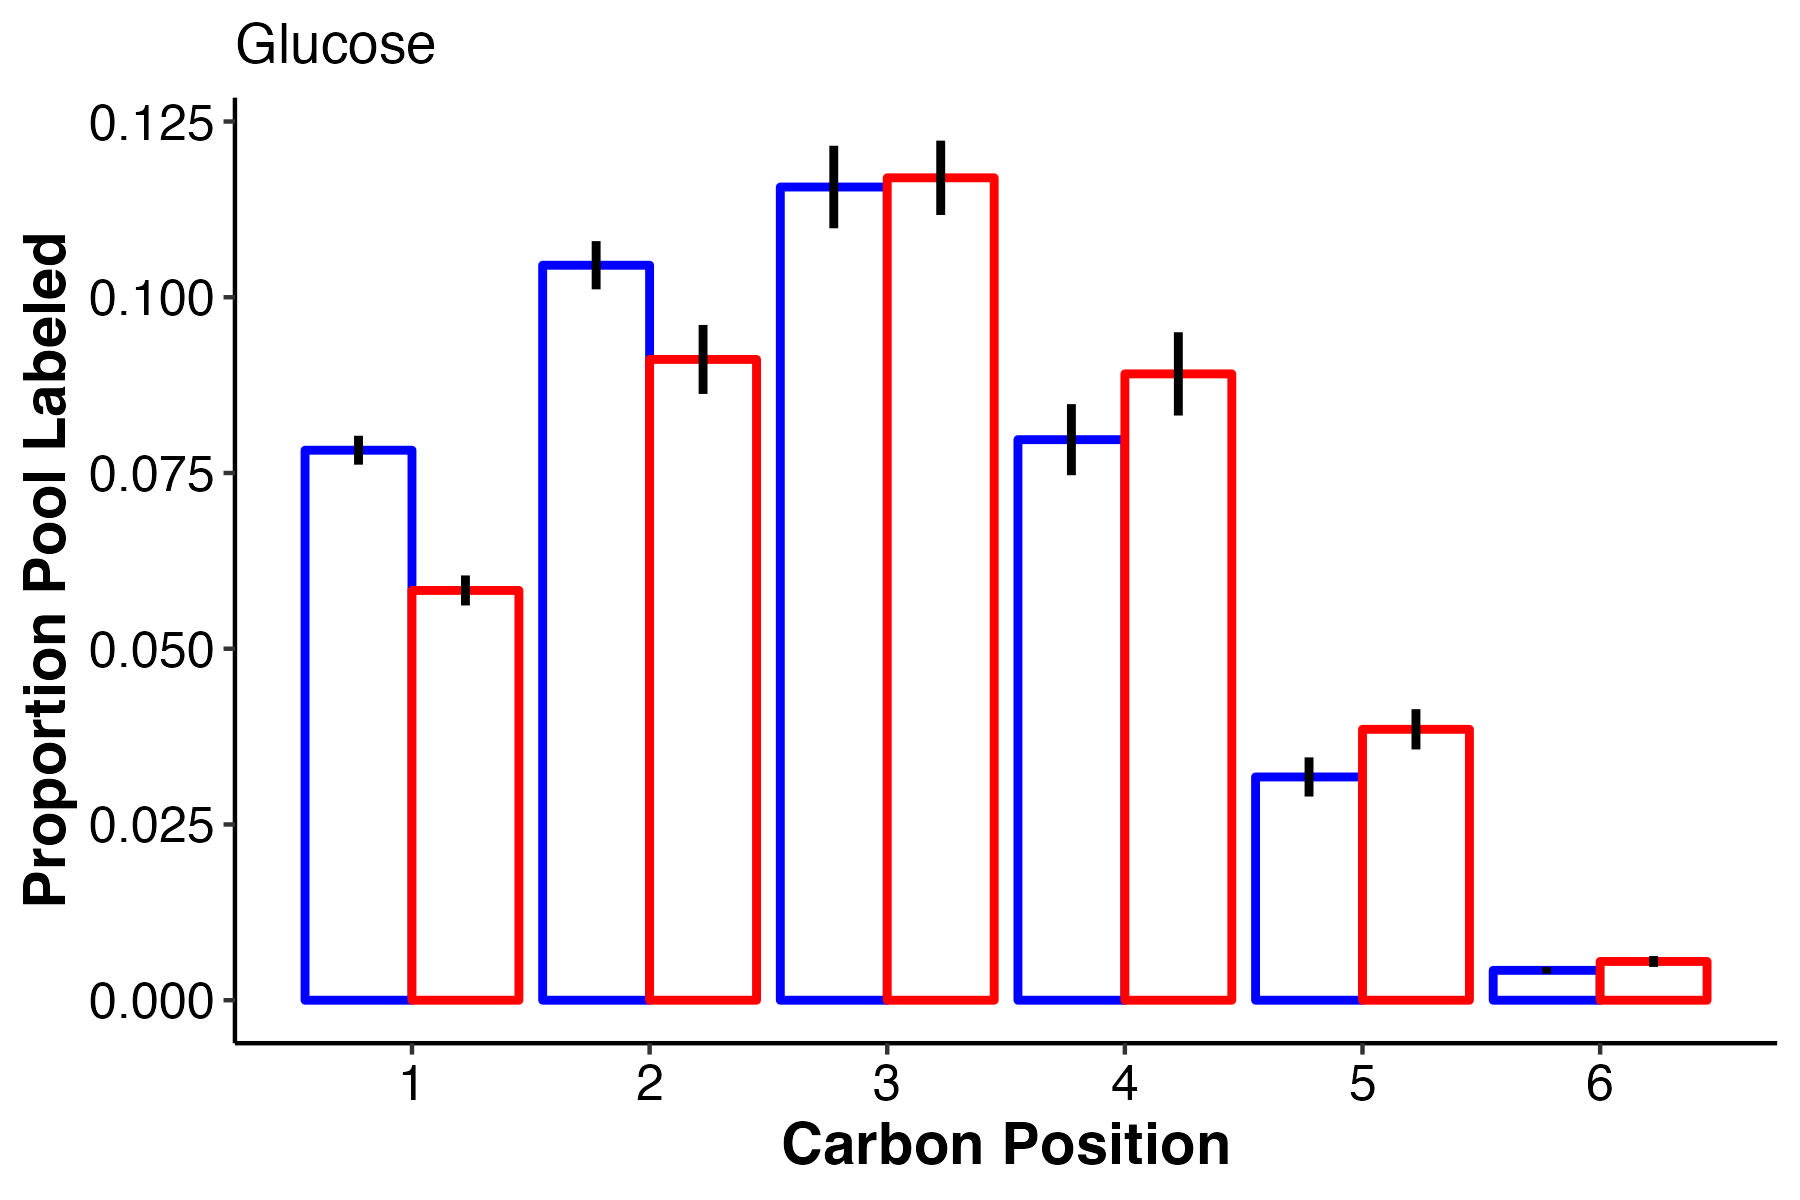
Glucose labeling is really interesting! At ambient temperature, the first 2 carbons have higher label incorporation. However, carbon 3 is equal in labeling with slightly higher labeling at high temperature in carbons 4-6. What does this tell us about glucose synthesis and translocation?
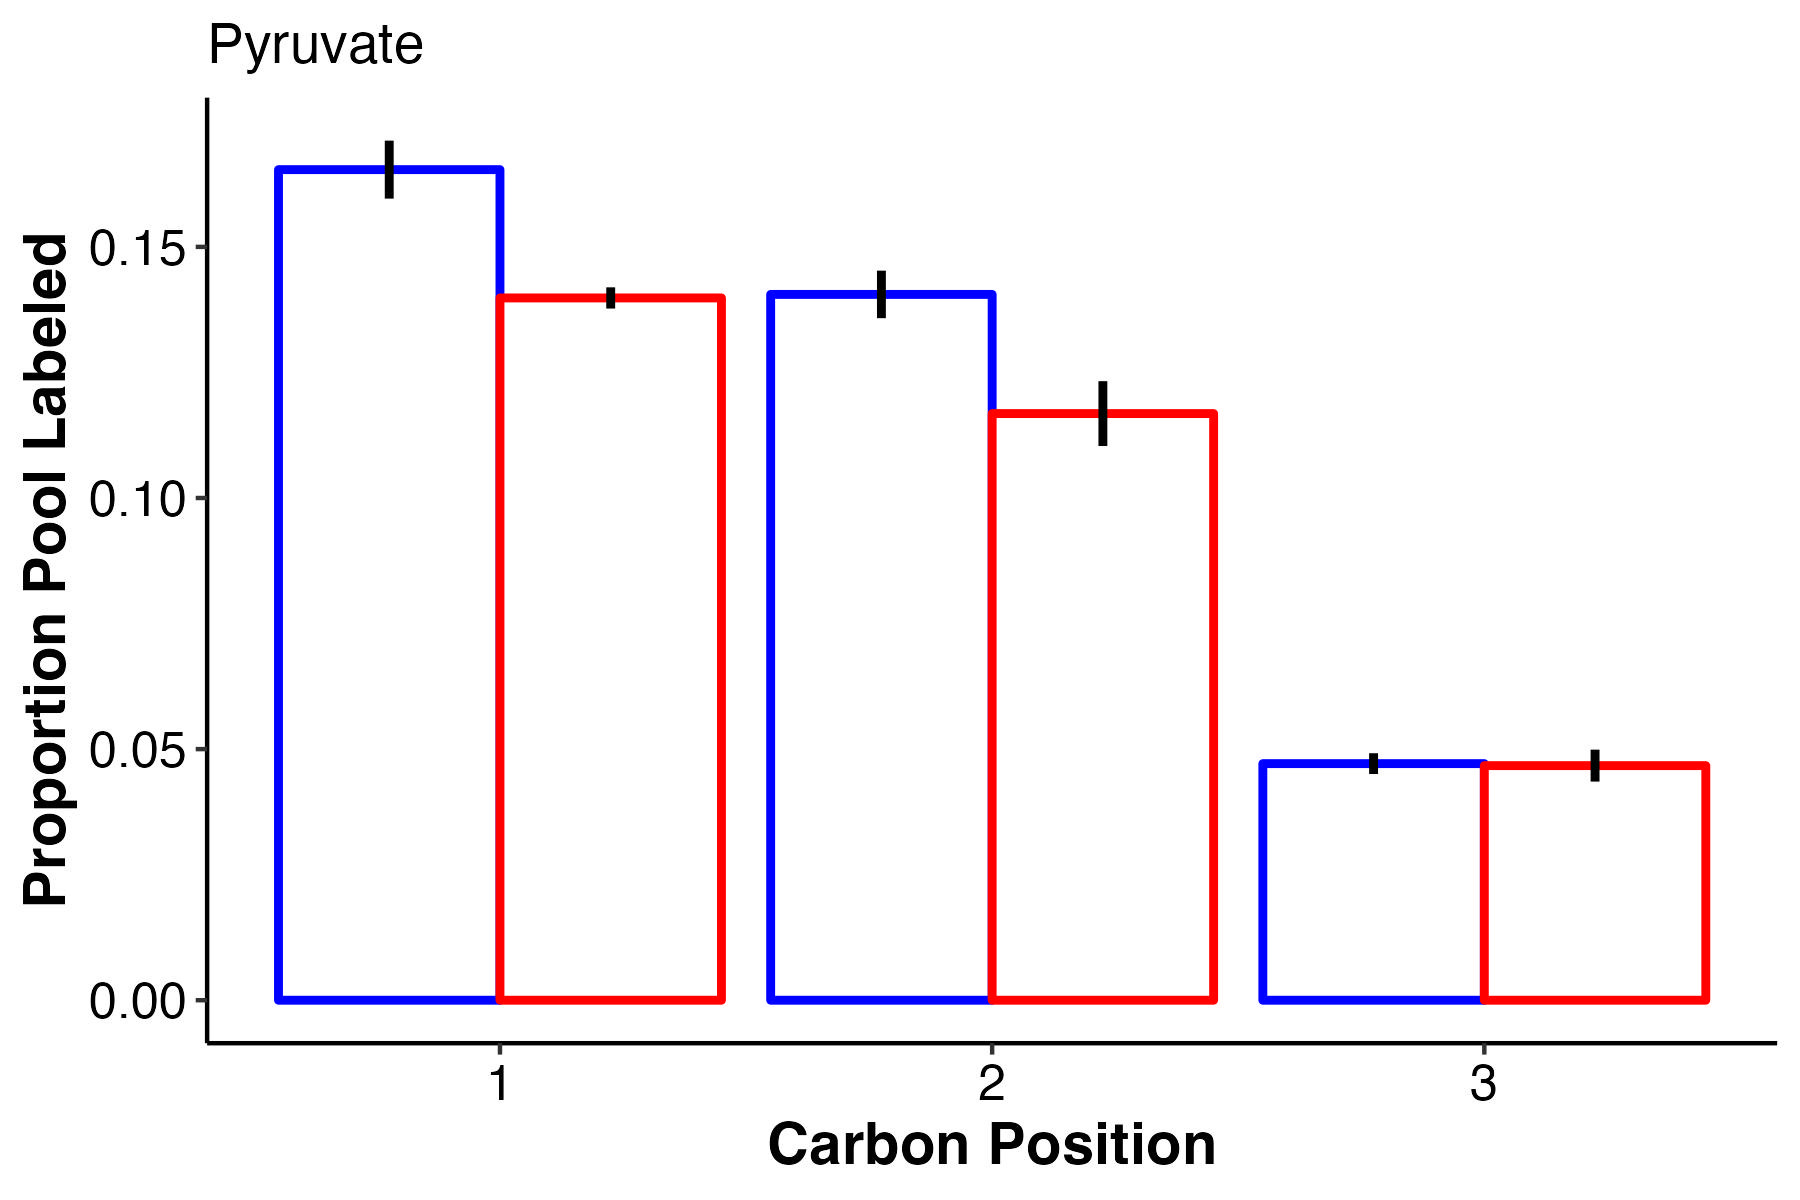
Pyruvate has lower labeling at high temperature for carbons 1 and 2 and no difference in carbon 3.
These results are interesting and I want to know more about what label position can tell us about biosynthesis and metabolism rates and pathways.
8. How does temperature treatment affect metabolite pool size and enrichment/labeling and what does this tell us about metabolic pathways?
To get an idea of how metabolic pathways are shifting, I mapped out the pathways of interest and looked at pool size and label incorporation. For this, I am using proportion labeling but will revisit these pathways with enrichment data as well.
Labeling vs pool size - expectations and observations
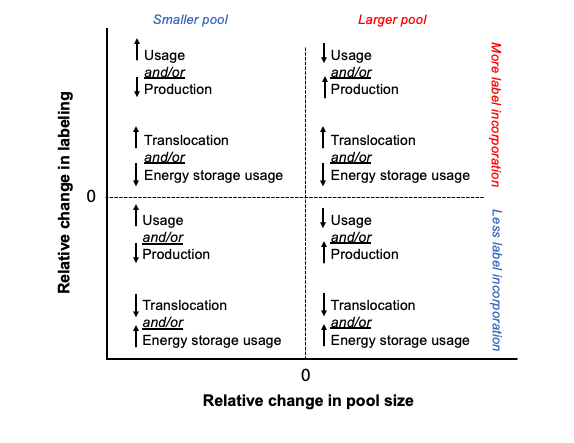
It is important to look at pool size and labeling to understand the turnover and usage of metabolites and progression of pathways. Here, I have shown a framework for the relationship between pool size and labeling. In our context, increased pool size could mean either increased production of a metabolite OR decreased downstream usage and therefore accumulation. Increased labeling could mean increased incorporation of translocated carbon OR decreased use of non-labeled carbon from energy stores and vice versa. If the pool size of a metabolite remains unchanged, but the labeling increases, that suggests that the rates of production and usage are equal, and therefore there is higher turnover of the metabolite resulting in more labeled carbon incorporation during our short term incubation. In contrast, if there is no change or a reduction in labeling along side increased pool size, this would suggest an accumulation of the metabolite and a reduced rate of metabolism/usage of that metabolite. Both increased label and increased pool size could indicate that production as well as turnover is elevated.
This is the general framework that I am thinking about when interpreting the data below.
There are groups of metabolites that fall into each of these categories when we look at both enrichment (top) and labeling proportion (bottom).
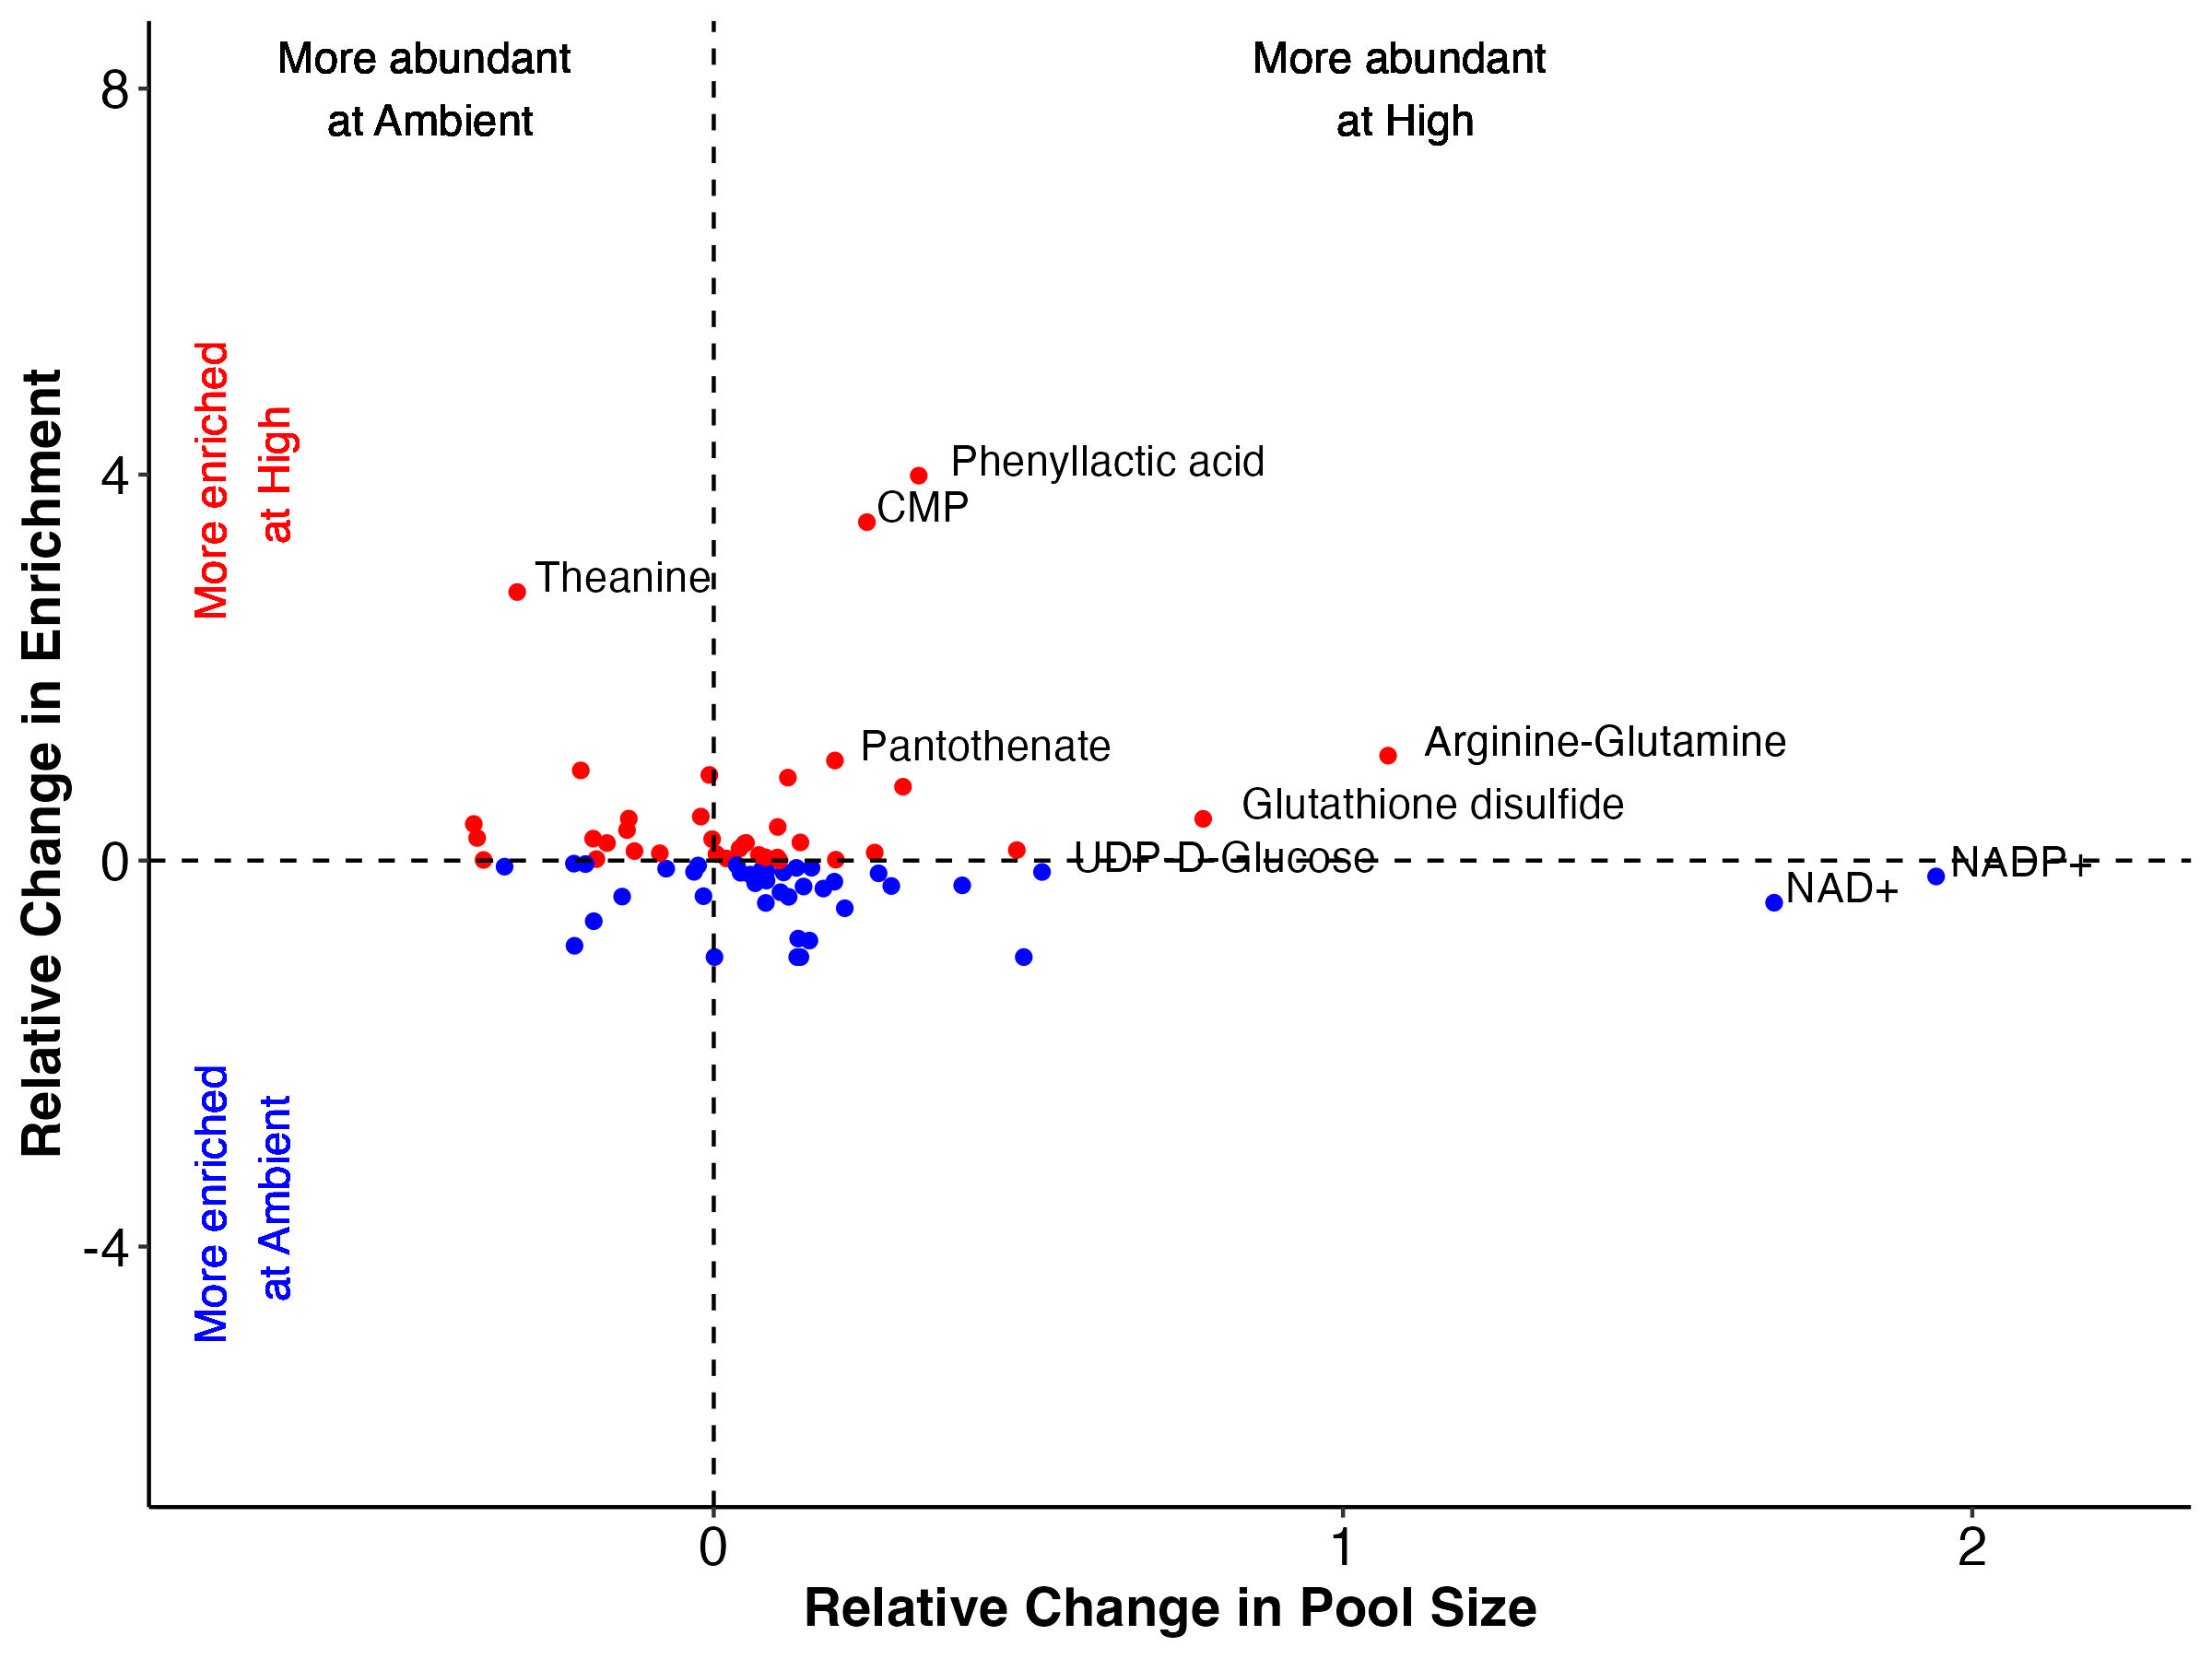
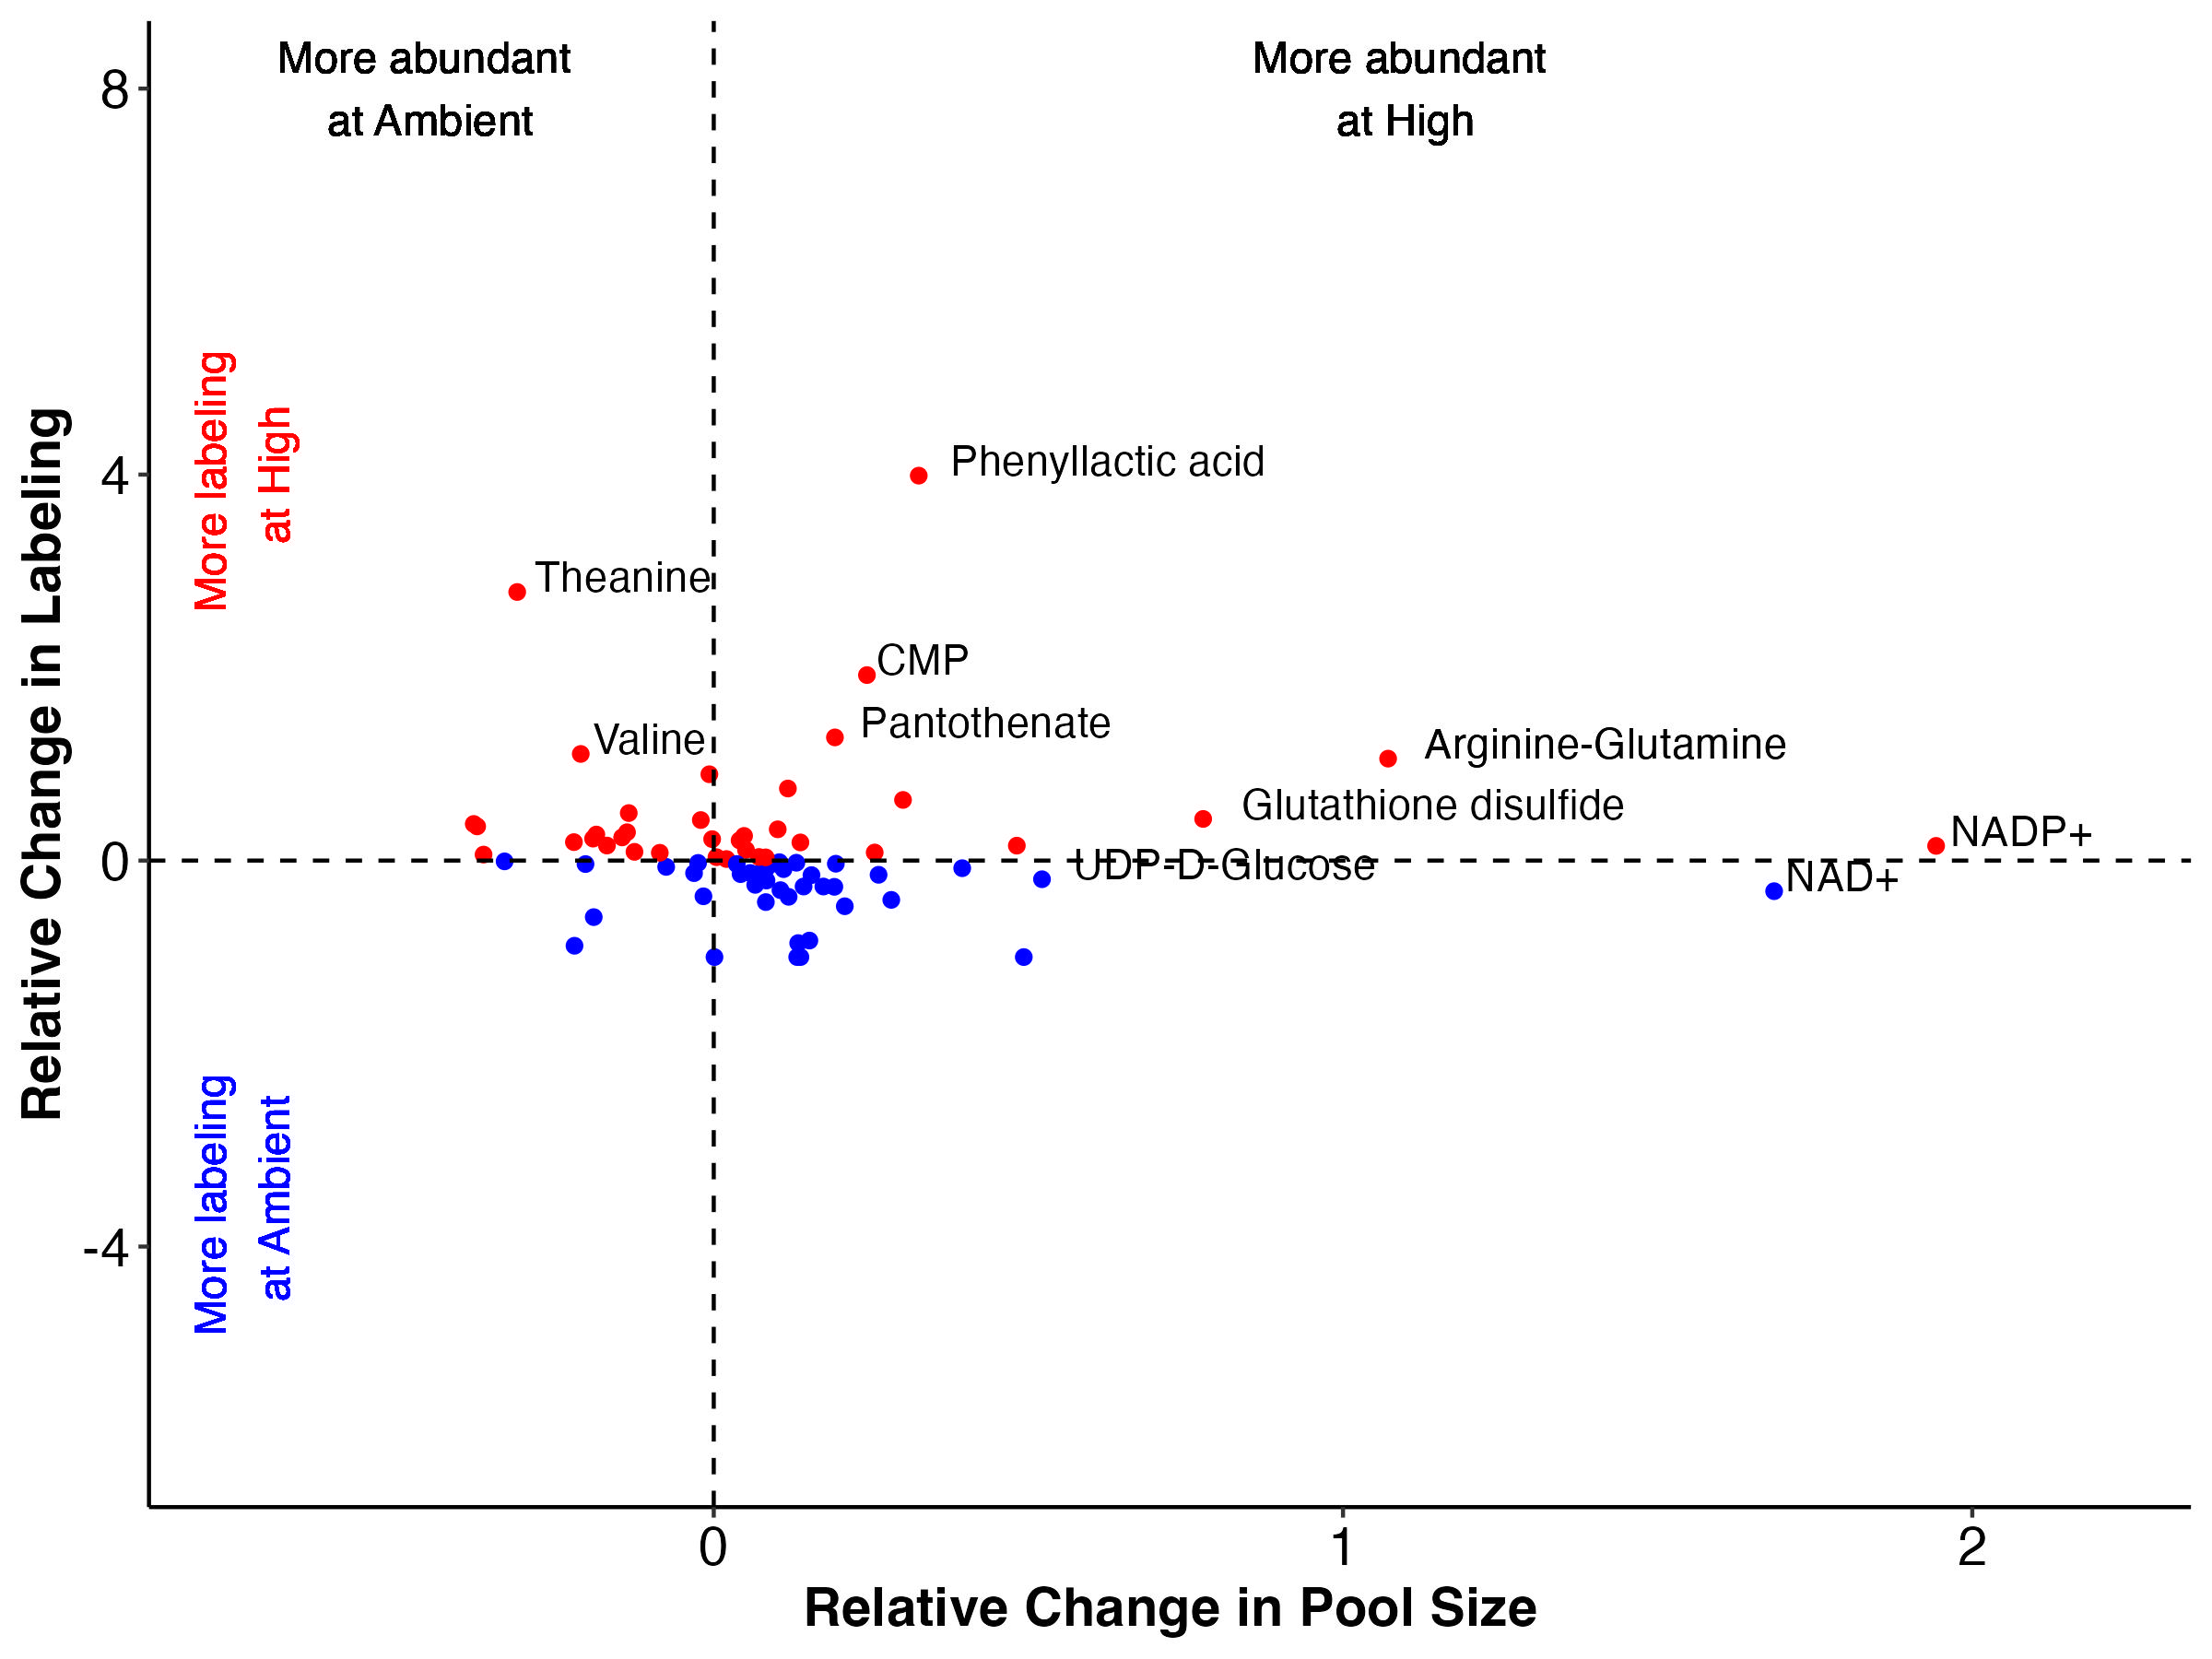
Note that I have removed Montiporic acids from these plots due to scale but will return to them in future analysis.
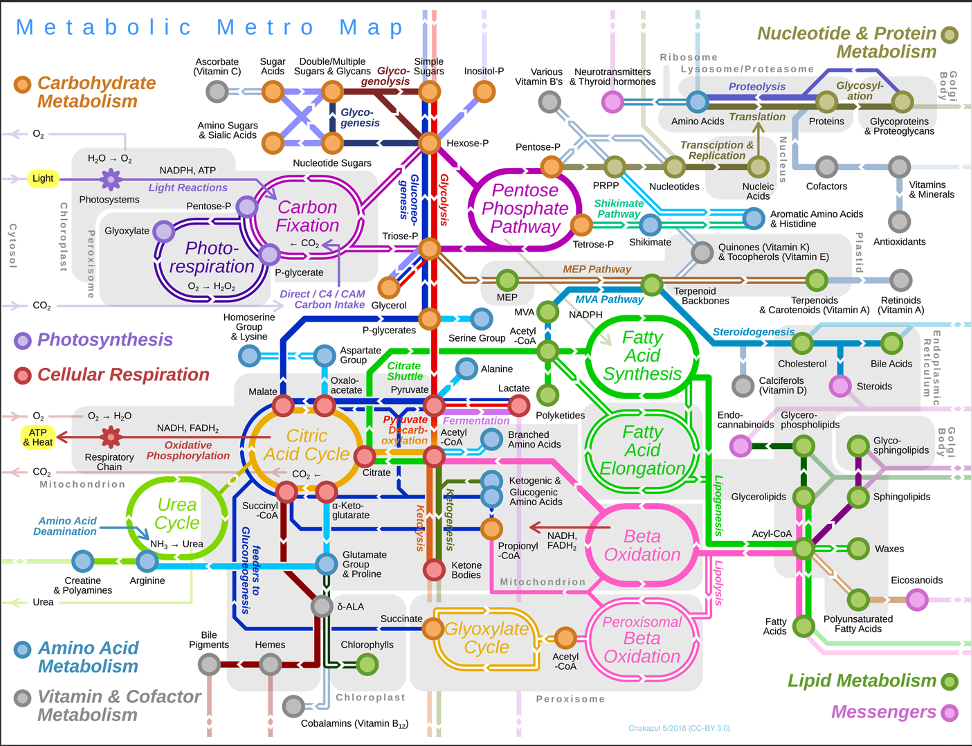
Viewing metabolic pathways
Next, I put our data in the context of metabolic pathways.
For all metabolic pathways that I show below, I use squares (labeled P for pool size and L for labeling) to show differential effects. If the P square is colored red, that indicates that the pool size of that metabolite is higher at high temperature. If it is colored blue, it is higher at ambient temperature. If the L square is colored red, the labeling proportion for that metabolite is higher at high temperature. If it is blue, it has a higher label proportion at ambient temperature.
For each of these pathway plots, the P and L squares are colored based on VIP analysis from above. I have included a plot for each metabolite showing mean pool size and labeling proportion between treatments. I have also shown the carbon position plots and included a star if there is a significant treatment:position interaction on carbon position labeling.
Glycolysis
Here is a representation of the glycolysis pathway and metabolites that we have detected in our data set. Glycolysis is the key central carbon metabolism pathway to metabolize glucose.
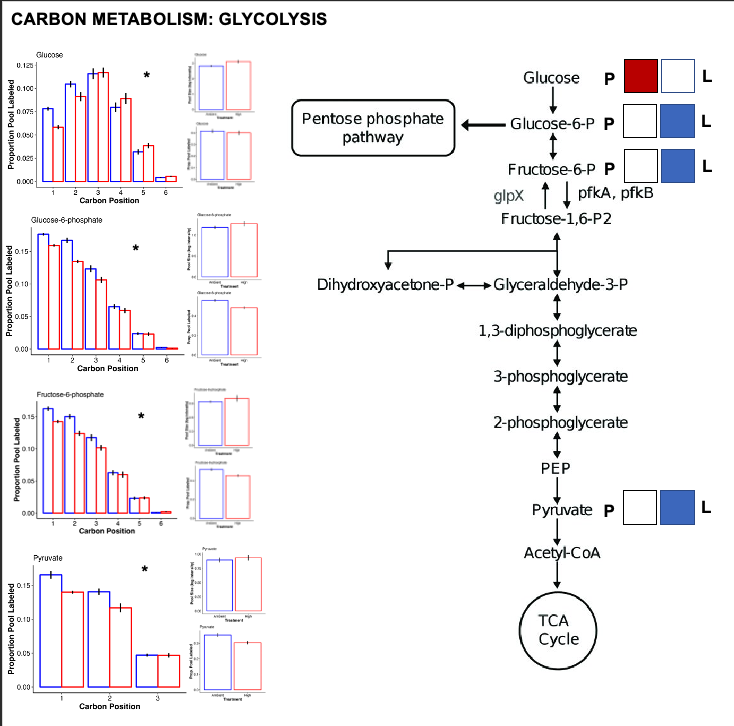
- There is increased pool size of glucose at high temperature, but no change in labeling. This suggests accumulation of glucose either through reduced downstream metabolism or upstream production.
- There is no difference in pool size but there is higher label incorporation of glucose-6-phosphate, fructose-6-phosphate, and pyruvate, which are key intermediates of glycolysis.
- This suggests that there is higher turnover of these intermediates and therefore a greater rate of glycolysis at ambient temperature as compared to high temperature.
- Together, this suggests that glycolysis progresses at a lower rate at high temperature with likely no change in the translocation of glucose from the symbiont (no change in the label of glucose).
- However, it is super interesting to note that there is a difference in label incorporation by position in glucose. Carbons 1 and 2 are higher labeled in ambient temperature and carbons 4 and 5 are more labeled at high temperature. I am not sure what this means and I need to look at glucose biosynthesis to understand differences in biosynthesis pathways for glucose. Perhaps this means that symbiont production of glucose shifts at high temperature.
- Perhaps the source of glucose under high vs ambient temperature is different - are larvae producing glucose by metabolizing lipid/fatty acid stores through gluconeogenesis at high temperature as opposed to translocation at ambient? Would this show up by differential carbon position labeling?
Pentose phosphate pathway
The pentose phosphate pathway is responsible for metabolizing glucose-6-phosphate to generate NADPH and pentoses as well as precursers for nucleotide synthesis. This is primarily an anarobic pathway (building and synthesizing) rather than catabolic (metabolizing).
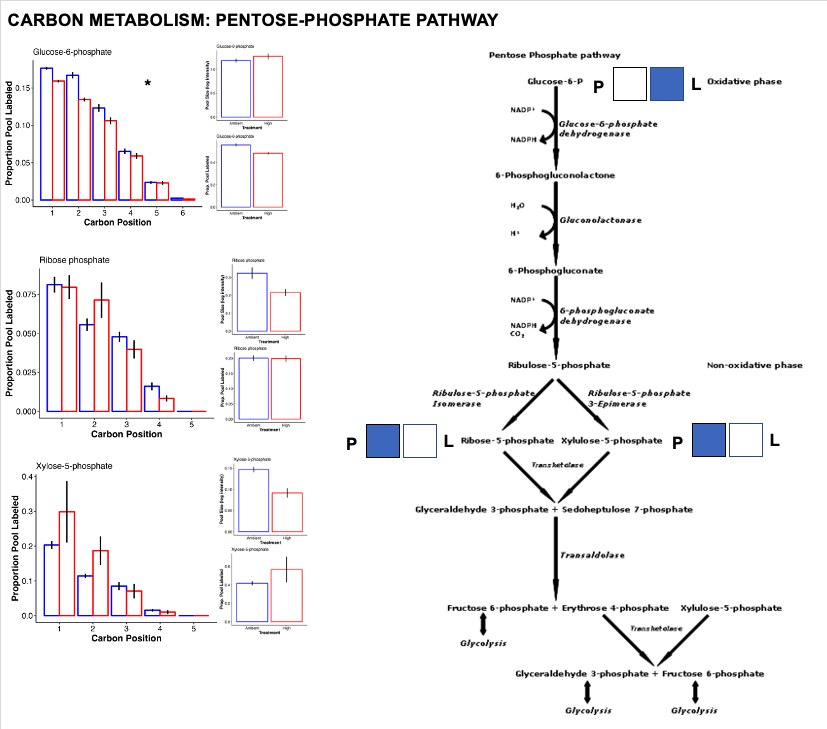
- Here, we see increased labeling in G6P as described above for glycolysis. Once in the PP Pathway, there is a higher pool size of end products ribose-5-phosphate and xylulose-5-phosphate.
- This suggests there is accumulation and/or higher production of these products at ambient temperature.
TCA cycle
After glycolysis, pyruvate to acetyl CoA enters the TCA/citric acid/Krebs cycle to release stored energy through acidation of acetyl CoA generated through carbohydrate, fat, or protein metabolism.
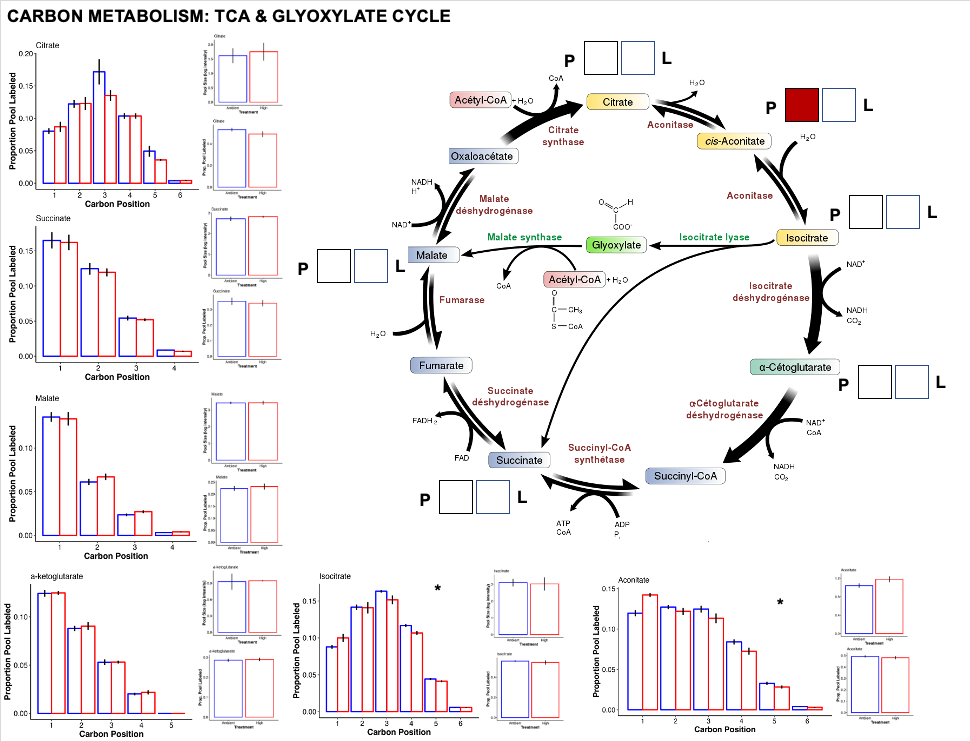
- Interestingly, we do not see large chagnes in the TCA cycle. This could be due to shifts in the allocation of energy between high and ambient temperature.
- Even if glycolysis is running at a greater rate at ambient temperature, metabolism of stored carbohydrates or fats at high temperature could keep the TCA cycle running at a constant rate, resulting in little changes in metabolite pools and labeling.
- There was one metabolite, Aconitate that has a higher pool at high temperature. Perhaps this represents a step in the TCA cycle where there is accumulation by limitation in the rate of aconitase to convert aconitate to citrate or isocitrate.
- The glyoxylate cycle was differentially enriched as a pathway in our analysis above. It could be that the change in aconitate pool size is related to the rate of the glyoxylate cycle. This is something I need to look into further.
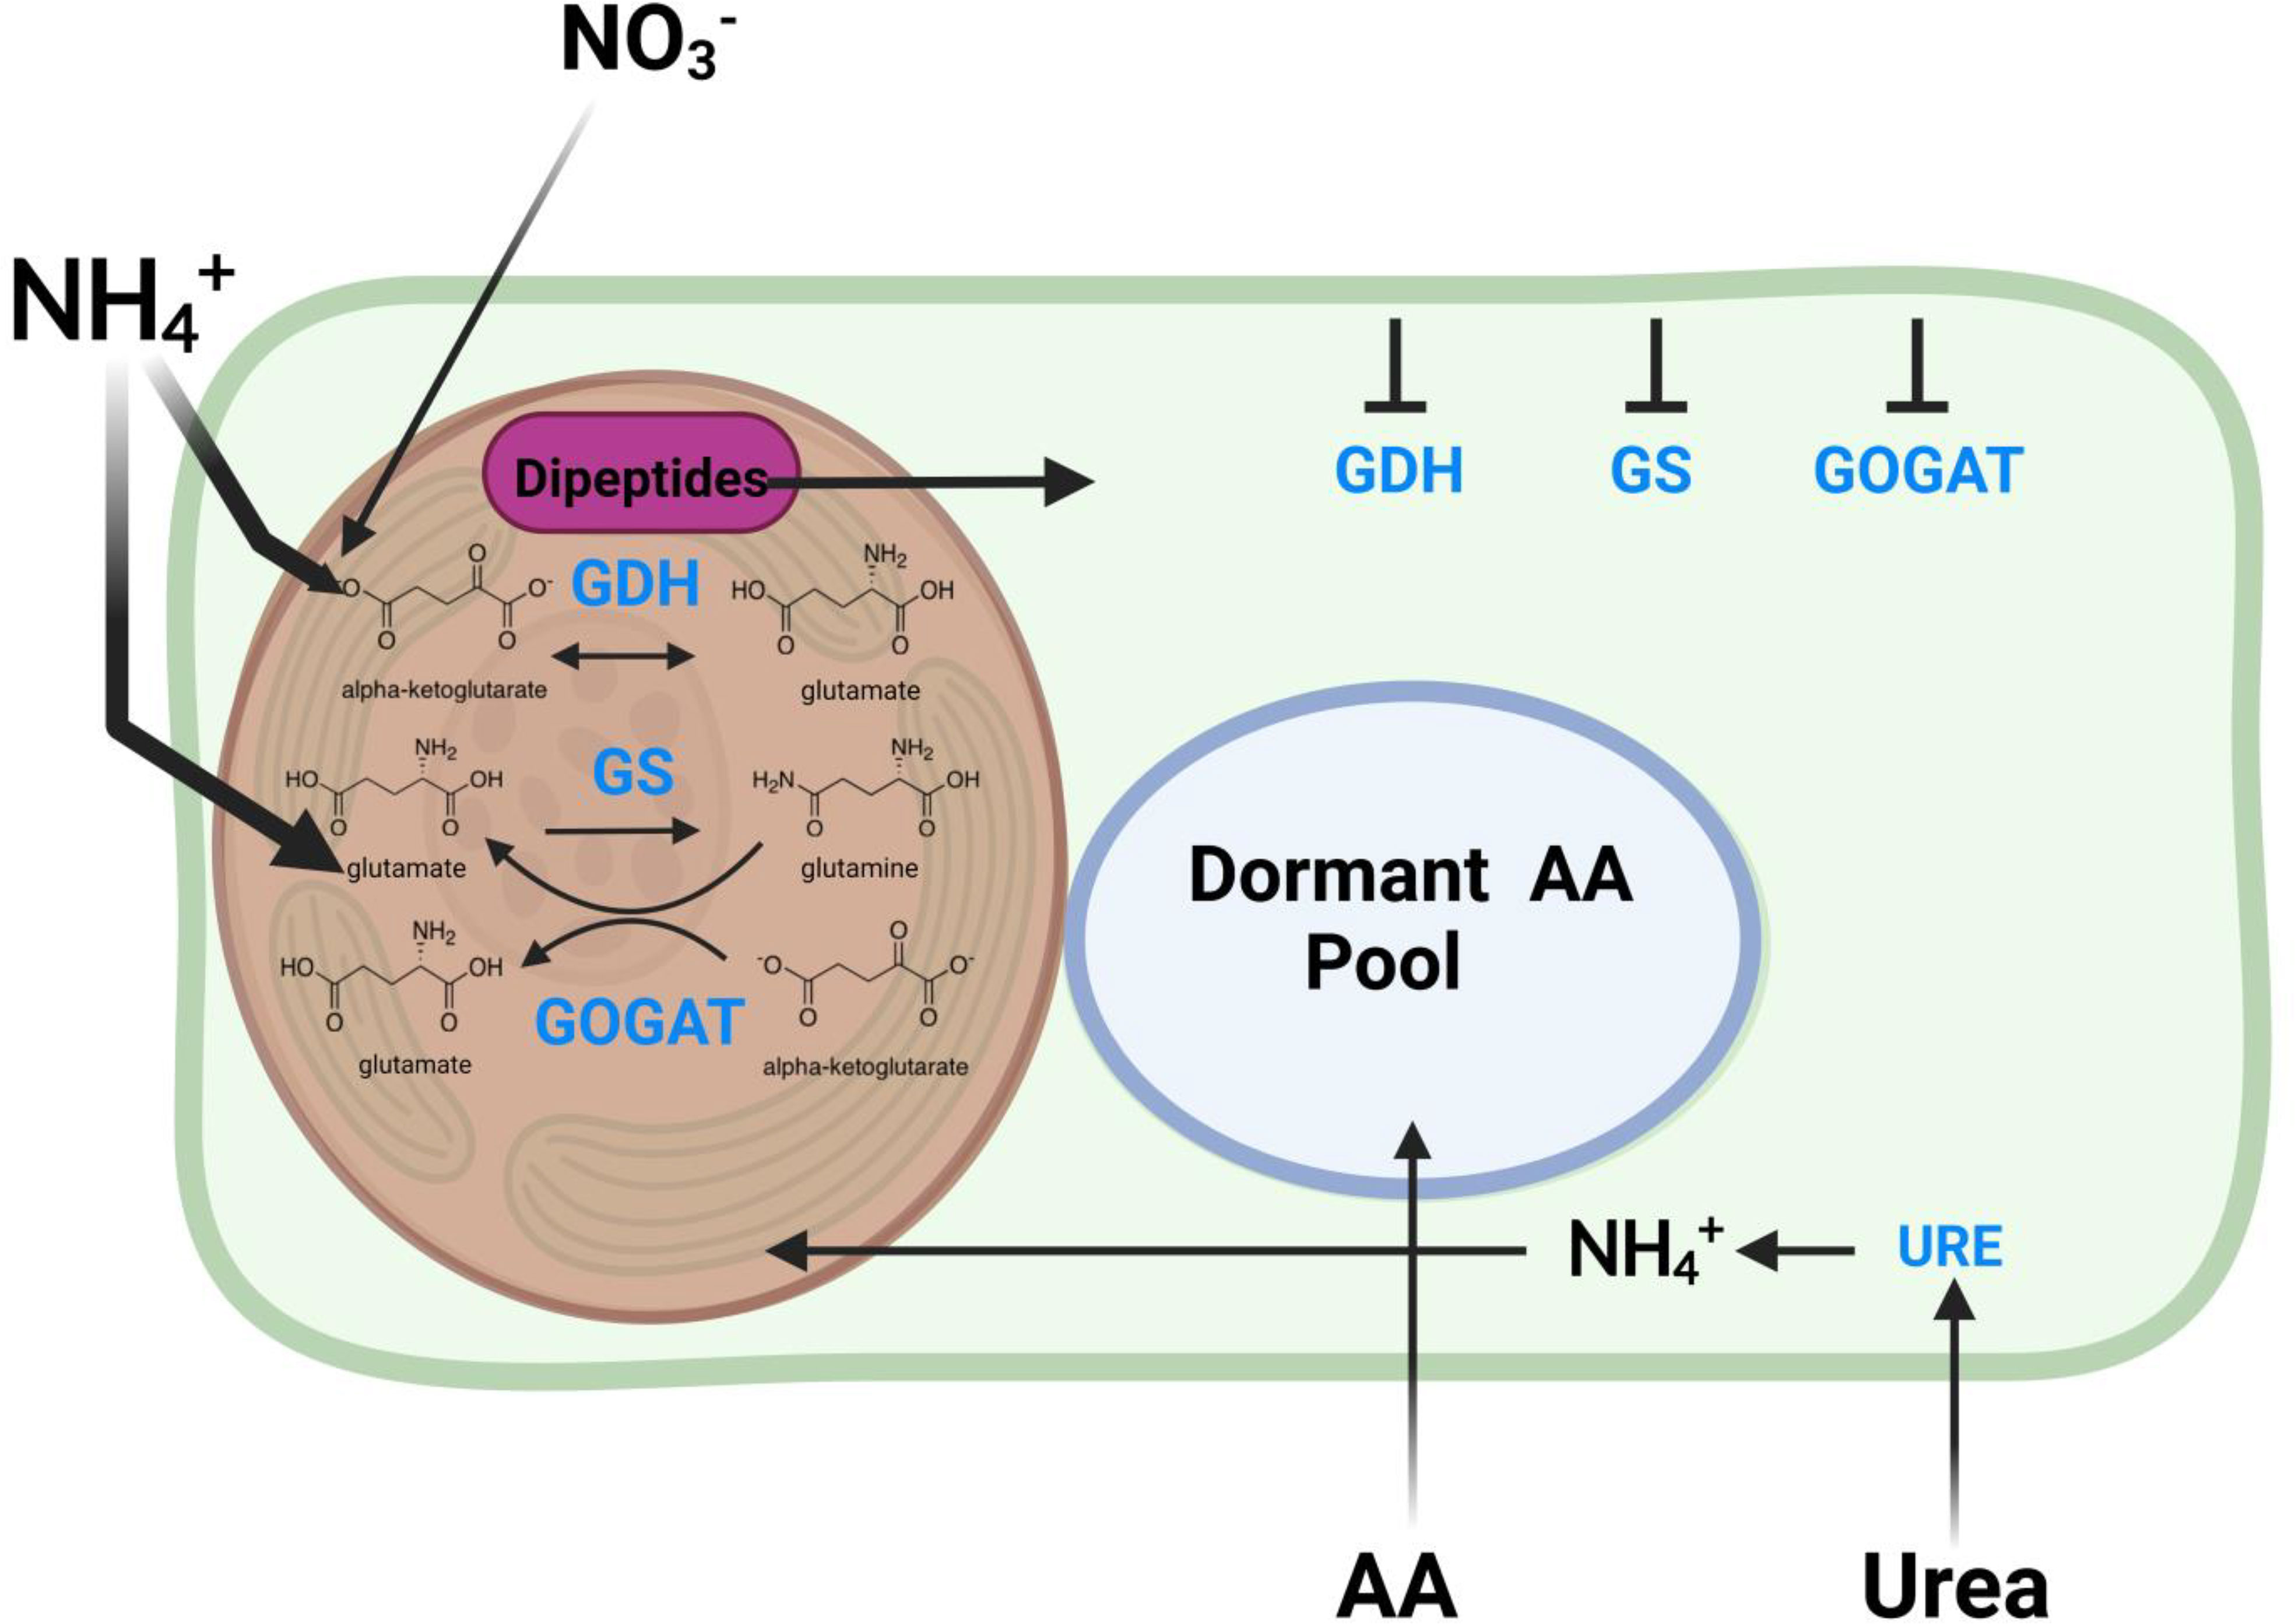
Nitrogen metabolism
Nitrogen metabolism is one of the most impacted pathways in this study. In corals, the GOGAT/GS pathways are critically important for nitrogen assimilation (ammonium assimilation) and balance between host and symbiont that strongly impacts symbiont substrate availability for growth and productivity.
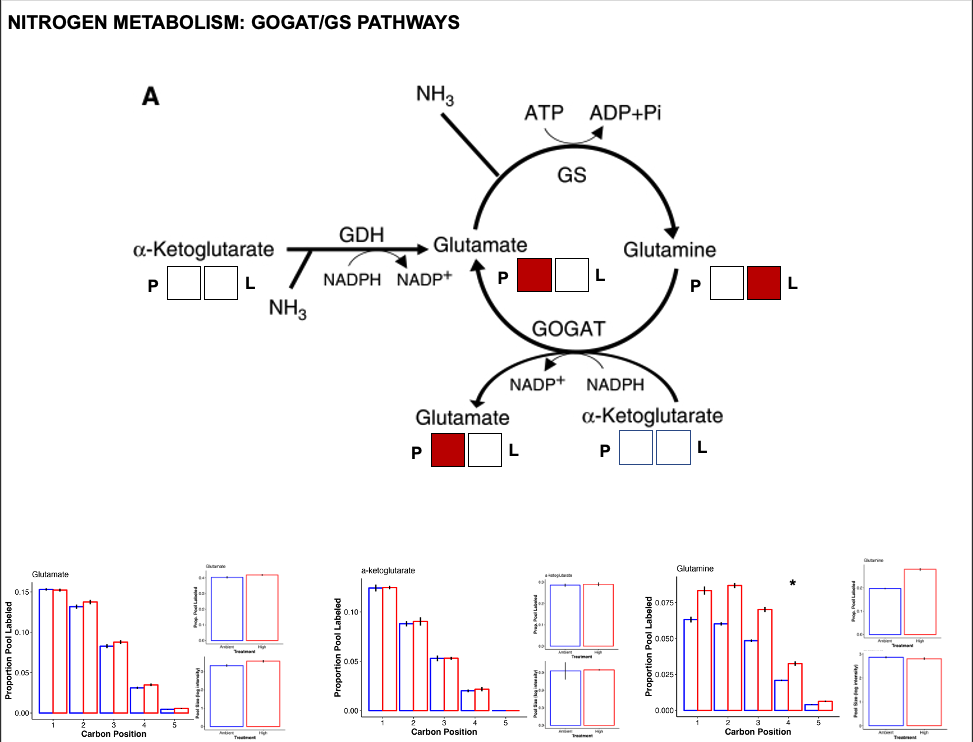
- There is a greater pool of glutamate at high temperature but higher labeling in glutamine at high temperature.
- There was no difference in pool or labeling of a-ketoglutarate.
- This suggests a higher turnover of glutamine as well as higher accumulation of glutamate. This suggests higher activity of the GOGAT pathway that converts glutamine to glutamate.
- This also supports our observation of increased pool size of NADP+, which is produced through GOGAT.
- Additionally, increased glutamate pools could be due to higher GDH activity, which would assume that a-ketoglutarate pools are being kept constant by upstream pathways.
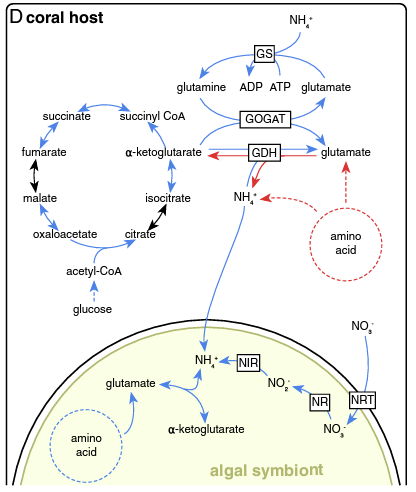
Radecker et al. 2020: paper link
- This study found lower expression of glutamate synthase (GS) and lower expression of glutamine oxoglutarate aminotransferase (GOGAT) under heat stress. Interestinly, they also found lower anabolic activity of glutamine dehydrogenase (GDH) and higher catabolic activity under stress. Glutamine synthase incorporates ammonium into glutamate to generate glutamine. The GOGAT pathway takes glutamine and alpha-ketoglutarate and generates glutamate. GDH converts glutamate to or from alpha-ketoglutarate by the addition or removal of ammonium. These three pathways are responsible for nitrogen cycling and availability in the host.
- Our data suggests increased GOGAT in contrast to this study. I would like to dig into this pathway more and see how this compares to the literature.
Radecker et al. 2020
Dipeptides
Previous work (e.g., Chiles et al. 2022, Williams et al. 2021, below) has found that under temprature stress, there is accumulation of dipeptides in corals. We found something similar in our study with the accumulation of arginine-glutamine.
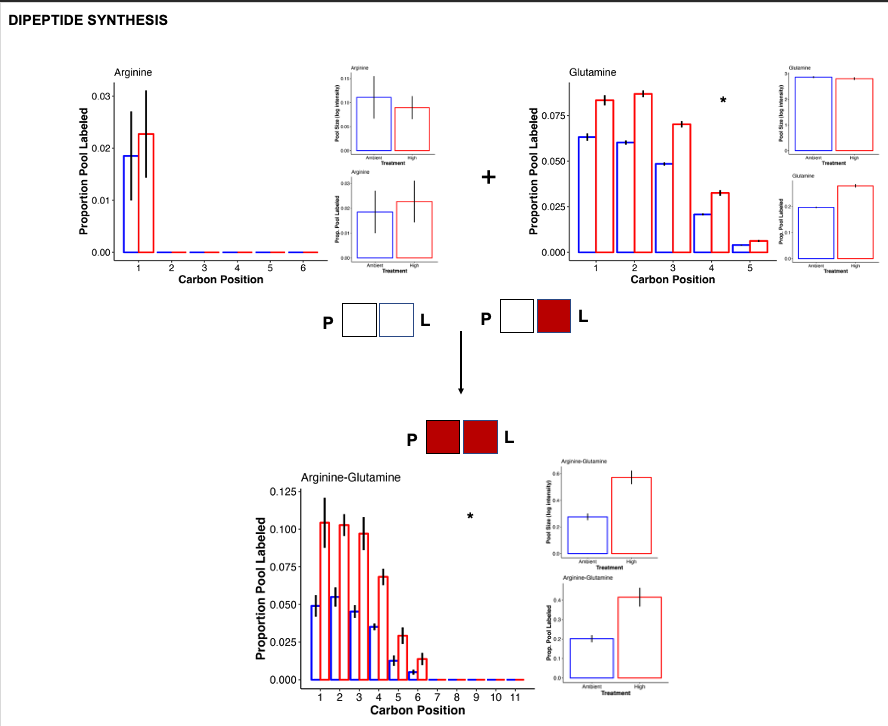
- Arginine-glutamine had higher pool size and higher labeling at high temperature. This indicates accumulation of this dipeptide and increased carbon incorporation from photosynthetic products.
- The label is coming from glutamine, which has higher label at high temperature at all carbon positions.
- In contrast, arginine is not labeled and not differentially abundant.
- Because the pool size of the individual peptides are not increased, it is clear that the coral is synthesizing these dipeptides preferentially and not just because there is a high free pool of both individual peptides. This is what was found in Chiles et al. 2022.
Chiles et al. 2022: paper link
- The abundance of dipeptides increased with thermal stress - there was an accumulation of dipeptides (Williams et al. 2021).
- In our data, we saw an increase in arginine-glutamine at high temperature.
- Glutamate is a precursor for lysine, valine, alanine, and arginine. It is also used in the urea cycle. We should explore these connections between pathways.
- In Chiles et al. 2022, arginine-glutamine had high nitrogen labeling and therefore high turnver of dipeptide pools. It is useful to compare labeling of the individual free amino acids to the dipeptide to determine how it was synthesized.
- Dipeptides could also come from the symbiont and are translocated to the host. From Chiles et al. 2022: “It is possible that rapid synthesis of amino acids into dipeptides allows Symbiodiniaceae to diminish bioavailability of nitrogen to reduce the potential influence of host nitrogen mediated control.”
 Chiles et al. 2022
Williams et al. 2021: paper link
- There was differential accumulation of four dipeptides in symbiotic vs asymbiotic Aiptasia, which may suggest a role in symbiosis and heat stress
- Corals divert a huge amount of energy to producing Montiporic acids (MAs). We saw high abundance of MA’s in the ion counts in our data, but they were not contributing to differences in treatments, suggesting they are maintained at high levels.
- “These compounds are disubstituted acetylenes with a carboxyl group linked to two alkyne (carbon-carbon triple bond) groups, followed by an unbranched alkane tail. The four known MAs (MA-A to MA-D; Fig. 1D) have antimicrobial activity, are cytotoxic against leukemia cells, and reduce the photosynthetic competency of coral symbionts.” - Williams et al. 2021
- This study found decreases in glucose in heat stress, but we did not find that in our study. This could be due to the short term heat stress and the lower intensity of heat stress relative to previous work. This could also represent metabolic resilience to stress.
- Arginine-glutamine (RQ) was acculumulated under heat stress in this study, as seen in ours. This could be from increased proteolysis and/or insufficient peptide clearance. The majority of metabolites accumulated in thermal stress are dipeptides, which also matches our data.
- This study also found accumulation of lysine-glutamine, arginine-valine, and arginine-alanine.
- Dipeptides can also be small molecule regulators, such as H+ buffers, antioxidants, and glucose regulation. Specifically, RQ can ameliorate impacts of oxygen imbalance and oxygen damage in lungs.
- This study also found increases of methionine, methionine sulfoxide, CDP-choline. We also found increases in CDP-choline at high temperature (C12 samples).
- CDP Choline is “a key metabolite involved in phospholipid metabolism, cell signaling, and glutamate transport and an intermediate in betaine synthesis”.
- Our work suggests RQ is host derived. In this study, the authors say, “We postulate that RQ may be a host response to oxygen stress resulting from redox imbalance in the coral or the algal symbionts caused by the high-temperature treatment.”
Urea cycle
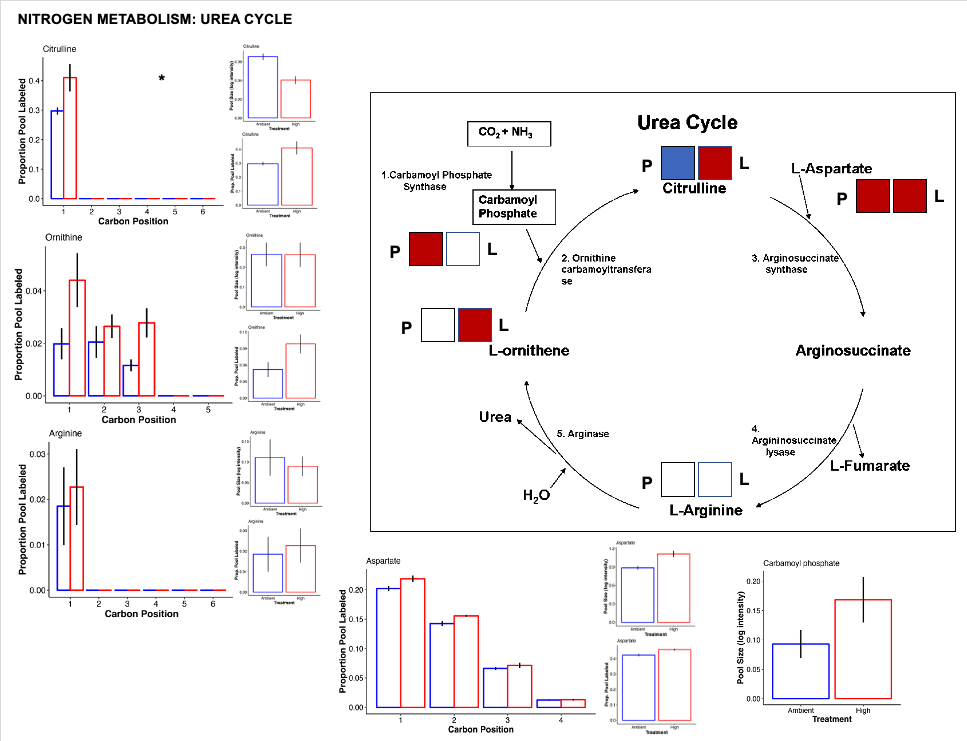
- There is a lot of change happening in the urea cycle!
- There is an increased pool of carbamoyl phosphate that feeds into the urea cycle. Generating carbamoyl phosphate sequesters ammonia and suggest that the host is actively managing nitrogen balance and responding to nitrogen cycling disruptions.
- There is also higher pool size of citrulline at ambient temperature compared to high. This could be due to reduced metabolism and usage of citrulline at ambient temperature or higher usage of citrulline at high temperature.
- There is also more label incorporation of citrulline at high temperature and this may suggest higher metabolism of citrulline at high temperature.
- This also matches the observation that aspartate has higher pool size and higher label incorporation at high temperature. If citrulline is being metabolized into arginosuccinate by adding aspartate in the urea cycle, then we would expect more aspartate. Because arginine is not different between treatments, there is a limitation in the urea cycle that balances the rate of the pathway after addition of aspartate to citrulline to produce argino succinate.
- There is also higher turnover of ornithine at high temperature.
- Overall, there are several indications that the urea cycle is altered under high temperature treatment.
Cofactors
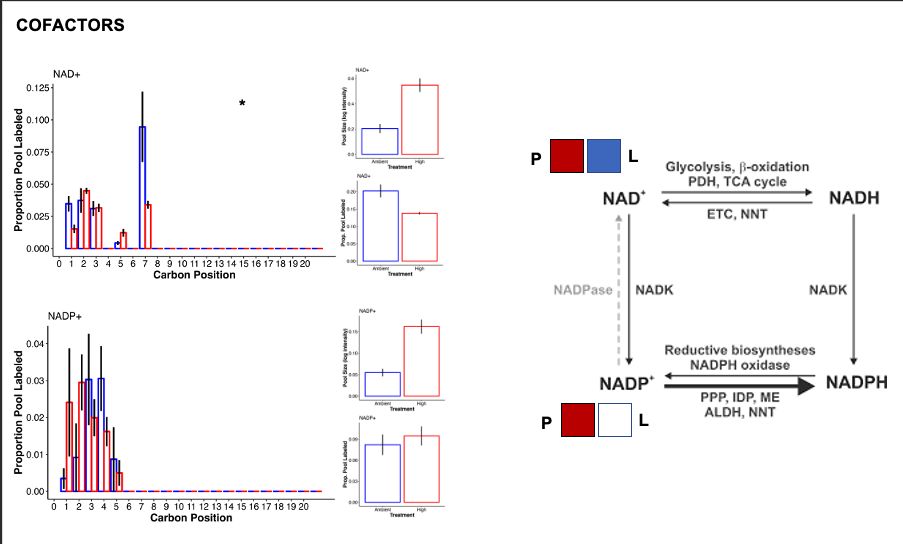
- In high temperature there was a large accumulation of NAD+ and NADP+ and enrichment of nicotinate and nicotinamide metabolism in the C13 samples.
- Xie et al. 2020 provides a review of NAD+ metabolism. Here is a figure from the paper:

- Accumulation of NAD+ and NADP+ in our samples could result from antioxidant defence, anabolic reations, and signaling that uses NADPH and generates NADP+. If the Pentose phosphate pathway activity is reduced, then the pool of NADP+ would increase, as we see in our samples. We should look for metabolite evidence of the pentose phosphate pathway to see if we can infer rates of this pathway.
- Further, electron transport chain, lactic adic generation, and PUFA desaturation would use NADH and generate NAD+. If glycolysis, fatty acid oxidation, and the TCA cycle are slower or do not match the rate of accumulation, then the pool of NAD+ would increase.
- Further, NAD+ is degraded through DNA repair, ER stress, RNA processing, metabolism, signaling, etc. If the pool is increased, then either the production of NAD+ increases, the degradation pathways decrease, or both are happening at the same time.
Signalling and symbiosis
There are several metabolites that are different between treatments. Here are a few that I think are interesting.
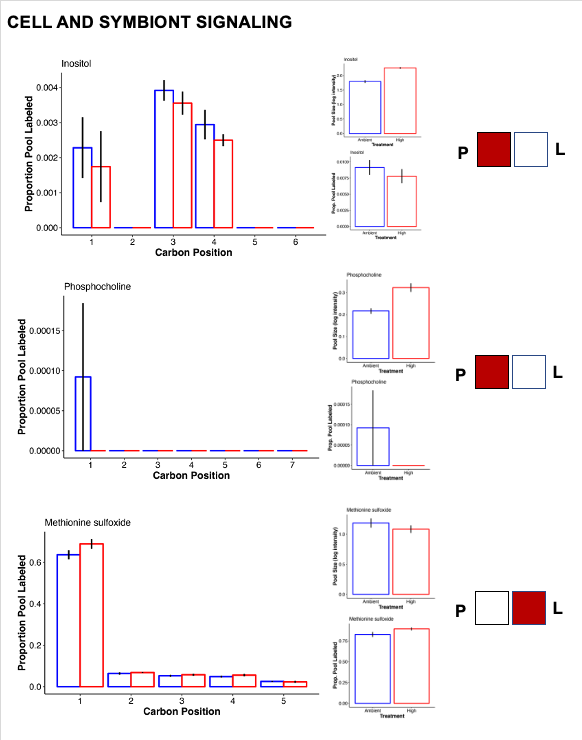
- Inositol was higher at high temperature, which is involved in signaling and host-symbiont communication.
Hillyer et al. 2017a: paper link
-
This study found increases in abundance of inositol after 6 and 9 days of stress. No label detected in inositol suggests this is a host-mediated response to stress. “The accumulation of compatible solutes observed in the intracellular pools of the heat stressed host, likely indicate exposure to osmotic stress and mechanisms to maintain internal osmolality. In addition to their functions as compatible solutes, the roles of inositol derivatives in the cnidarian-dinoflagellate symbiosis are currently receiving increased attention (Bertucci et al. 2013; Rosic et al. 2015), in part because of their highly conserved functions in cellular recognition, signalling and cell development (Boehning et al. 2005; Chakraborty et al. 2008).” Hillyer et al. 2017b will also be a helpful paper for labeling data.
- Phosphocholine was also at higher abundance in high temperature. This metabolite may be involved in membrane stability under stress.
- Methionine sulfoxide is an antioxidant compound and was increased in labeling at high temperature, suggesting higher synthesis as well as metabolism and therefore higher turnover under stress.
Answering our questions
- Is metabolite pool size different between isotope treatments? Yes, in expected ways that pass our QC checks
- Is metabolite pool size different between temperature treatments? Yes
- Is metabolite atom enrichment different between dark and light treatments? Yes, photosynthates are more highly enriched in light
- Is metabolite atom enrichment different between temperature treatments? Yes
- Is metabolite labeling proportion different between dark and light treatments? Yes, photosynthates are more highly labeled in light
- Is metabolite labeling proportion different between temperature treatments? Yes
- Does the location of carbon labeling differ for metabolites between treatments? Yes for some metabolites
- How does temperature treatment affect metabolite pool size and enrichment/labeling and what does this tell us about metabolic pathways? Yes, there are some very interesting changes in carbon and nitrogen metabolism signaling the onset of dysbiosis
Overall, these data suggest that under high temperature there is damage to the symbiosis. We see this as a shift in nitrogen metabolism and balance and a disruption in carbon metabolism.
In our physiological analysis we did not see a clear change in larval phenotypes and performance under stress. This suggests that our metabolic data are capturing early metabolic indications of bleaching and dysbiosis in larvae.
Next steps
Metabolic pathways are complex and interconnected - and we will next need to look in more depth at metabolic connections across these pathways.
Specifically, I would like to:
- Look into lipid biosynthesis/metabolism and amino acid biosynthesis pathways
- Look into other differential metabolites outside the pathways shown here to see what else is happening
- Examine differences in enrichment vs labeling proportion patterns
- See how Montiporic acids are affected by treatment and possible metabolic functions
- Investigate glucose position:treatment interactions - how is glucose being made in high vs ambient (e.g., gluconeogenesis vs glycolysis)?
- Dive into the literature to see how our data relates to previous work.