Mcapitata Development 16S Analysis in QIIME2 (Part 3)
This post details QC and QIIME analysis for the 16S analysis adapted from the pipeline developed by Emma Strand.
16S QC and Analysis in QIIME2
In previous post, I created metadata, prepared the environment, and loaded data into a QIIME artifact.
Next we can proceed with cleaning and QC in QIIME following E Strand analysis post.
8. Denoising with DADA2
ssh -l ashuffmyer ssh3.hac.uri.edu
cd /data/putnamlab/ashuffmyer/AH_MCAP_16S

cd scripts
nano denoise.sh
We are using the following parameters based on MultiQC report of 16S data.
P-trim values are based on primer length:
- p-trim-left-r 20 (reverse is 20 bp long)
- p-trim-left-f 19 (forward is 19 bp long)
` –p-trim-left-r 20 –p-trim-left-f 19 `
The code does not include these primer trimming parameters because our sequences were returned without primers
Information for our sequencing run is here. We used the V4 primer region.
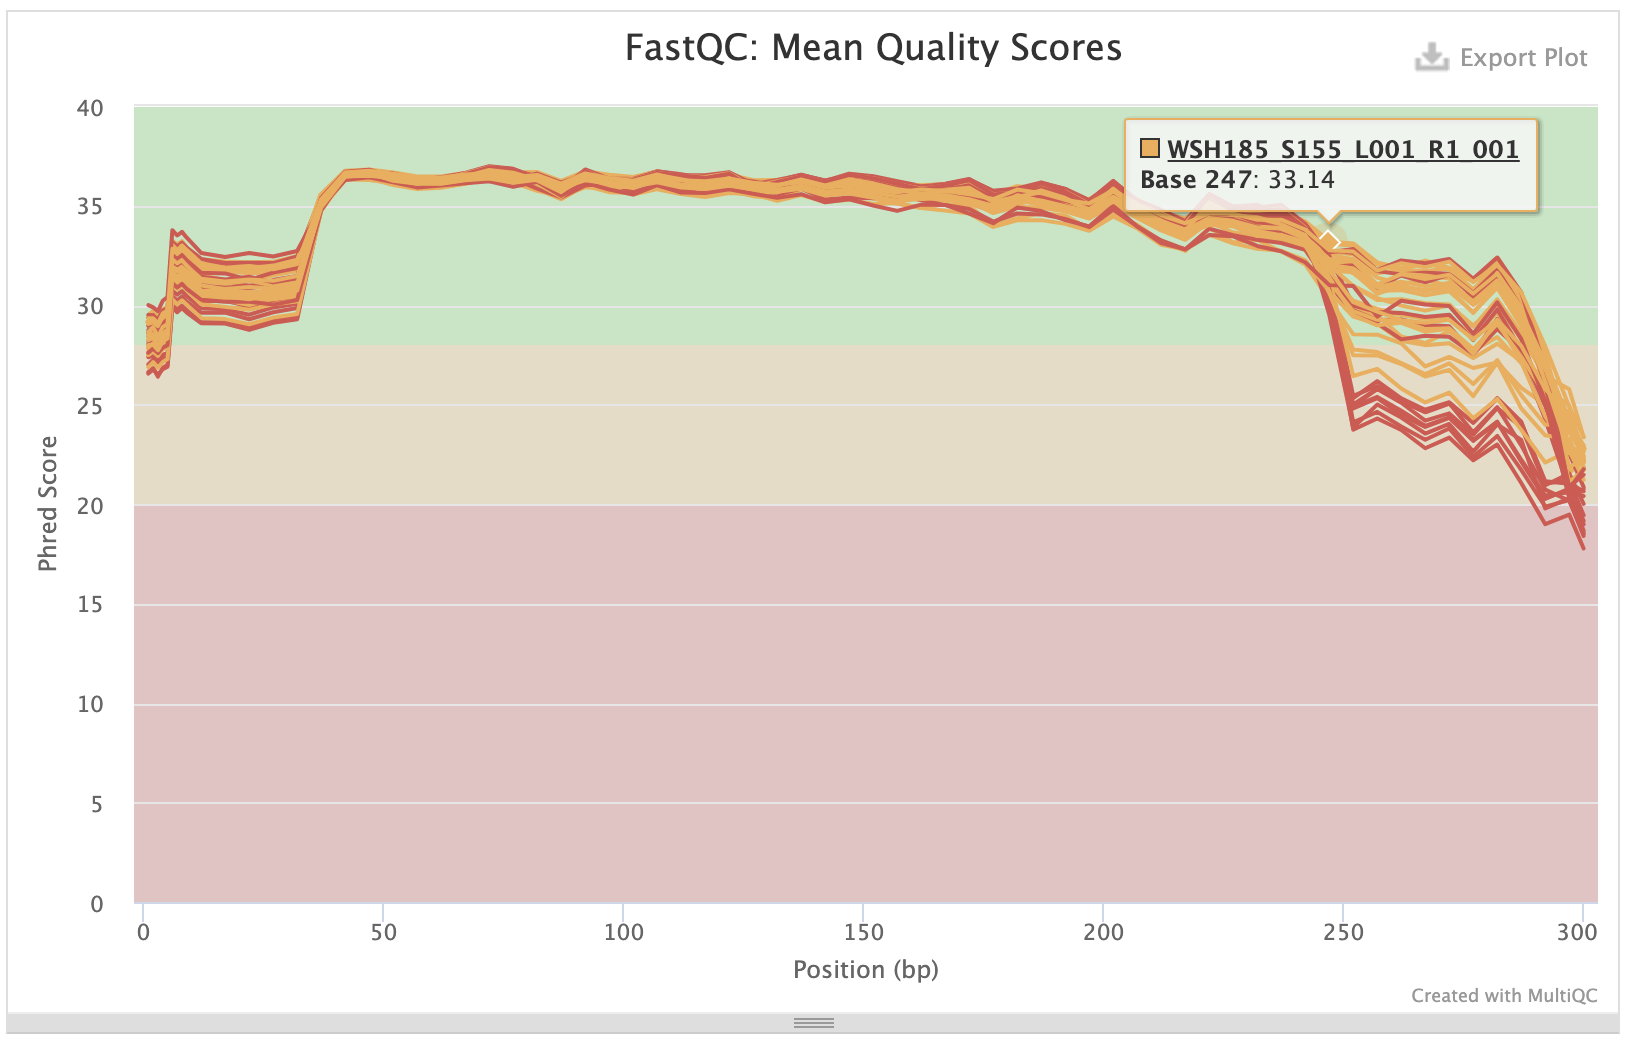
P-truncate values are based on where the mean quality scores of R1 and R2 files start to decrease seen in the MultiQC report:
- p-trunc-len-r 282
- p-trunc-len-f 282
Forward sequences:
Reverse sequences:
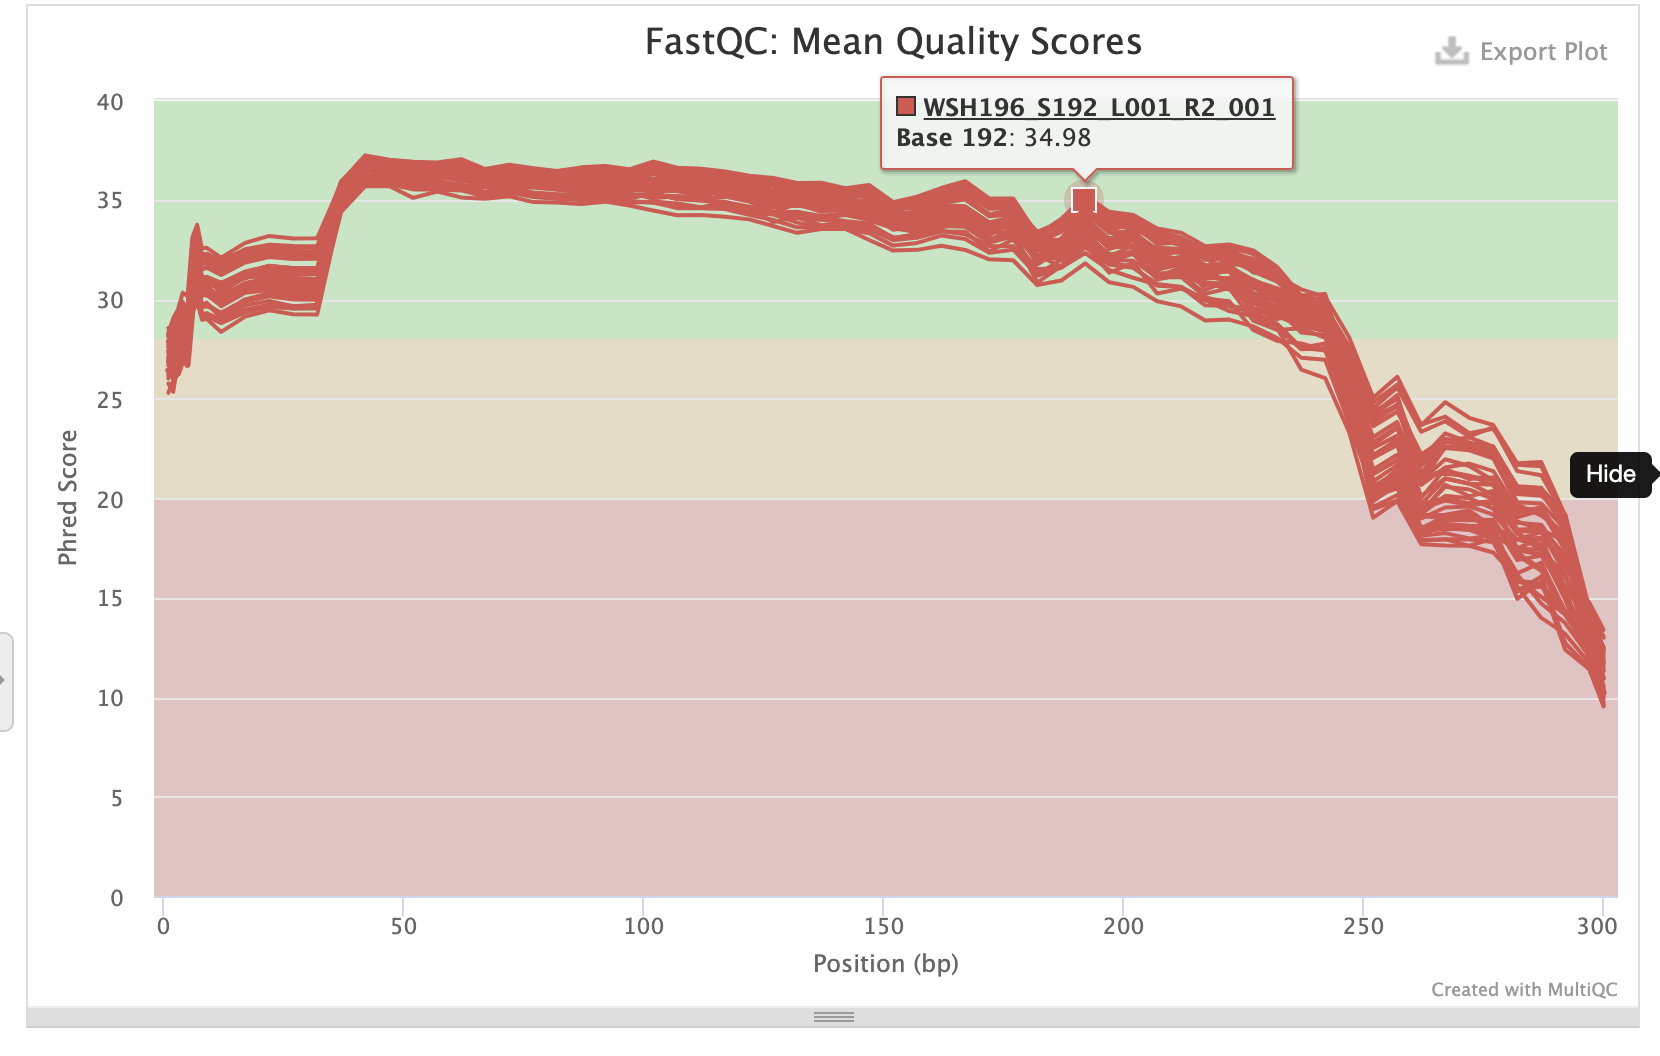
Create a script to run denoising step with these parameters.
mkdir processed_data
Move data produced in step 7 to the raw_data folder.
mv AH-MCAP-16S-paired-end-sequences1.qza raw_data/AH-MCAP-16S-paired-end-sequences1.qza
Other commands used in the script are as follows:
--i-demultiplexed-seqsfollowed by the sequences artifact to be denoised--p-trunc-len-f INTEGER: position to be truncated due to decreased quality. This truncates the 3’ end of sequences which are the bases that were sequenced in the last cycles. On the forward read.--p-trunc-len-r INTEGER: same as above but on the reverse read.p-trim-left-f INTEGER: Position at which forward read sequences should be trimmed due to low quality. This trims the 5’ end of the input sequences, which will be the bases that were sequenced in the first cycles.p-trim-left-r INTEGER: Position at which reverse read sequences should be trimmed due to low quality. This trims the 5’ end of the input sequences, which will be the bases that were sequenced in the first cycles.o-table: The resulting feature table.o-representative-sequences: The resulting feature sequences. Each feature in the feature table will be represented by exactly one sequence, and these sequences will be the joined paired-end sequences.o-denoising-stats: SampleData[DADA2Stats]p-n-threads: The number of threads to use for multithreaded processing. If 0 is provided, all available cores will be used.
This script will also generate qiime metadata table, feature-table summarized and feature-table tabulated. This will be output in the processed_data directory and the script lives in the script directory.
nano denoise.sh
#!/bin/bash
#SBATCH -t 24:00:00
#SBATCH --nodes=1 --ntasks-per-node=1
#SBATCH --export=NONE
#SBATCH --mem=100GB
#SBATCH --mail-type=BEGIN,END,FAIL #email you when job starts, stops and/or fails
#SBATCH --mail-user=ashuffmyer@uri.edu #your email to send notifications
#SBATCH --account=putnamlab
#SBATCH --error="dada_script_error" #if your job fails, the error report will be put in this file
#SBATCH --output="dada_output_script" #once your job is completed, any final job report comments will be put in this file

source /usr/share/Modules/init/sh # load the module function
module load QIIME2/2021.8

cd ../processed_data

# Metadata path
METADATA="../metadata/sample_metadata.txt"

qiime dada2 denoise-paired --verbose --i-demultiplexed-seqs ../raw_data/AH-MCAP-16S-paired-end-sequences1.qza \
  --p-trunc-len-r 192 --p-trunc-len-f 247 \
  --p-trim-left-r 0 --p-trim-left-f 0 \
  --o-table table.qza \
  --o-representative-sequences rep-seqs.qza \
  --o-denoising-stats denoising-stats.qza \
  --p-n-threads 20

# Summarize feature table and sequences
  qiime metadata tabulate \
    --m-input-file denoising-stats.qza \
    --o-visualization denoising-stats.qzv
  qiime feature-table summarize \
    --i-table table.qza \
    --o-visualization table.qzv \
    --m-sample-metadata-file $METADATA
  qiime feature-table tabulate-seqs \
    --i-data rep-seqs.qza \
    --o-visualization rep-seqs.qzv
Once complete, output will be available.
Transfer generated visualization files to home computer.
scp ashuffmyer@bluewaves.uri.edu:/data/putnamlab/ashuffmyer/AH_MCAP_16S/processed_data/denoising-stats.qzv ~/MyProjects/EarlyLifeHistory_Energetics/Mcap2020/Data/16S/

scp ashuffmyer@bluewaves.uri.edu:/data/putnamlab/ashuffmyer/AH_MCAP_16S/processed_data/rep-seqs.qzv ~/MyProjects/EarlyLifeHistory_Energetics/Mcap2020/Data/16S/

scp ashuffmyer@bluewaves.uri.edu:/data/putnamlab/ashuffmyer/AH_MCAP_16S/processed_data/table.qzv ~/MyProjects/EarlyLifeHistory_Energetics/Mcap2020/Data/16S/
View the file by going to https://view.qiime2.org/ and adding the files to the browser.
We get the following metadata table:
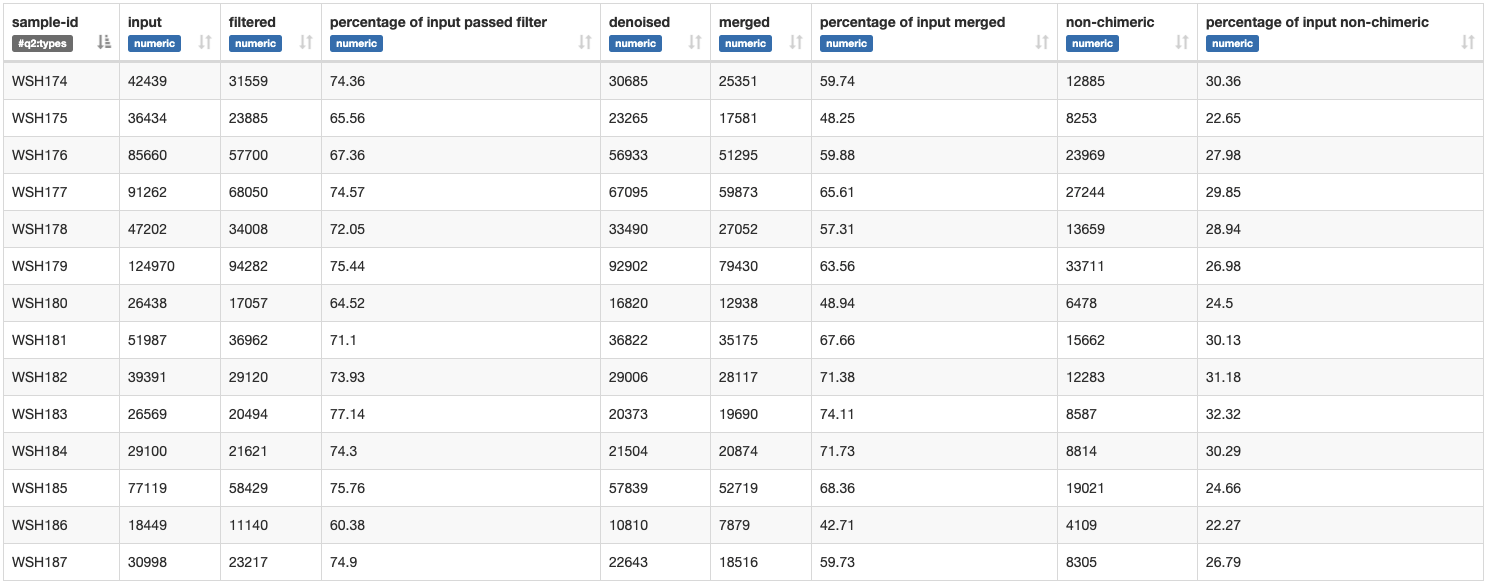
Approx. 65-70% of sequence input passed the filters set in the script above.
Percentage of non-chimeric is approx. 40-50%.
We also get the following information about sequence length:

Mean sequence length = 257 bp
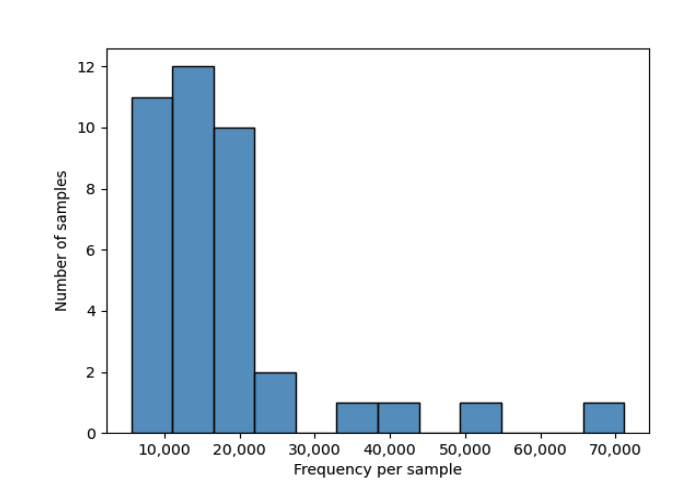
From the table visualization (table.qzv), we get information on the number of features and distrubtion of features in each sample.

9. Taxonomy classification
Classifier: classify-sklearn. This was recommended by QIIME2. database: silva-138-99-515-806-nb-classifier.qza. This was most relevant to the primers used.
cd metadata

wget https://data.qiime2.org/2021.11/common/silva-138-99-515-806-nb-classifier.qza
First run “unfiltered”, we will use the output of this analysis to inform a “filtered” analysis next.
cd ../scripts
nano taxonomic_id.sh
Create the script.
#!/bin/bash
#SBATCH -t 24:00:00
#SBATCH --nodes=1 --ntasks-per-node=1
#SBATCH --export=NONE
#SBATCH --mem=100GB
#SBATCH --mail-type=BEGIN,END,FAIL #email you when job starts, stops and/or fails
#SBATCH --mail-user=ashuffmyer@uri.edu #your email to send notifications
#SBATCH --account=putnamlab
#SBATCH --error="taxid_script_error" #if your job fails, the error report will be put in this file
#SBATCH --output="taxid_output_script" #once your job is completed, any final job report comments will be put in this file

source /usr/share/Modules/init/sh # load the module function
module load QIIME2/2021.8

cd ../processed_data

# Metadata path
METADATA="../metadata/sample_metadata.txt"

qiime feature-classifier classify-sklearn \
  --i-classifier ../metadata/silva-138-99-515-806-nb-classifier.qza \
  --i-reads rep-seqs.qza \
  --o-classification taxonomy.qza

qiime metadata tabulate \
    --m-input-file taxonomy.qza \
    --o-visualization taxonomy.qzv
qiime taxa barplot \
    --i-table table.qza \
    --i-taxonomy taxonomy.qza \
    --m-metadata-file $METADATA \
    --o-visualization taxa-bar-plots.qzv
qiime metadata tabulate \
    --m-input-file rep-seqs.qza \
    --m-input-file taxonomy.qza \
    --o-visualization tabulated-feature-metadata.qzv
Second, run the “filtered” version. This filters the above tables generated. You need to run the above taxonomic_id.sh script prior to running taxonomic_id_filtered.sh.
cd scripts
nano taxonomic_id_filtered.sh
#!/bin/bash
#SBATCH -t 24:00:00
#SBATCH --nodes=1 --ntasks-per-node=1
#SBATCH --export=NONE
#SBATCH --mem=100GB
#SBATCH --mail-type=BEGIN,END,FAIL #email you when job starts, stops and/or fails
#SBATCH --mail-user=ashuffmyer@uri.edu #your email to send notifications
#SBATCH --account=putnamlab
#SBATCH --error="idfiltered_script_error" #if your job fails, the error report will be put in this file
#SBATCH --output="idfiltered_output_script" #once your job is completed, any final job report comments will be put in this file

source /usr/share/Modules/init/sh # load the module function
module load QIIME2/2021.8

cd ../processed_data

# Metadata path
METADATA="../metadata/sample_metadata.txt"

qiime taxa filter-table \
     --i-table table.qza \
     --i-taxonomy taxonomy.qza \
     --p-mode contains \
     --p-exclude "Unassigned","Chloroplast","Eukaryota" \
     --o-filtered-table table-filtered.qza

qiime metadata tabulate \
    --m-input-file taxonomy.qza \
    --o-visualization taxonomy.qzv
qiime taxa barplot \
    --i-table table-filtered.qza \
    --i-taxonomy taxonomy.qza \
    --m-metadata-file $METADATA \
    --o-visualization taxa-bar-plots-filtered.qzv
qiime metadata tabulate \
    --m-input-file rep-seqs.qza \
    --m-input-file taxonomy.qza \
    --o-visualization tabulated-feature-metadata.qzv
Move relevant visualization files to the desktop. We will move all files over in the next steps.
scp ashuffmyer@bluewaves.uri.edu:/data/putnamlab/ashuffmyer/AH_MCAP_16S/processed_data/taxa-bar-plots.qzv ~/MyProjects/EarlyLifeHistory_Energetics/Mcap2020/Output/16S/qiime/

scp ashuffmyer@bluewaves.uri.edu:/data/putnamlab/ashuffmyer/AH_MCAP_16S/processed_data/taxa-bar-plots-filtered.qzv ~/MyProjects/EarlyLifeHistory_Energetics/Mcap2020/Output/16S/qiime/
Before filtering, our taxonomy (level 1) looks like this:
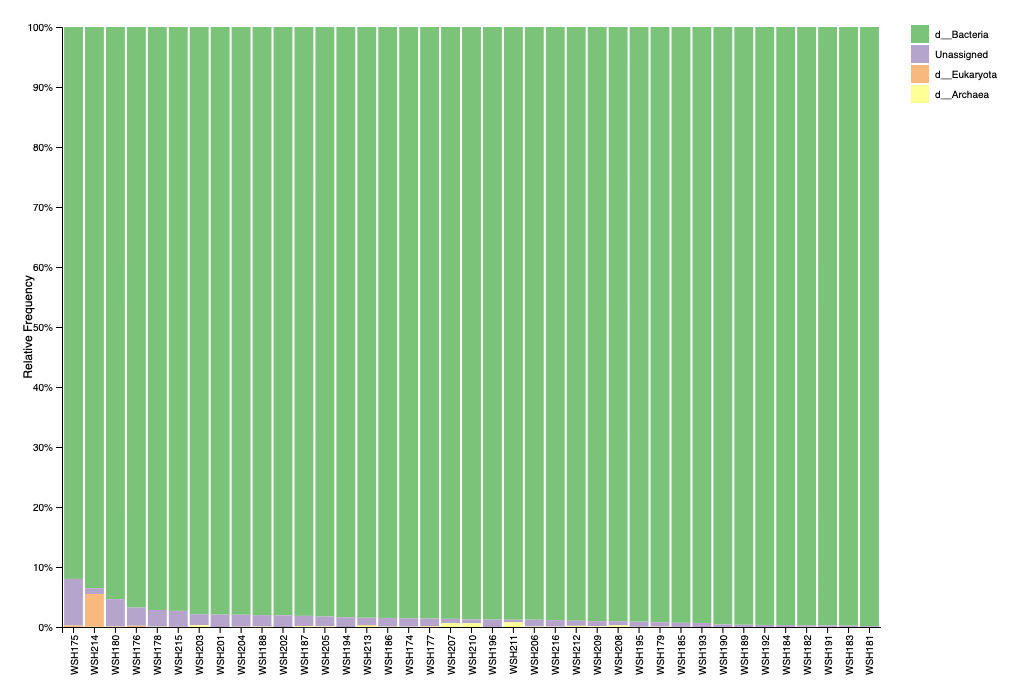
One sample has a blip of eukaryotic signal that is matched to a ciliate. The proportion is low and will be removed with filtering. Looks like low potential for contamination.
Our taxonomy identification (level 5) after filtering looks like this:
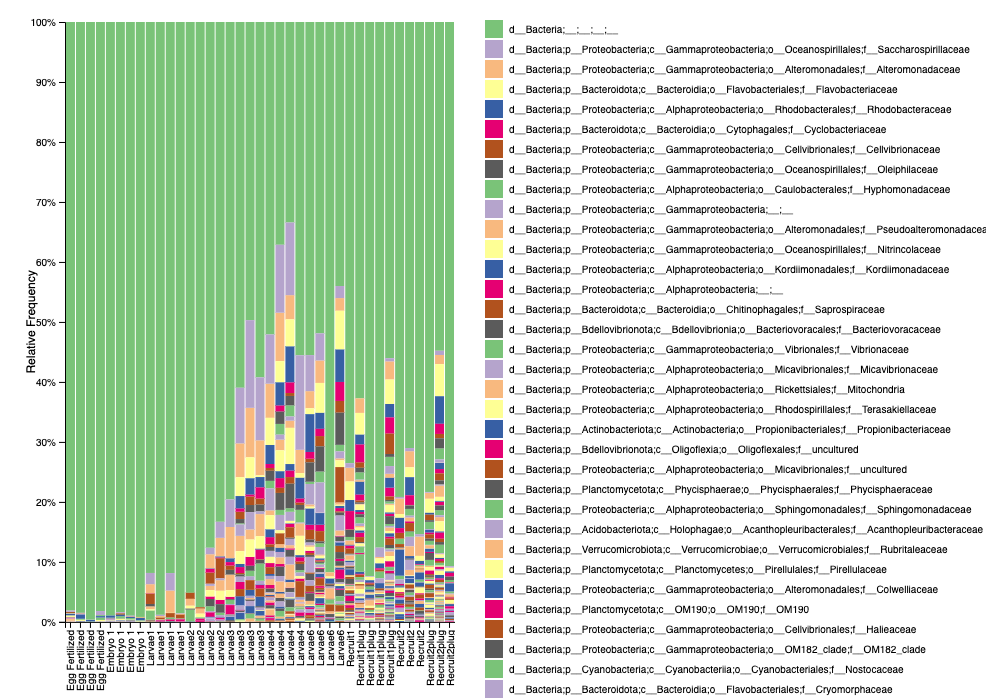
- Good news is that we have almost 100% bacteria and we don’t see signs of skeletal bacteria (which makes sense due to early life stage sampling).
- We have a high proportion of unidentified bacteria, so we can look into using different databases to try to improve the identification.
10. Phylogenetic trees
This aligns the sequences to assess the phylogenetic relationship between each of our features.
cd scripts
nano phylo_tree.sh
#!/bin/bash
#SBATCH -t 24:00:00
#SBATCH --nodes=1 --ntasks-per-node=1
#SBATCH --export=NONE
#SBATCH --mem=100GB
#SBATCH --mail-type=BEGIN,END,FAIL #email you when job starts, stops and/or fails
#SBATCH --mail-user=ashuffmyer@uri.edu #your email to send notifications
#SBATCH --account=putnamlab
#SBATCH --error="tree_script_error" #if your job fails, the error report will be put in this file
#SBATCH --output="tree_output_script" #once your job is completed, any final job report comments will be put in this file

source /usr/share/Modules/init/sh # load the module function
module load QIIME2/2021.8

cd ../processed_data

# align and mask sequences
qiime alignment mafft \
  --i-sequences rep-seqs.qza \
  --o-alignment aligned-rep-seqs.qza
qiime alignment mask \
  --i-alignment aligned-rep-seqs.qza \
  --o-masked-alignment masked-aligned-rep-seqs.qza

# calculate tree
qiime phylogeny fasttree \
  --i-alignment masked-aligned-rep-seqs.qza \
  --o-tree unrooted-tree.qza
qiime phylogeny midpoint-root \
  --i-tree unrooted-tree.qza \
  --o-rooted-tree rooted-tree.qza
11. Calculate Diversity Metrics
In these scripts, we set the subsampling to 5570, which is the lowest sequence count in our samples. Visualizing sample depth in table.qzv shows that if we subsample to 5570 we retained 217,230 (30.64%) features in 39 (100.00%) samples.
Note that if you are re-running results, you’ll need to rm -r core-metrics-results. The script will not overwrite the output directory if it already exists.
cd scripts
nano diversity.sh
#!/bin/bash
#SBATCH -t 24:00:00
#SBATCH --nodes=1 --ntasks-per-node=1
#SBATCH --export=NONE
#SBATCH --mem=100GB
#SBATCH --mail-type=BEGIN,END,FAIL #email you when job starts, stops and/or fails
#SBATCH --mail-user=ashuffmyer@uri.edu #your email to send notifications
#SBATCH --account=putnamlab
#SBATCH --error="diversity_script_error" #if your job fails, the error report will be put in this file
#SBATCH --output="diversity_output_script" #once your job is completed, any final job report comments will be put in this file

source /usr/share/Modules/init/sh # load the module function
module load QIIME2/2021.8

cd ../processed_data

# Metadata path
METADATA="../metadata/sample_metadata.txt"

qiime diversity core-metrics-phylogenetic \
  --i-phylogeny rooted-tree.qza \
  --i-table table-filtered.qza \
  --p-sampling-depth 5570 \
  --m-metadata-file $METADATA \
  --output-dir core-metrics-results

qiime diversity alpha-group-significance \
  --i-alpha-diversity core-metrics-results/faith_pd_vector.qza \
  --m-metadata-file $METADATA \
  --o-visualization core-metrics-results/faith-pd-group-significance.qzv
qiime diversity alpha-group-significance \
  --i-alpha-diversity core-metrics-results/evenness_vector.qza \
  --m-metadata-file $METADATA \
  --o-visualization core-metrics-results/evenness-group-significance.qzv

qiime diversity beta-group-significance \
  --i-distance-matrix core-metrics-results/unweighted_unifrac_distance_matrix.qza \
  --m-metadata-file $METADATA \
  --m-metadata-column lifestage \
  --o-visualization core-metrics-results/unweighted-unifrac-station-significance.qzv \
  --p-pairwise
qiime diversity beta-group-significance \
  --i-distance-matrix core-metrics-results/unweighted_unifrac_distance_matrix.qza \
  --m-metadata-file $METADATA  \
  --m-metadata-column lifestage \
  --o-visualization core-metrics-results/unweighted-unifrac-group-significance.qzv \
  --p-pairwise

# This script calculates the rarefaction curve for the data
  qiime diversity alpha-rarefaction \
    --i-table table-filtered.qza \
    --i-phylogeny rooted-tree.qza \
    --p-max-depth 5570 \
    --m-metadata-file $METADATA \
    --o-visualization alpha-rarefaction.qzv
Move all data files to the desktop.
scp ashuffmyer@bluewaves.uri.edu:/data/putnamlab/ashuffmyer/AH_MCAP_16S/processed_data/alpha-rarefaction.qzv ~/MyProjects/EarlyLifeHistory_Energetics/Mcap2020/Output/16S/qiime/

scp ashuffmyer@bluewaves.uri.edu:/data/putnamlab/ashuffmyer/AH_MCAP_16S/processed_data/tabulated-feature-metadata.qzv ~/MyProjects/EarlyLifeHistory_Energetics/Mcap2020/Output/16S/qiime/

scp ashuffmyer@bluewaves.uri.edu:/data/putnamlab/ashuffmyer/AH_MCAP_16S/processed_data/taxonomy.qzv ~/MyProjects/EarlyLifeHistory_Energetics/Mcap2020/Output/16S/qiime/

scp ashuffmyer@bluewaves.uri.edu:/data/putnamlab/ashuffmyer/AH_MCAP_16S/processed_data/table.qzv ~/MyProjects/EarlyLifeHistory_Energetics/Mcap2020/Output/16S/qiime/

scp ashuffmyer@bluewaves.uri.edu:/data/putnamlab/ashuffmyer/AH_MCAP_16S/processed_data/denoising-stats.qzv ~/MyProjects/EarlyLifeHistory_Energetics/Mcap2020/Output/16S/qiime/

scp ashuffmyer@bluewaves.uri.edu:/data/putnamlab/ashuffmyer/AH_MCAP_16S/processed_data/core-metrics-results/*.qzv ~/MyProjects/EarlyLifeHistory_Energetics/Mcap2020/Output/16S/qiime/

scp ashuffmyer@bluewaves.uri.edu:/data/putnamlab/ashuffmyer/AH_MCAP_16S/processed_data/core-metrics-results/*.qza ~/MyProjects/EarlyLifeHistory_Energetics/Mcap2020/Output/16S/qiime/

scp ashuffmyer@bluewaves.uri.edu:/data/putnamlab/ashuffmyer/AH_MCAP_16S/processed_data/*.qza ~/MyProjects/EarlyLifeHistory_Energetics/Mcap2020/Output/16S/qiime/

scp ashuffmyer@bluewaves.uri.edu:/data/putnamlab/ashuffmyer/AH_MCAP_16S/processed_data/*.qzv ~/MyProjects/EarlyLifeHistory_Energetics/Mcap2020/Output/16S/qiime/

scp ashuffmyer@bluewaves.uri.edu:/data/putnamlab/ashuffmyer/AH_MCAP_16S/metadata/sample_metadata.txt ~/MyProjects/EarlyLifeHistory_Energetics/Mcap2020/Output/16S/qiime/
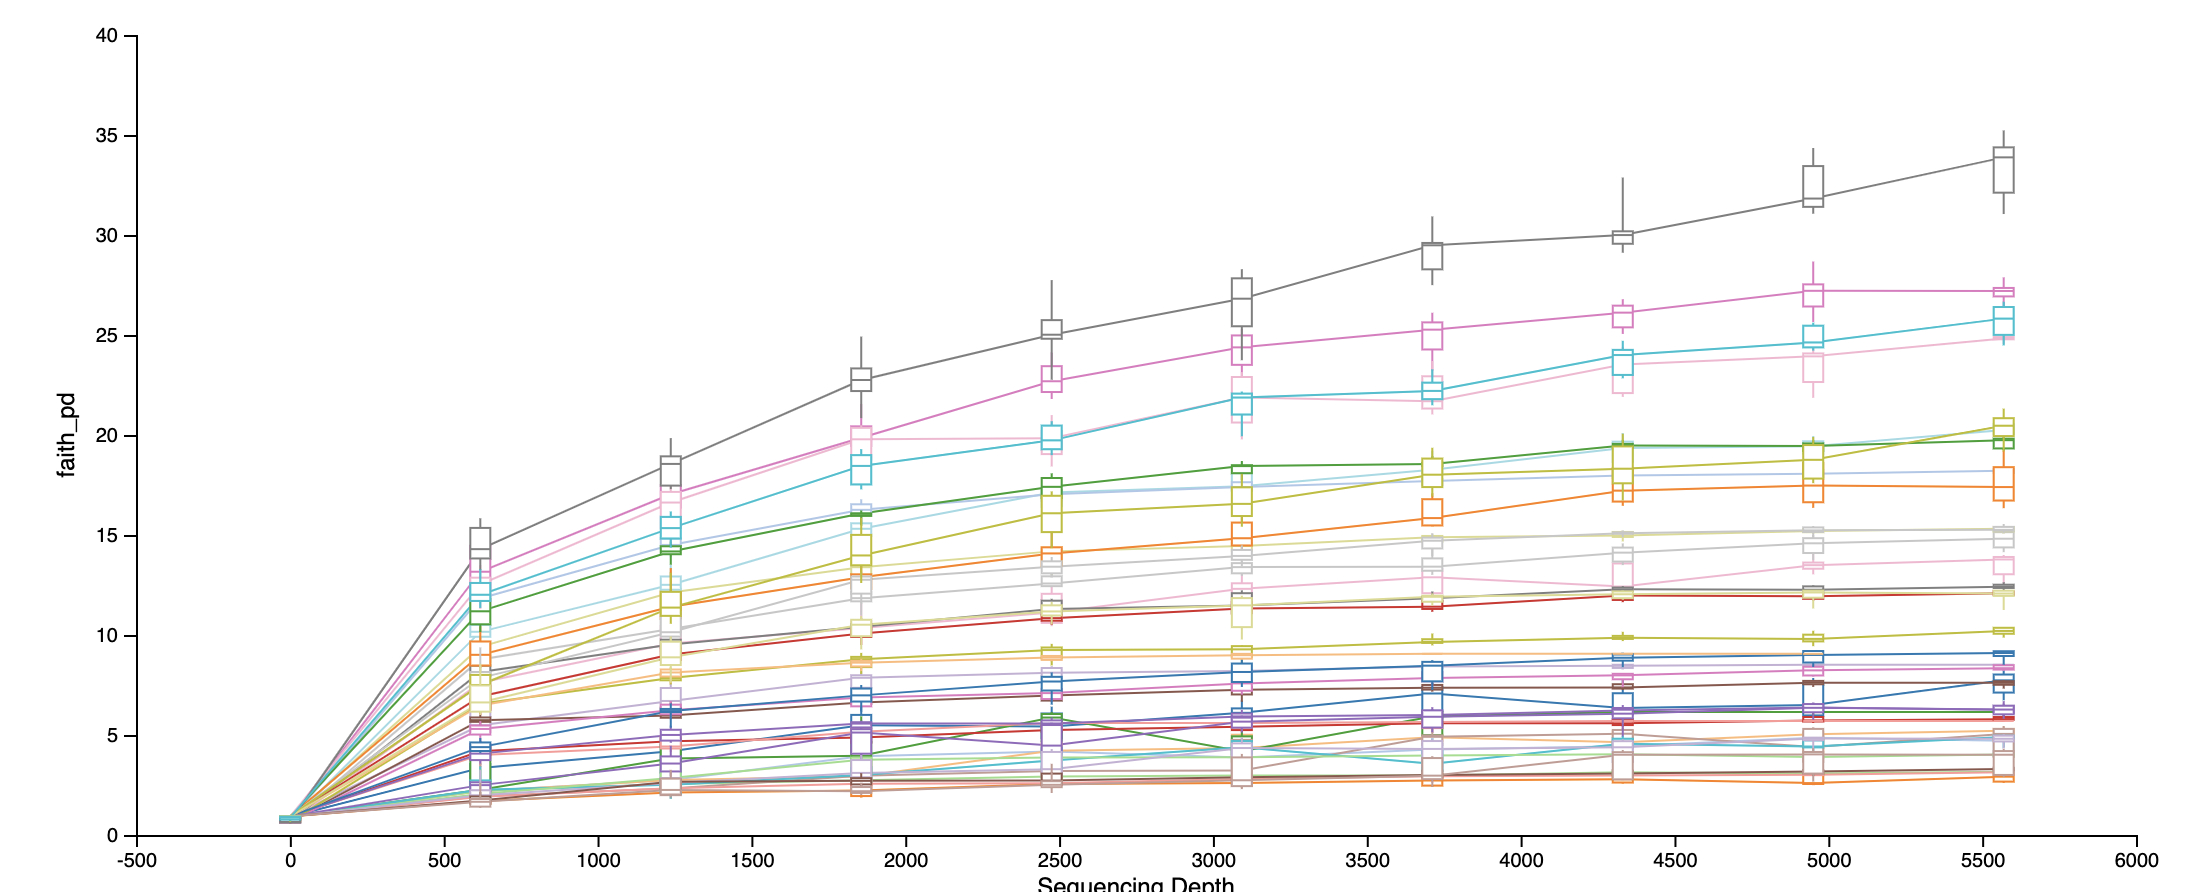
Rarefaction curve at the sampling depth we used:
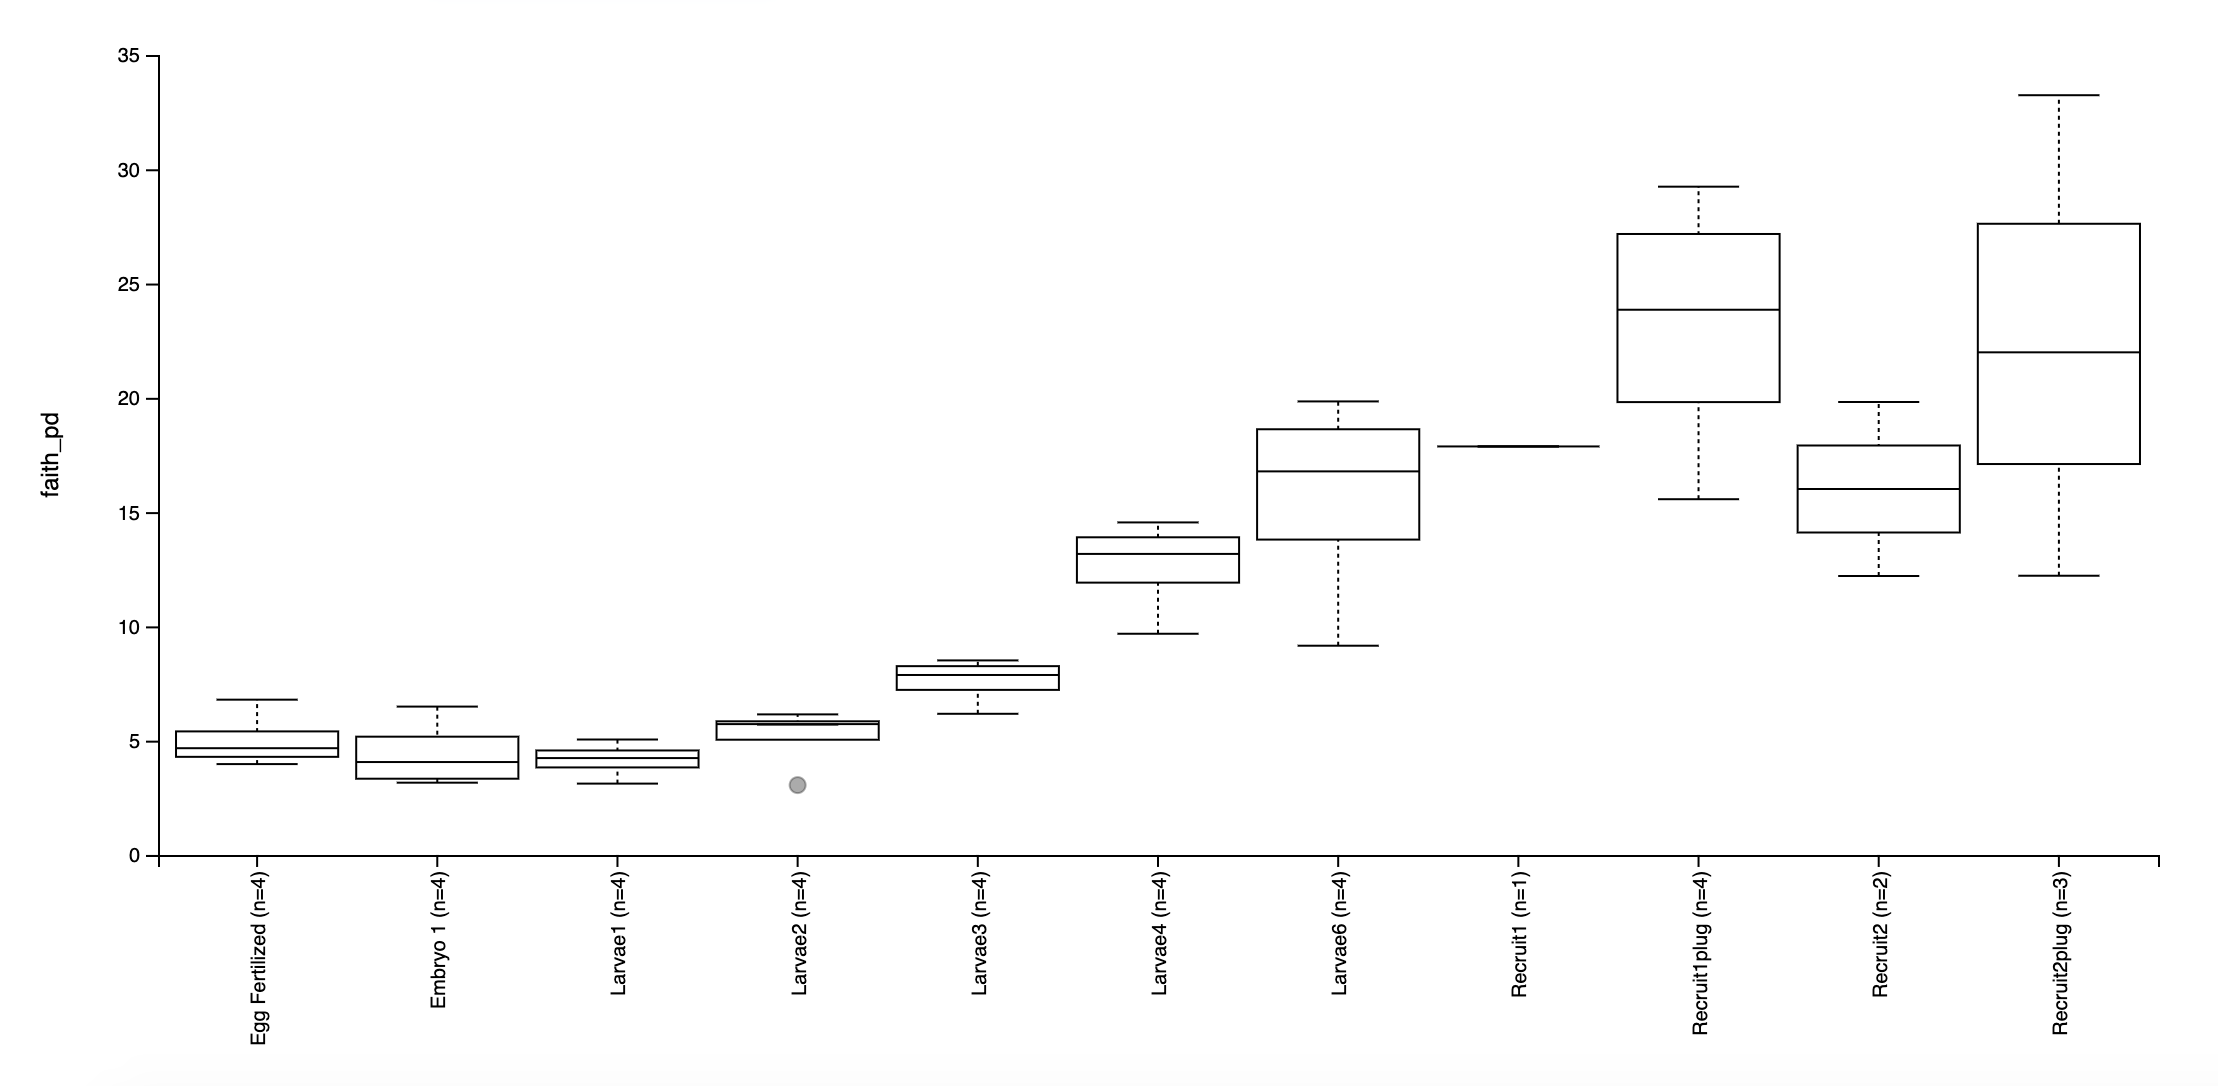
Faith’s Phylogenetic Diversity:
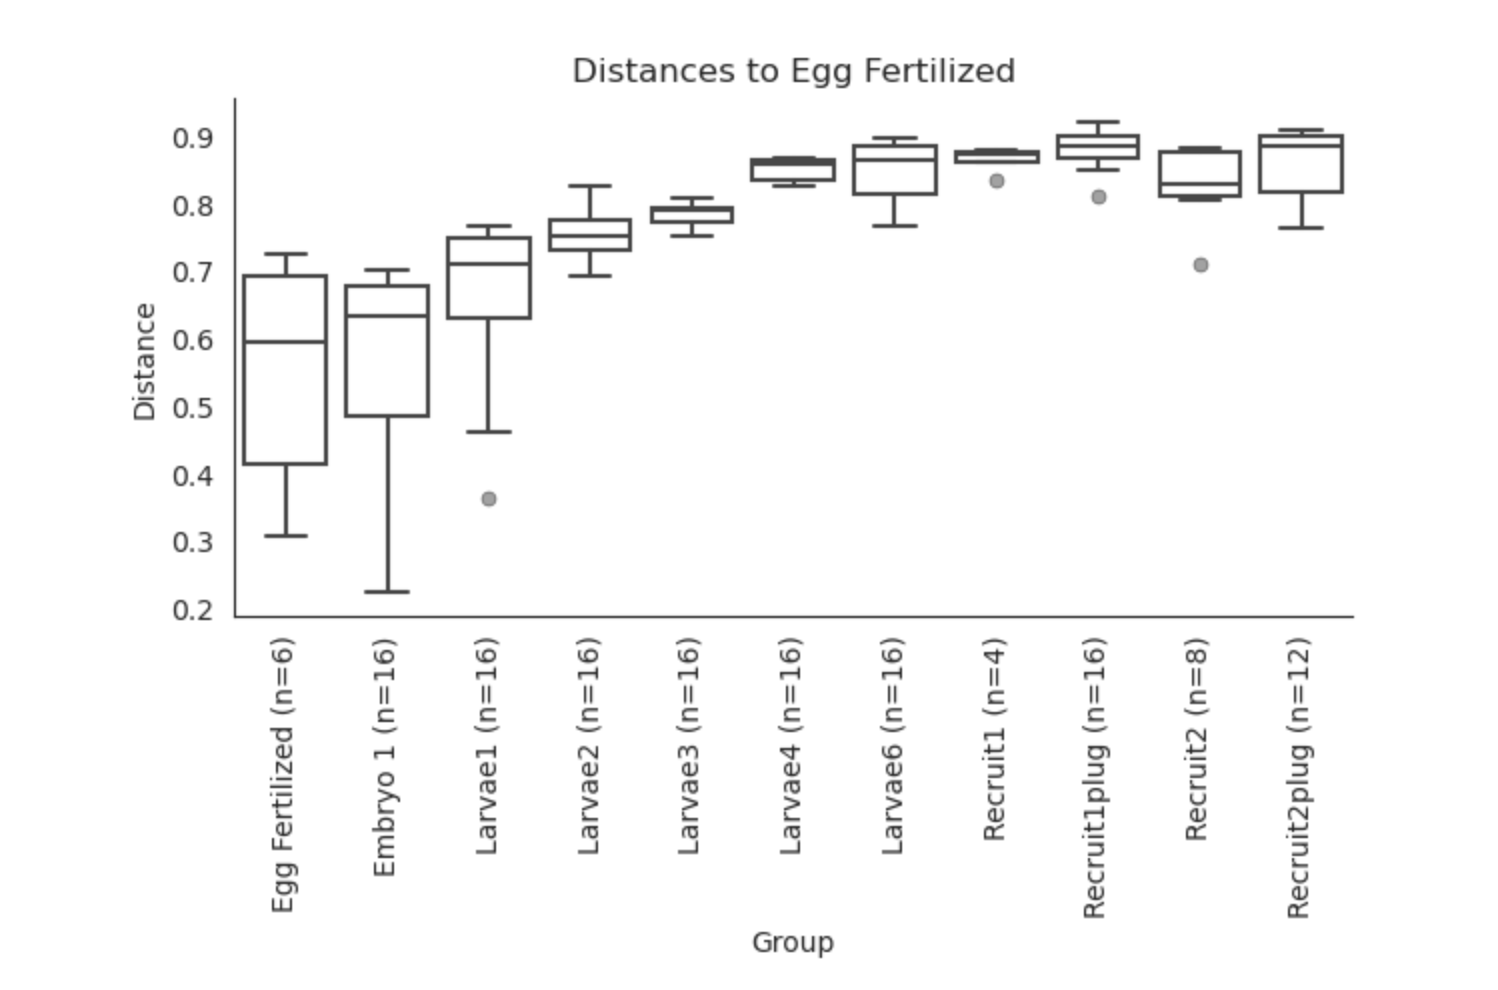
Unifrac PERMANOVA group distances:
We can now build other visualizations in R.
Based on these preliminary analyses, it looks as though we have some interesting groupings by lifestage.
All data can be found on GitHub here.
Based on the QIIME2 visualizations (above) we appear to have differences in microbial communities between samples/lifestages. From here, we can visualize results in R.
R scripts can be found here on GitHub.


