E5 Environmental Timeseries Analysis Part 3
Environmental data analysis for the E5 Rules of Life Project continued.
Overview
The purpose of this analysis is to generate descriptive site environmental data for use in manuscripts.
Part 1 of analysis
Part 2 of analysis
Filling gaps in temperature data
Because there was strong correlation between the two types of temperature probes as described in Part 2, we can “fill the gaps” in our timeseries by adding pH probe temperature data to the Hobo logger data (e.g., site 1 data missing early in the time series in the Hobo data).
mutate(FullTemp=if_else(is.na(Hobo), Temp, Hobo)
We can then use the filled temperature time series for analysis.
Generating box plots of environmental parameters
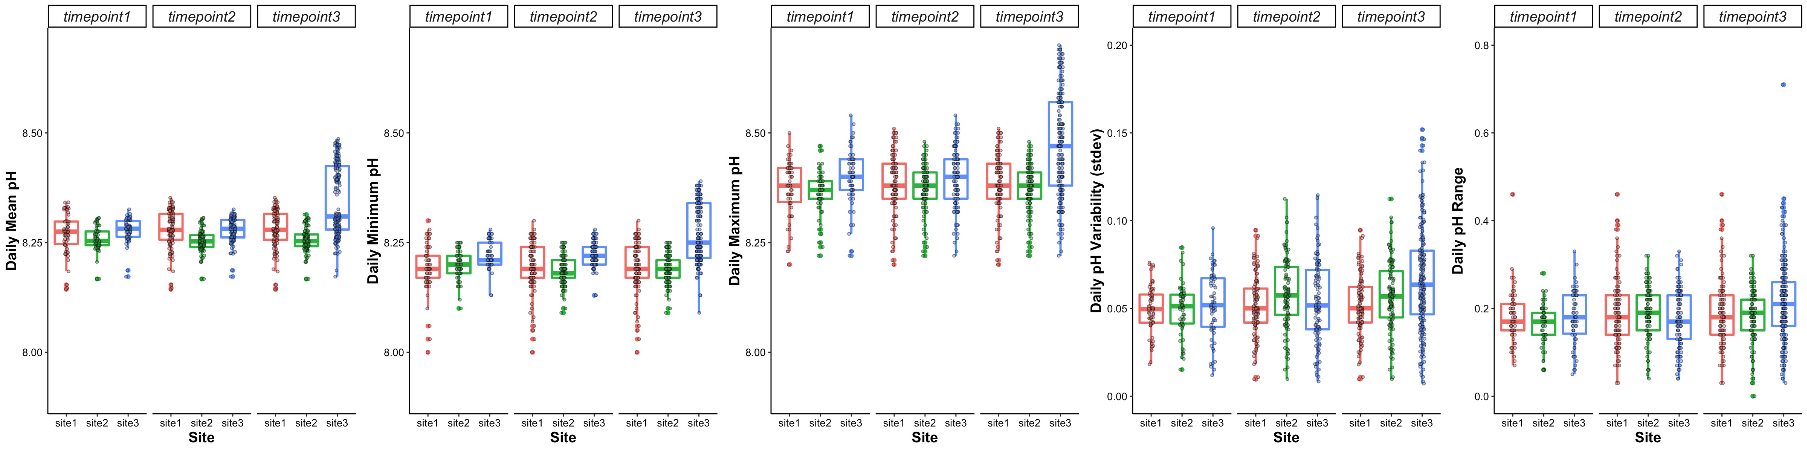
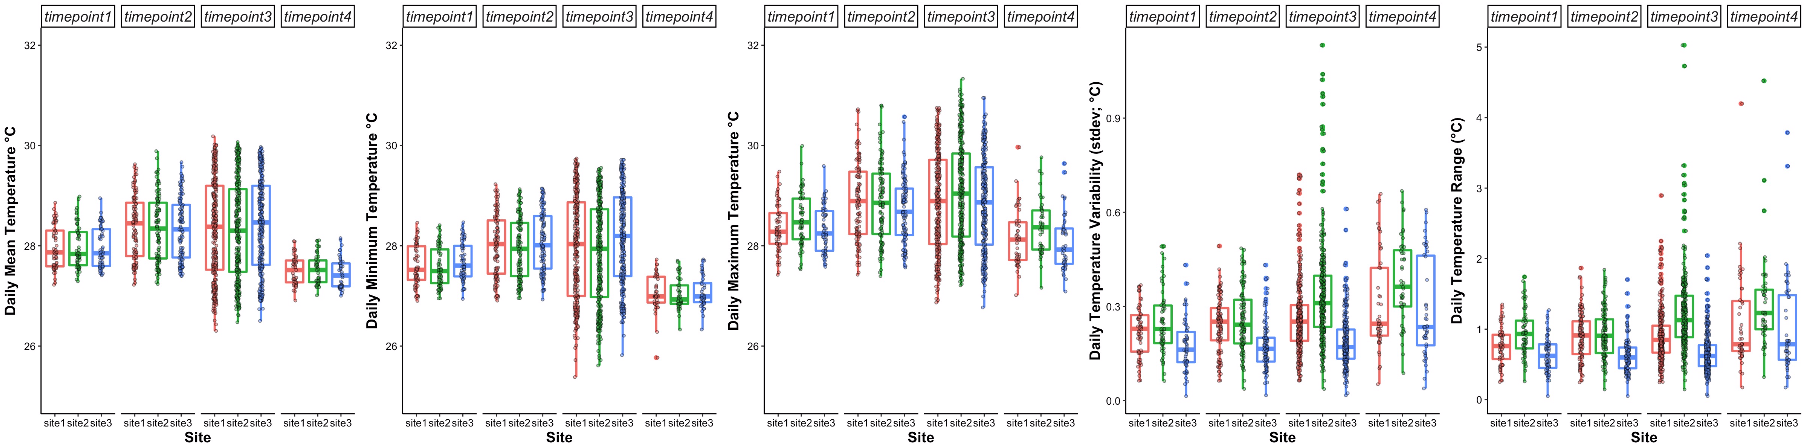
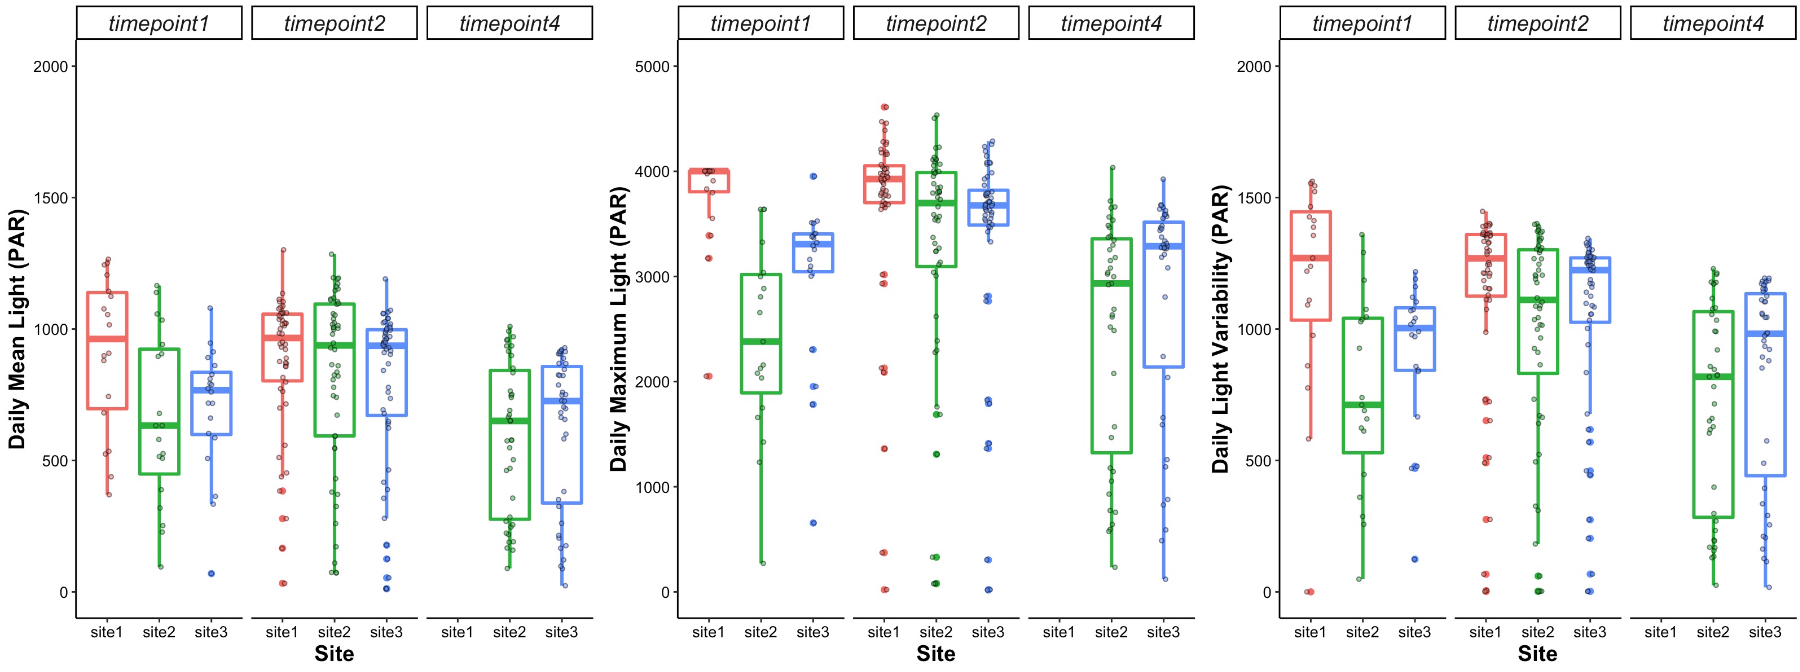
I then generated box plots to show the differences in temperature, pH, and light at each site. For each metric, I calculated statistics including mean, min, max, range, and stdev.
Temperature:
Light (did not calculate min or range, unnecessary for this type of data that resets to 0 each day):
pH: