


Revising Figures for Mcapitata Development 2020 Project
This post shows newly revised figures and revisions to analysis for the 2020 Montipora capitata development project.
The datasets analyzed today include respirometry (photosynthesis and respiration), gene expression (TagSeq), metabolomics, ITS2 (symbiont communities), and 16S (microbial communities).
For more information on this project, see my notebook posts.
1. Respirometry
I generated a new respirometry plot that places respiration, photosynthesis, and P:R ratios on the same plot. This plot shows the mean and standard error for each of these metrics.
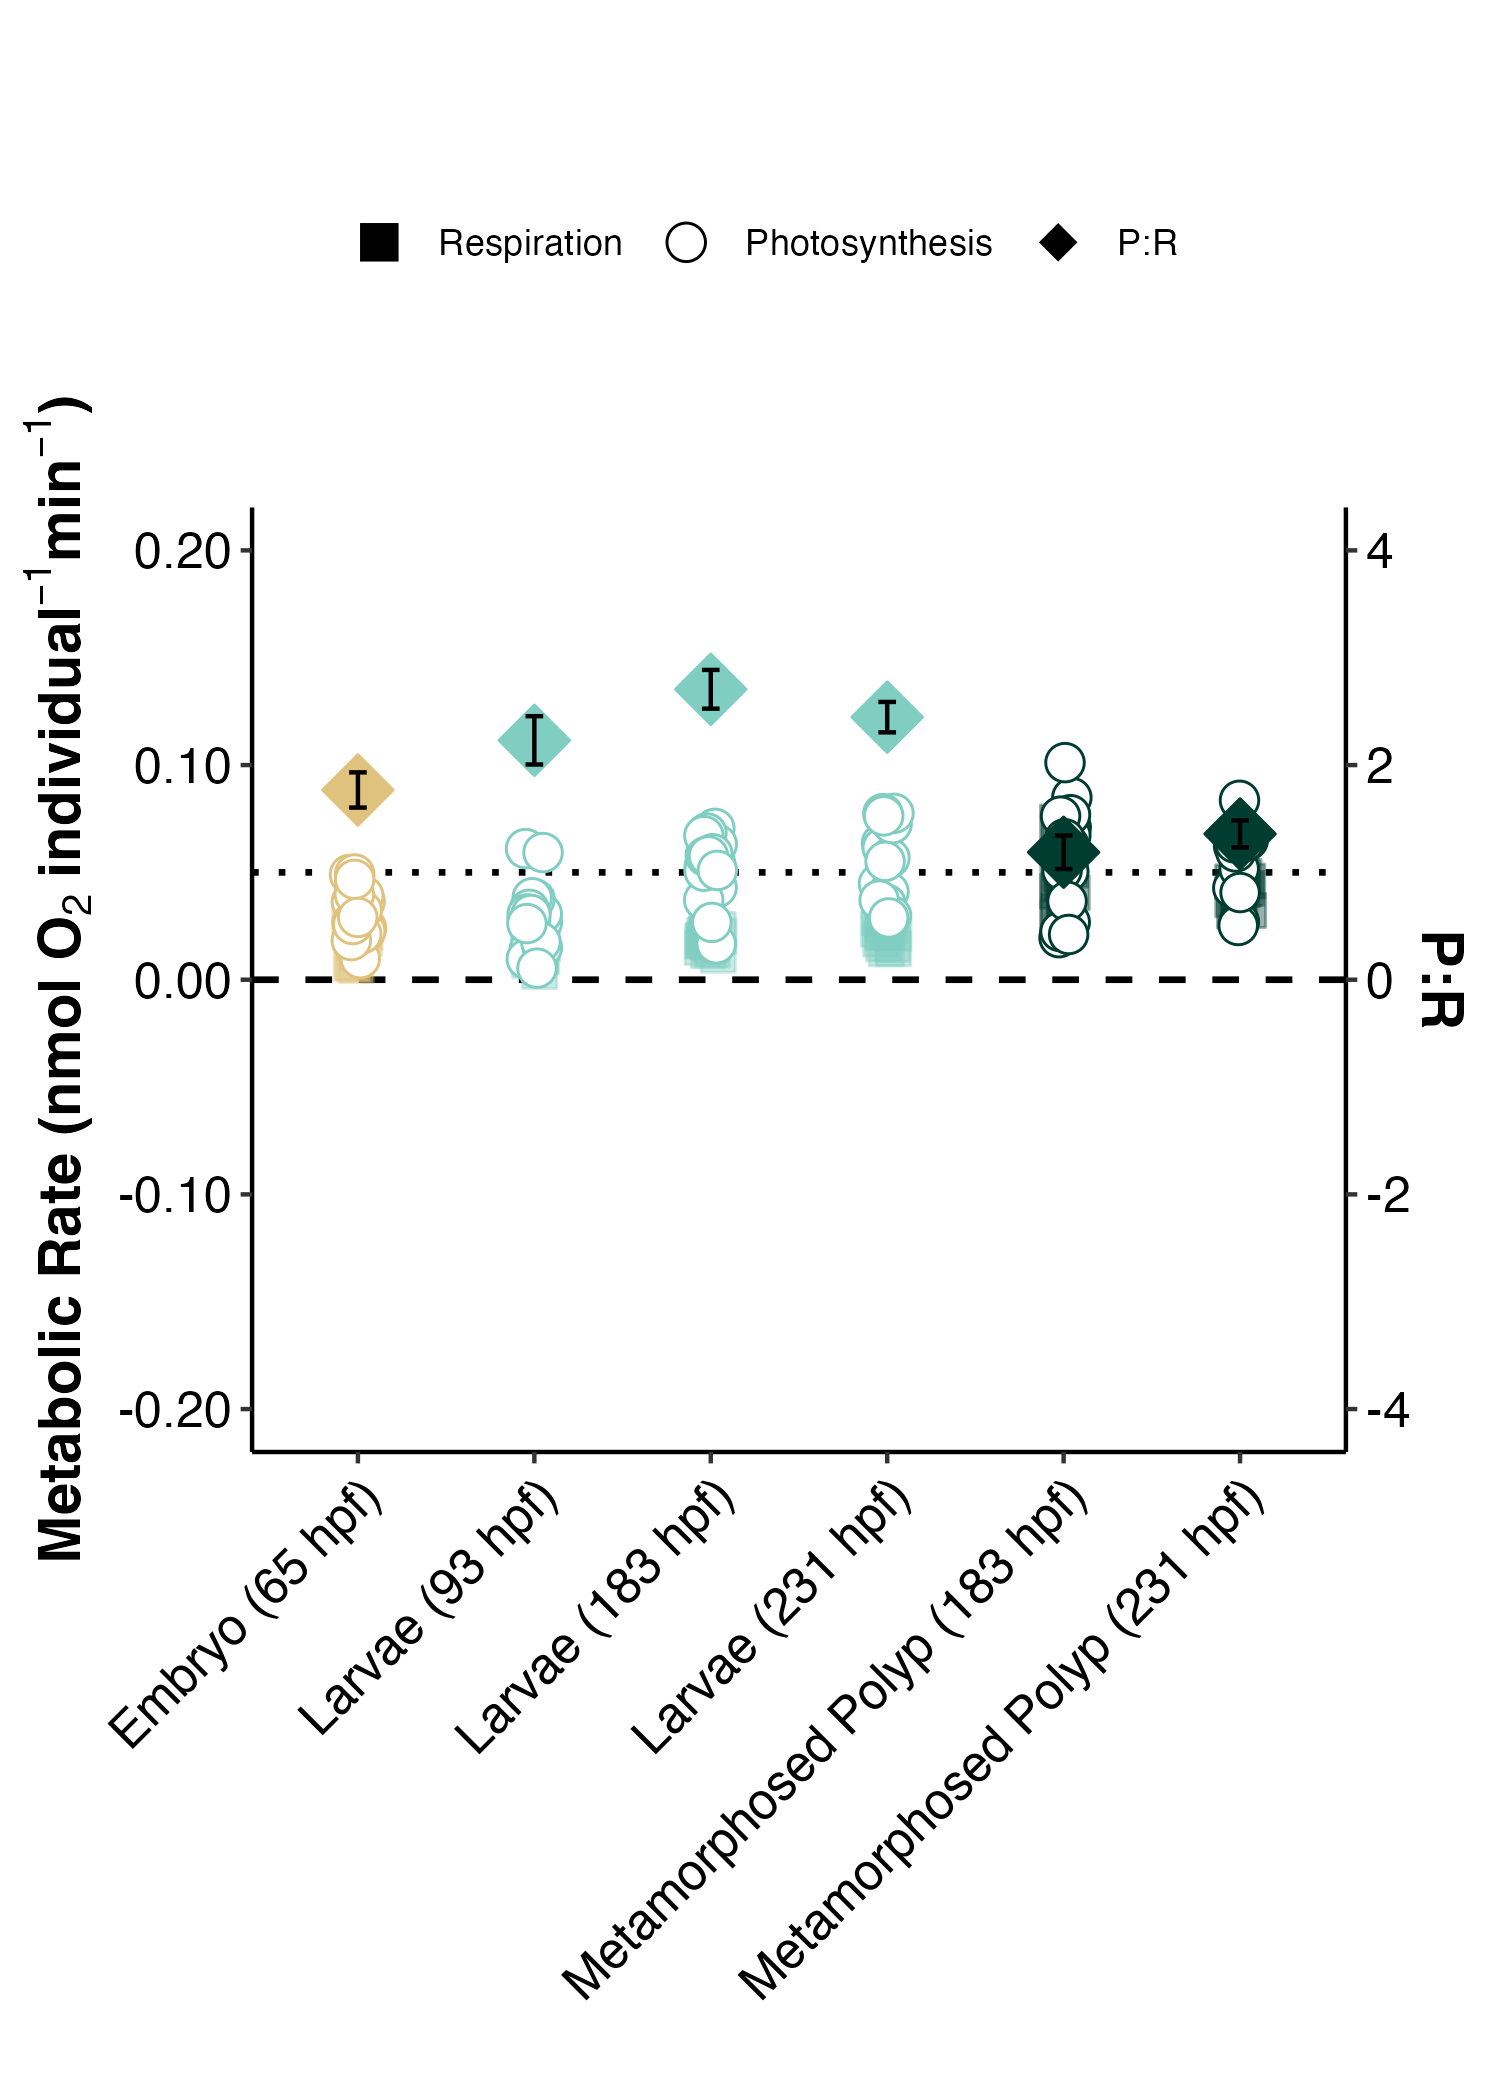
This plot shows gross photosynthesis (oxygen produced; open circles) and respiration (oxygen consumed; closed squares) metabolic rates (nmol O2 per larva per minute) across developmenal age (hpf; hours post fertilization) and lifestage group (yellow, embryo; cyan, larvae; green, metamorphosed polyp). Ratio of gross photosynthesis : respiration (P:R) displayed on the secondary y axis. Dashed line indicates metabolic rates of 0. Dotted line indicates a P:R ratio of 1:1, indicating photosynthesis is equal to respiratory demand. P:R ratios greater than 1 indicate metabolic surplus (photosynthesis > respiration).
Main takeaways:
- Photosynthesis rates increase across development
- Respiration rates are highest in metamorphosed polyps compared to larvae sampled on the same day.
- P:R ratios increase across development due to increases in photosynthesis.
- In metamorphosed polyps, high respiration rates result in low P:R ratios approaching 1 (P = R), indicating low excess energy available for growth, metabolism.
2. Gene expression
In this analysis, I revised the aesthetics of our gene expression plot and identified larger patterns of gene expression across development for functional analysis.
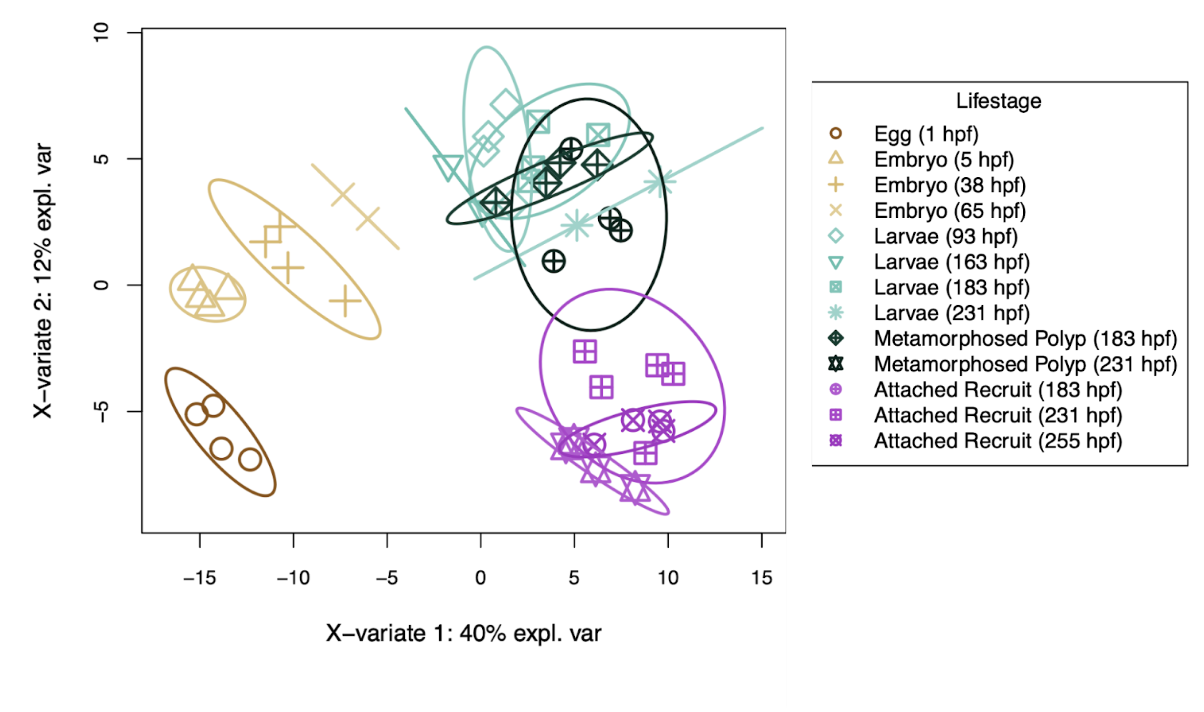
First, I revised the PCA plot of gene expression so that across all datasets, lifestage categories share the same shape and color key.

This plot shows that there is significant variation in gene expression between life stages. Eggs are brown, embryos are yellow, larvae are cyan, metamorphosed polyps are green, and attached recruits are pink.
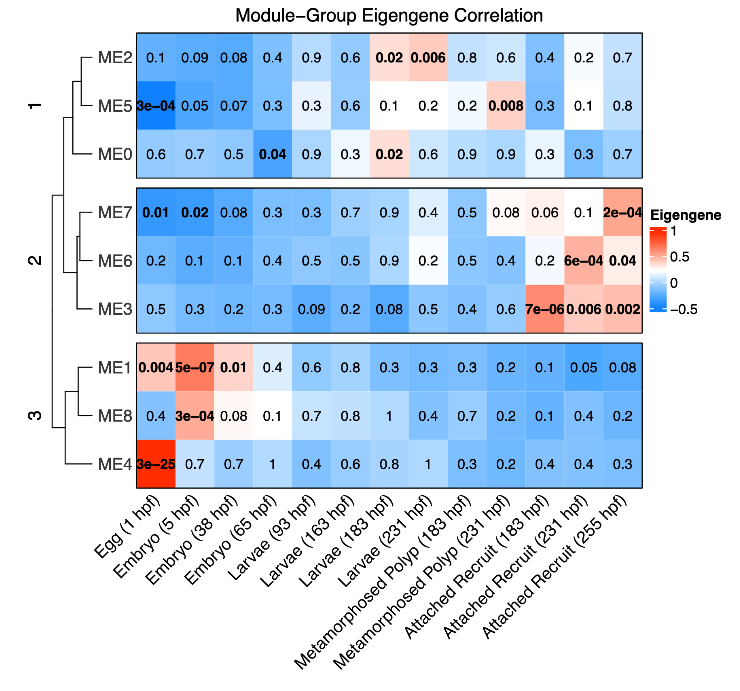
I then revised the WGCNA module-eigengene correlation plot to remove the dendrogram by lifestage and order by developmental stage.
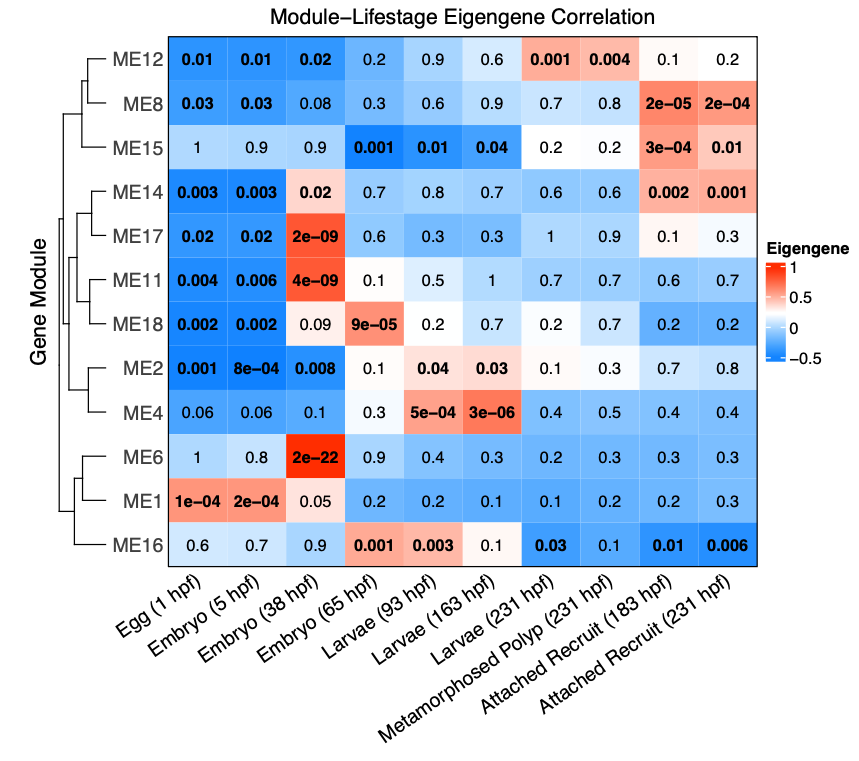
Next, I revisited functional enrichment analyses and added an analysis that grouped modules of genes in three trends - those that are highest in early development, highest in mid-development, and highest in late development.
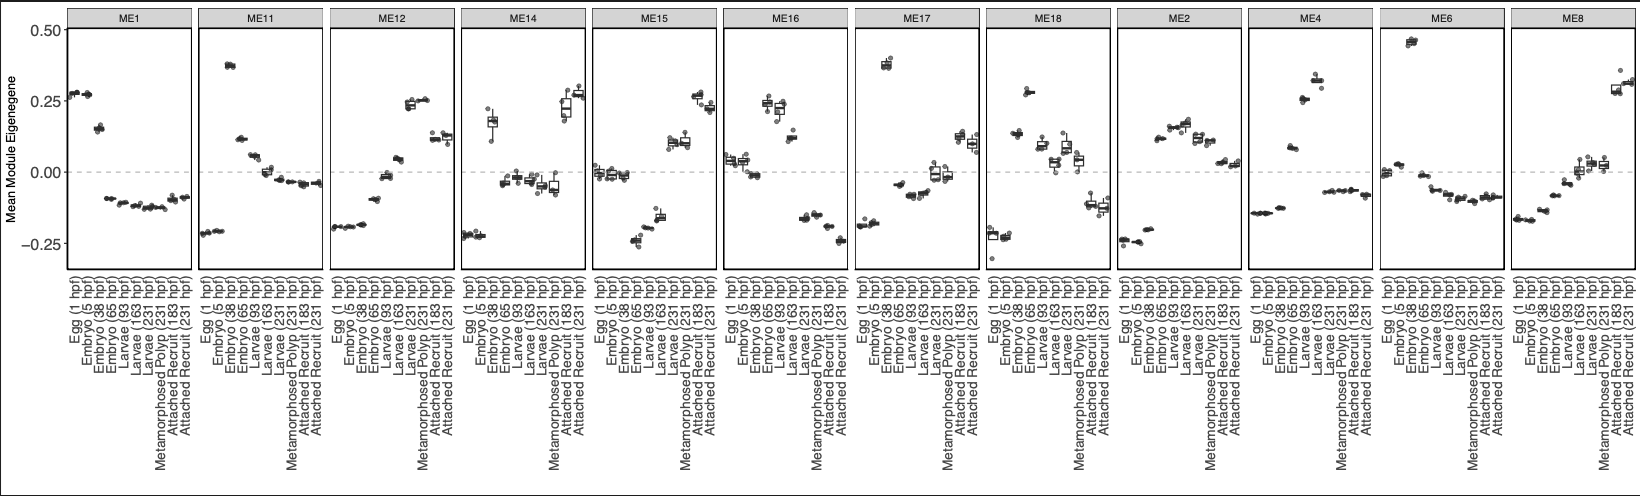
These trends were determined from the above eigengene expression plots:
- Highest in early development: ME1, ME11, ME6; 5159 genes
- Highest in mid development: ME16, ME2, ME4; 4682 genes
- Highest in late development: ME12, ME15, ME17, ME8; 5844 genes
When I plot eigengene values aggregated by these patterns, the patterns are confirmed.
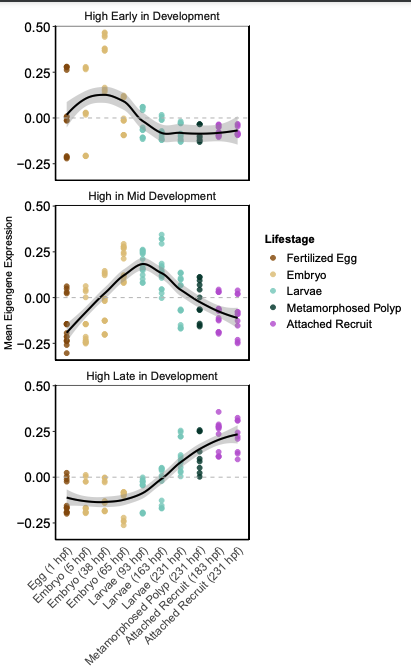
I then conducted functional enrichment analysis for the genes included in each of these three patterns using GoSeq in R. I revised these figures from the GoSeq standard grid format to a dot plot. Increasing dot size indicates increasing significance.
Significantly enriched functions at the level of developmental patterns:
Biological Process Go Terms

This plot shows enriched functions for each ontogenetic pattern.
Molecular Function Go Terms

Then, here are the significantly enriched functions for each life stage, which reflects what I see at the level of ontogenetic pattern.


In these plots, the dots are colored by lifestage.
Main Takeaways
- Gene expression changes across development
- Functions in early development (eggs and embryos) relate to differentiation, DNA damage and replication, and RNA processes.
- Functions in mid development are focused on metabolism, protein metabolism, signal transduction. We also see the emergence of response to oxidative stress, which could indicate increased response to symbiont populations. There is also increased ion transport, dytoskeleton development, and receptor pathways. These responses relfect the signals of metamorphosis we might expect as well as the transition towards symbiotic interactions.
- In late development, many larval functions in metabolism, signal transduction, and transport continue. There is additionally enrichment of TCA cycle genes and transmembrane transport, which might point to metabolism of symbiont derived products.
- Molecular functions of interest include increased peroxidase (antioxidant) activity in late development as well as carbonate dehydratase activity, which could be related to carbon concentration mechanisms in symbiotic interactions and/or calcification processes.
3. Metabolomics
I used a similar approach to gene expression to modify figures for metabolomics analysis and visualize enrichment in major lifestage patterns. There is no new analysis for this data, but aesthetic revisions for figures.
First, metabolomic profiles are different by lifestage visualized with a PLS-DA.
As done in gene expression, I then revised the WGCNA heatmap to be ordered by lifestage/time point rather than by a sample dendrogram.
From the WGCNA, there are a clear set of modules associated with early development (eggs and embryos), mid development (larvae and metamorphosed polyps), and late development (attached recruits). These resulted in three module clusters which were analyzed for functional enrichment.
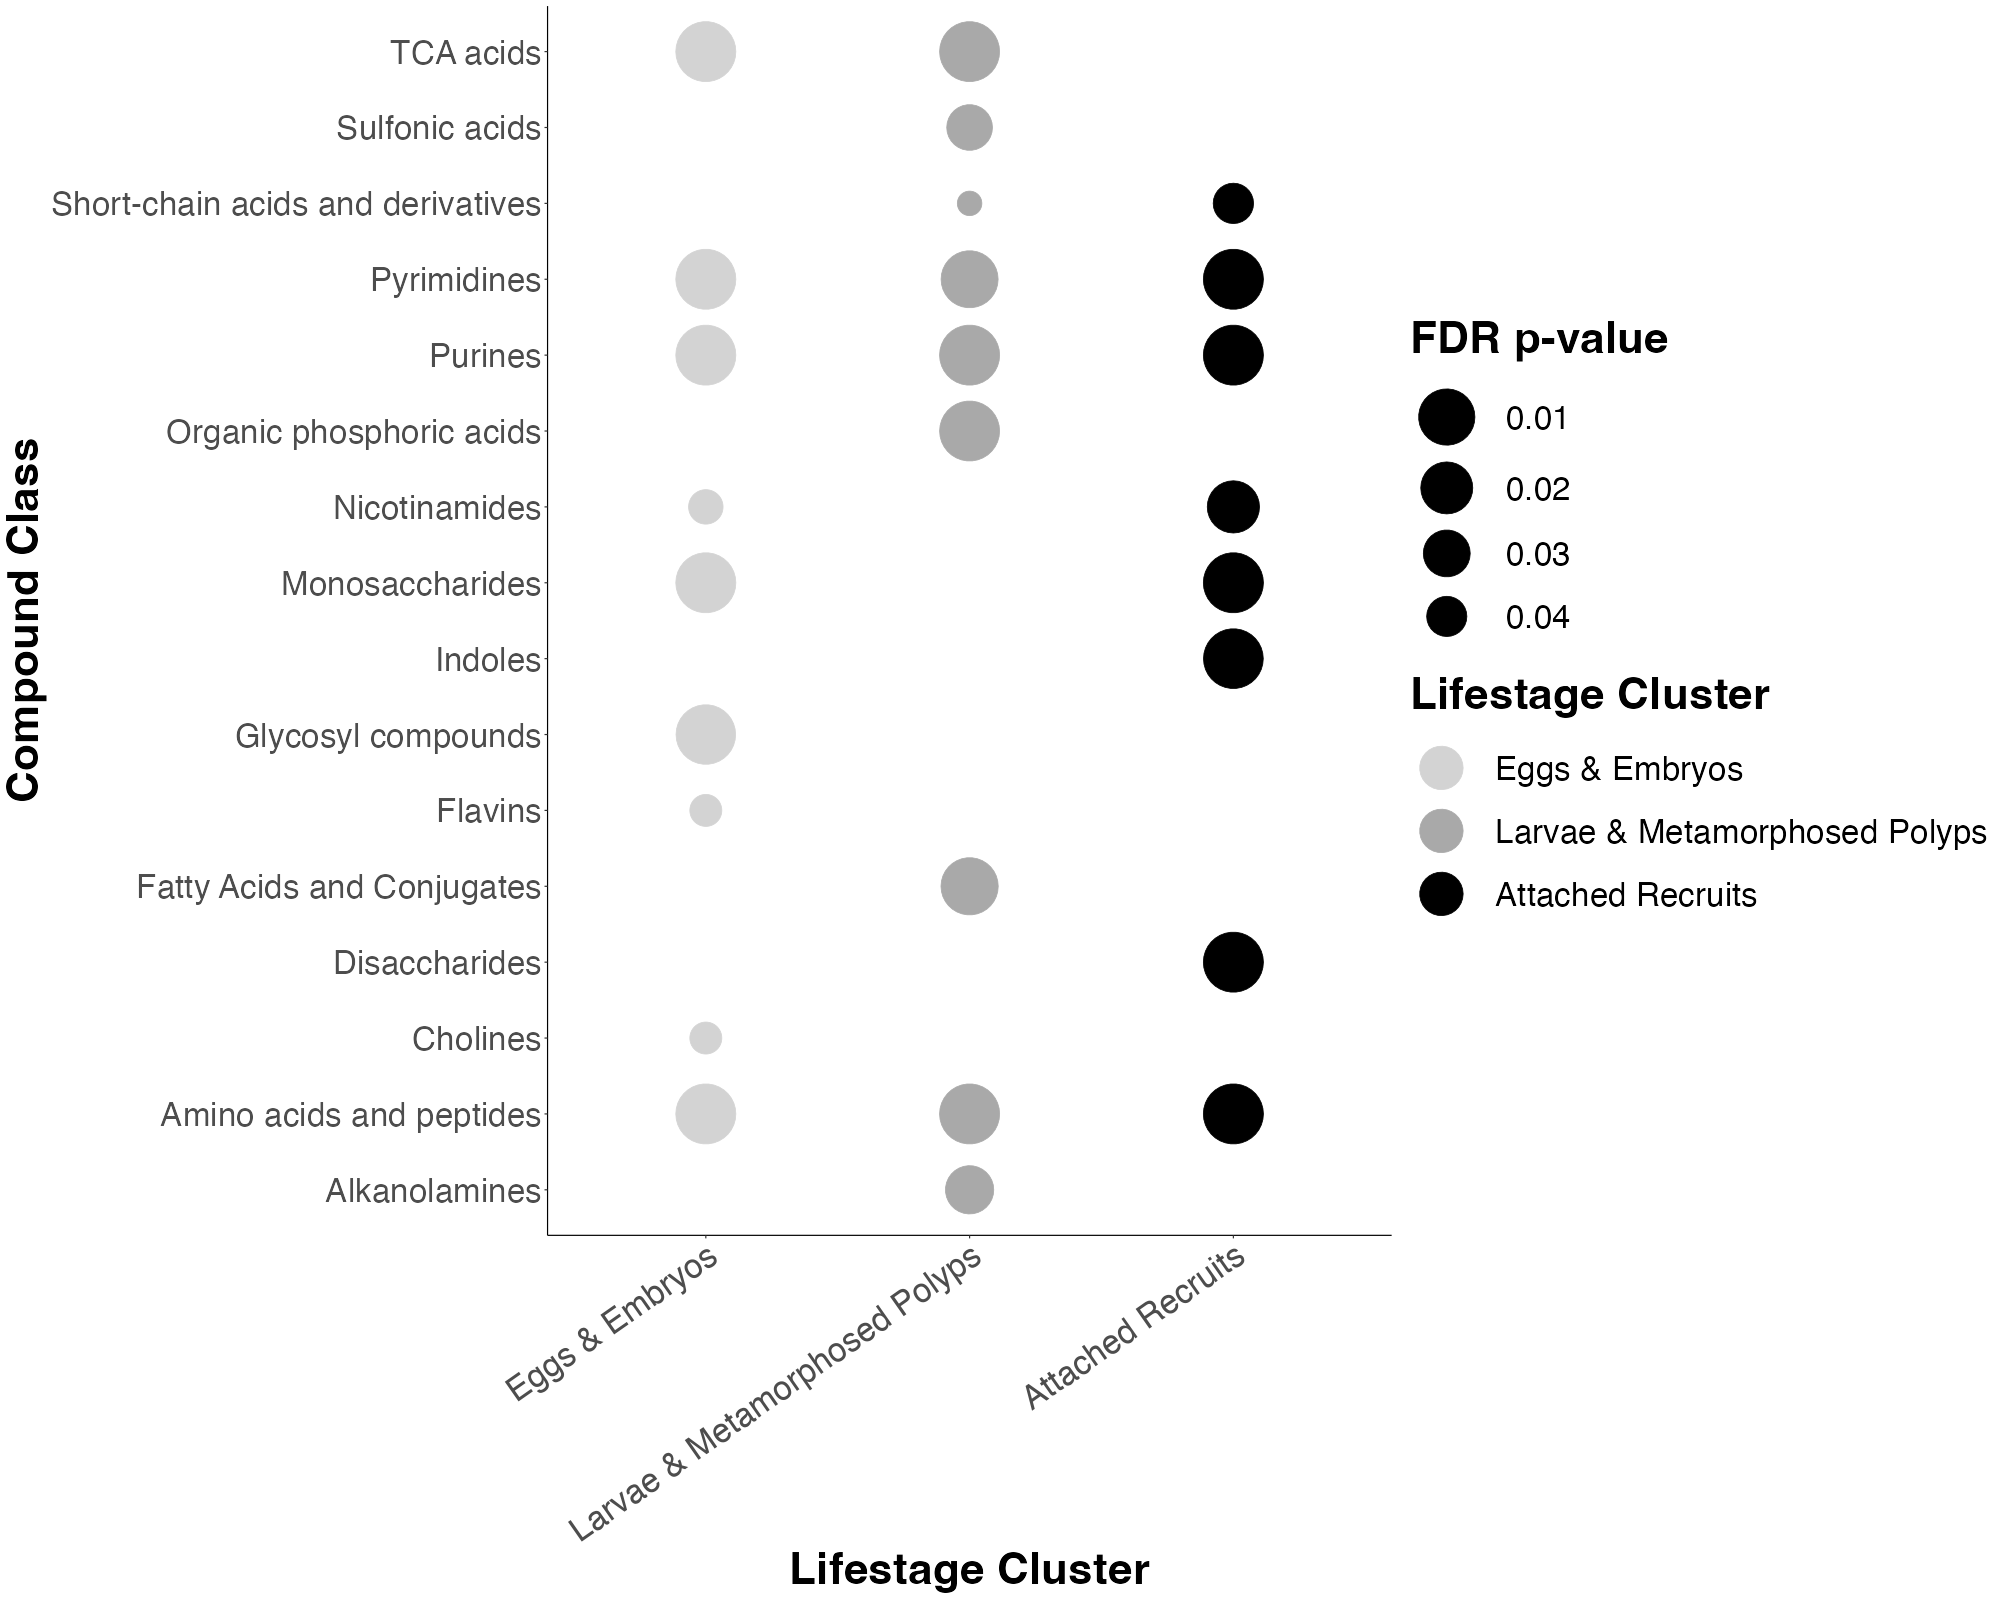
Previously, enrichment analyses were summarized in tables from MetaboAnalyst output. I instead converted these to dot plots with dot size indicating significance.
The enriched compound classes in each ontogenetic category look like this.
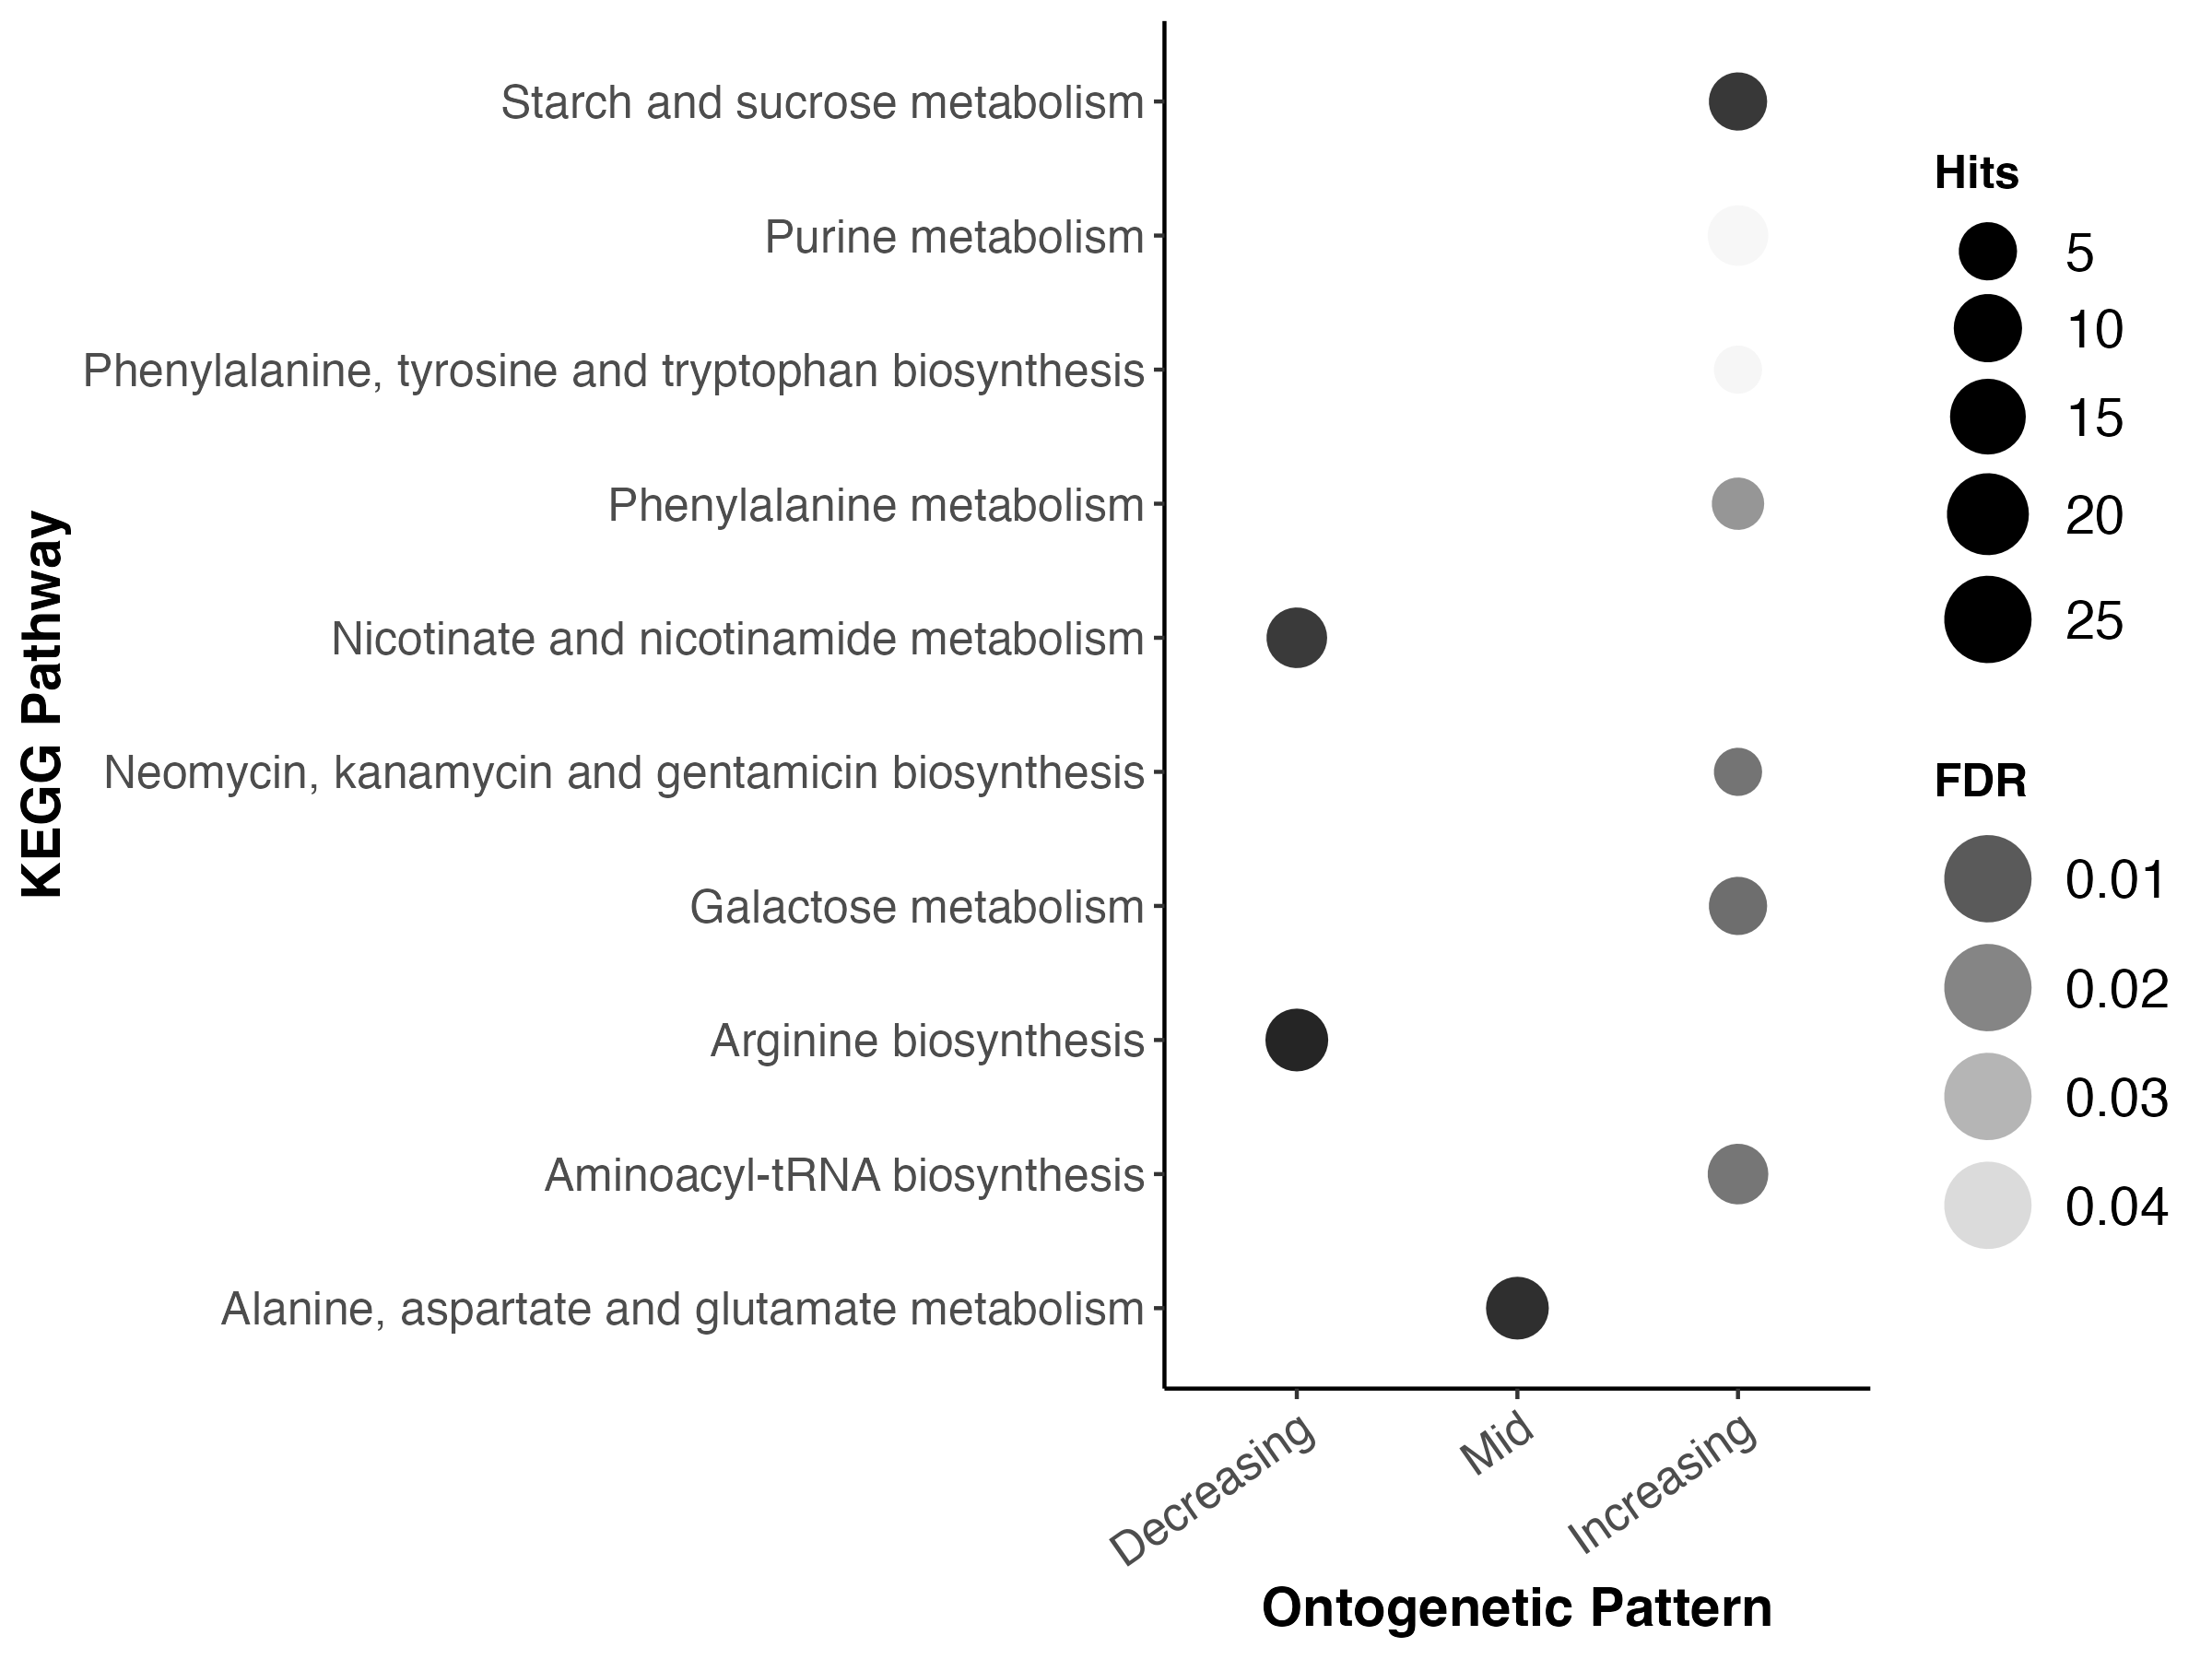
The enriched KEGG pathways are:
Main Takeaways
- Metabolomic profiles are different across lifestages and development
- There is enrichment of mono- and disaccharides in later development
- There is enrichment of short chain acids in mid development
- Metabolomic pathways for galatose metabolism and starch metabolism are enriched in later development
4. ITS2
I revised several figures for ITS2 and generated heatmaps of relative abundance of dominant taxa.
First, I ran an NMDS to look at variation across lifestages.
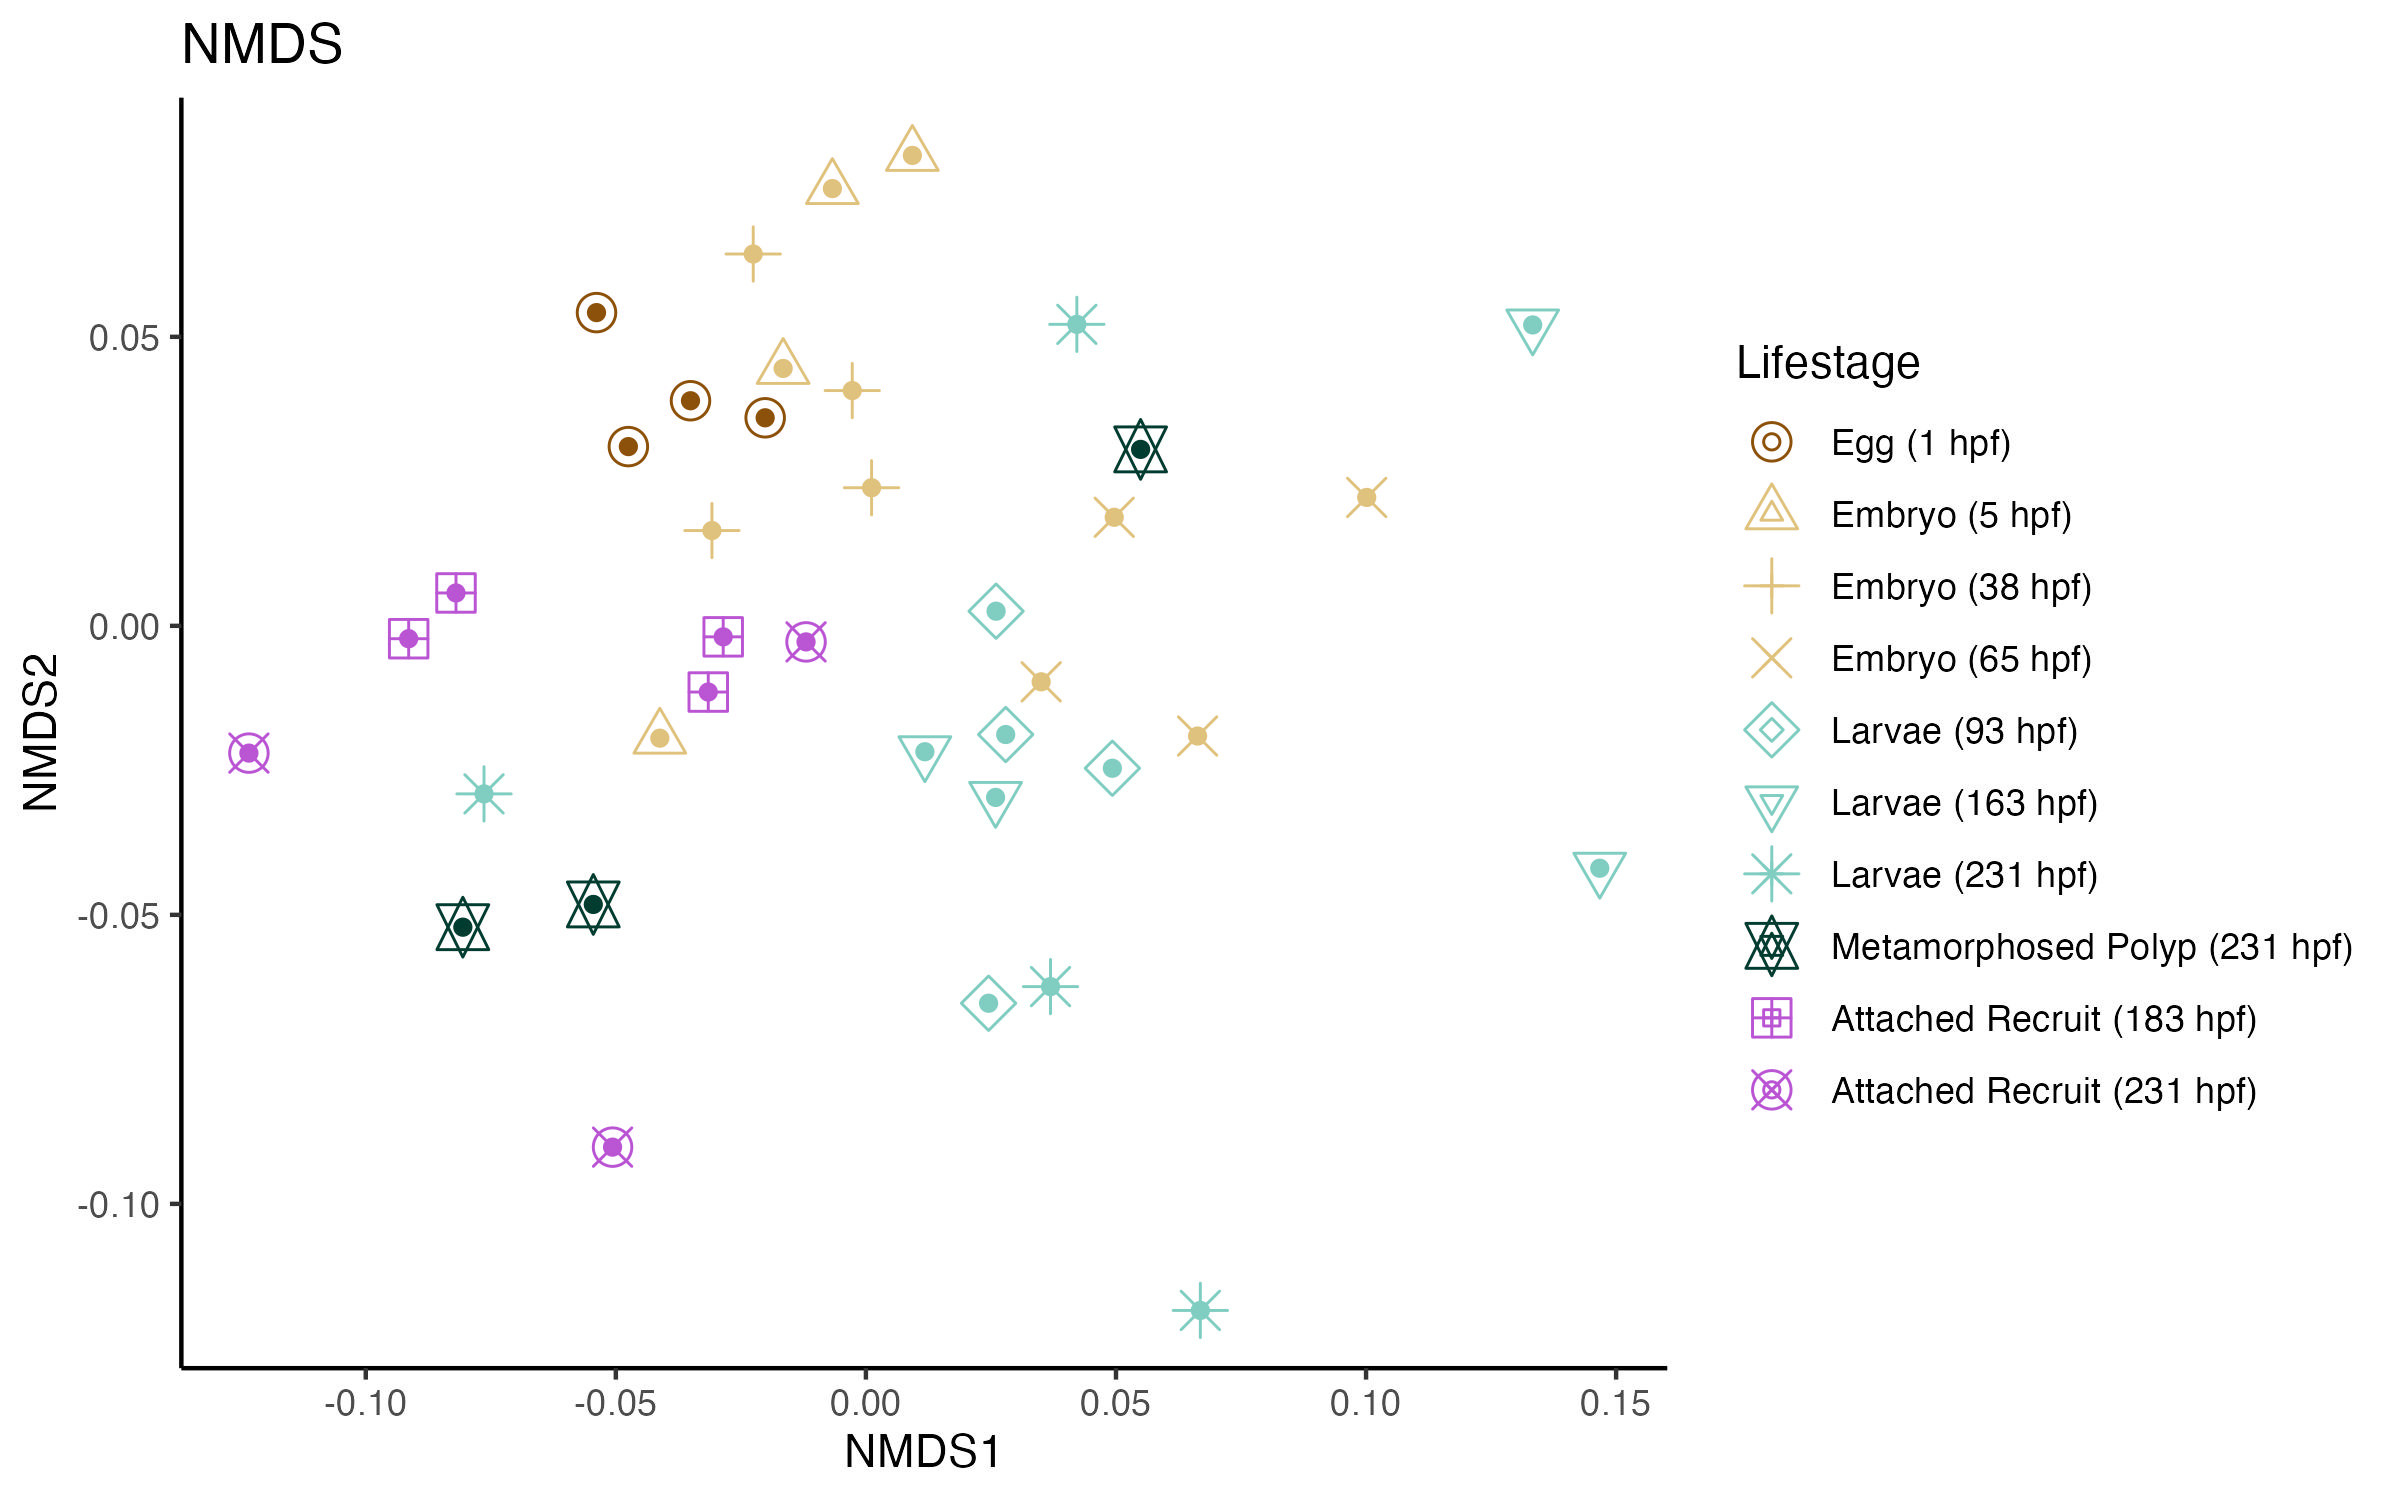
The NMDS output was as follows:
Wisconsin double standardization
Run 0 stress 0.3063051
Run 1 stress 0.3251615
Run 2 stress 0.3067365
... Procrustes: rmse 0.03914559  max resid 0.1315725
Run 3 stress 0.3067695
... Procrustes: rmse 0.04046434  max resid 0.1386581
Run 4 stress 0.3152037
Run 5 stress 0.3191622
Run 6 stress 0.33028
Run 7 stress 0.3065274
... Procrustes: rmse 0.0288657  max resid 0.09075154
Run 8 stress 0.3137992
Run 9 stress 0.3148884
Run 10 stress 0.3308144
Run 11 stress 0.3157462
Run 12 stress 0.3400135
Run 13 stress 0.3344455
Run 14 stress 0.3126967
Run 15 stress 0.3288603
Run 16 stress 0.3066168
... Procrustes: rmse 0.04042574  max resid 0.1230252
Run 17 stress 0.3151585
Run 18 stress 0.3236442
Run 19 stress 0.3344677
Run 20 stress 0.336296
*** Best solution was not repeated -- monoMDS stopping criteria:
    20: stress ratio > sratmax
Stress levels for this analysis were high (~0.3), indicating there was poor fit. This makes sense as there was a very week significant separation by lifestage determined by a PERMANOVA analysis.
Permutation test for adonis under reduced model
Terms added sequentially (first to last)
Permutation: free
Number of permutations: 999

adonis2(formula = phyloseq::distance(GP1_rare, method = "bray") ~ lifestage, data = metadata)
          Df SumOfSqs      R2  F Pr(>F)
lifestage  9  0.32526 0.24325  1  0.492
Residual  28  1.01190 0.75675
Total     37  1.33715 1.00000
There is no clear pattern of separation by lifestage.
I then visualized relative abundance of dominant symbiont ITS2 DIV’s as those >1% relative abundance.
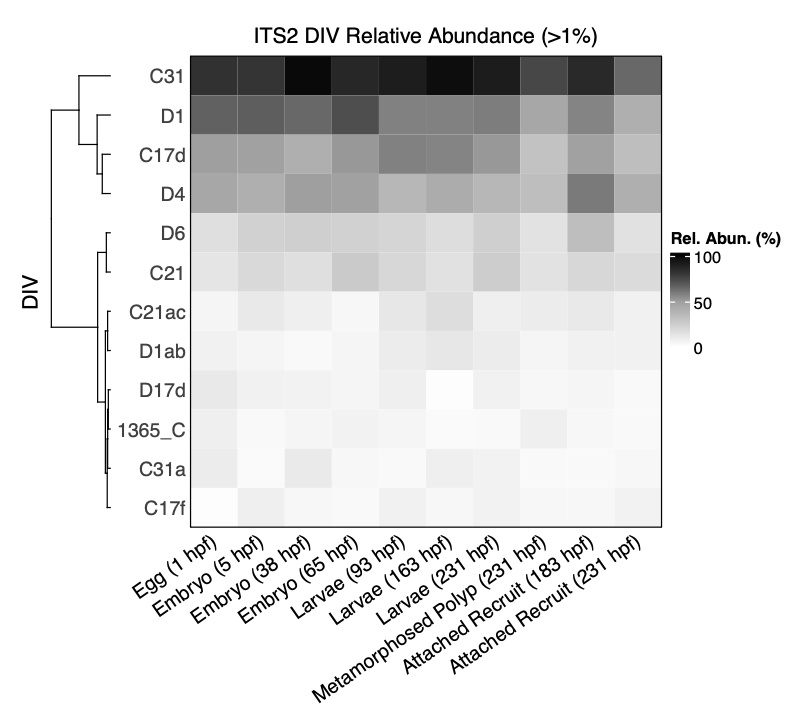
The main community members are stable throughout development.
Main Takeaways
- Symbiont community doesn’t seem to change across deveopment
- C13 is the most abundant symbiont type
- C31, D1, C17d, and D4 are the most abundant symbionts with several others composing the more rare symbiont members
5. 16S
Finally, I conducted 16S analysis for this project. A full post on the 16S analysis can be found here.
Briefly, I visualized microbial community beta diversity using an NMDS analysis.
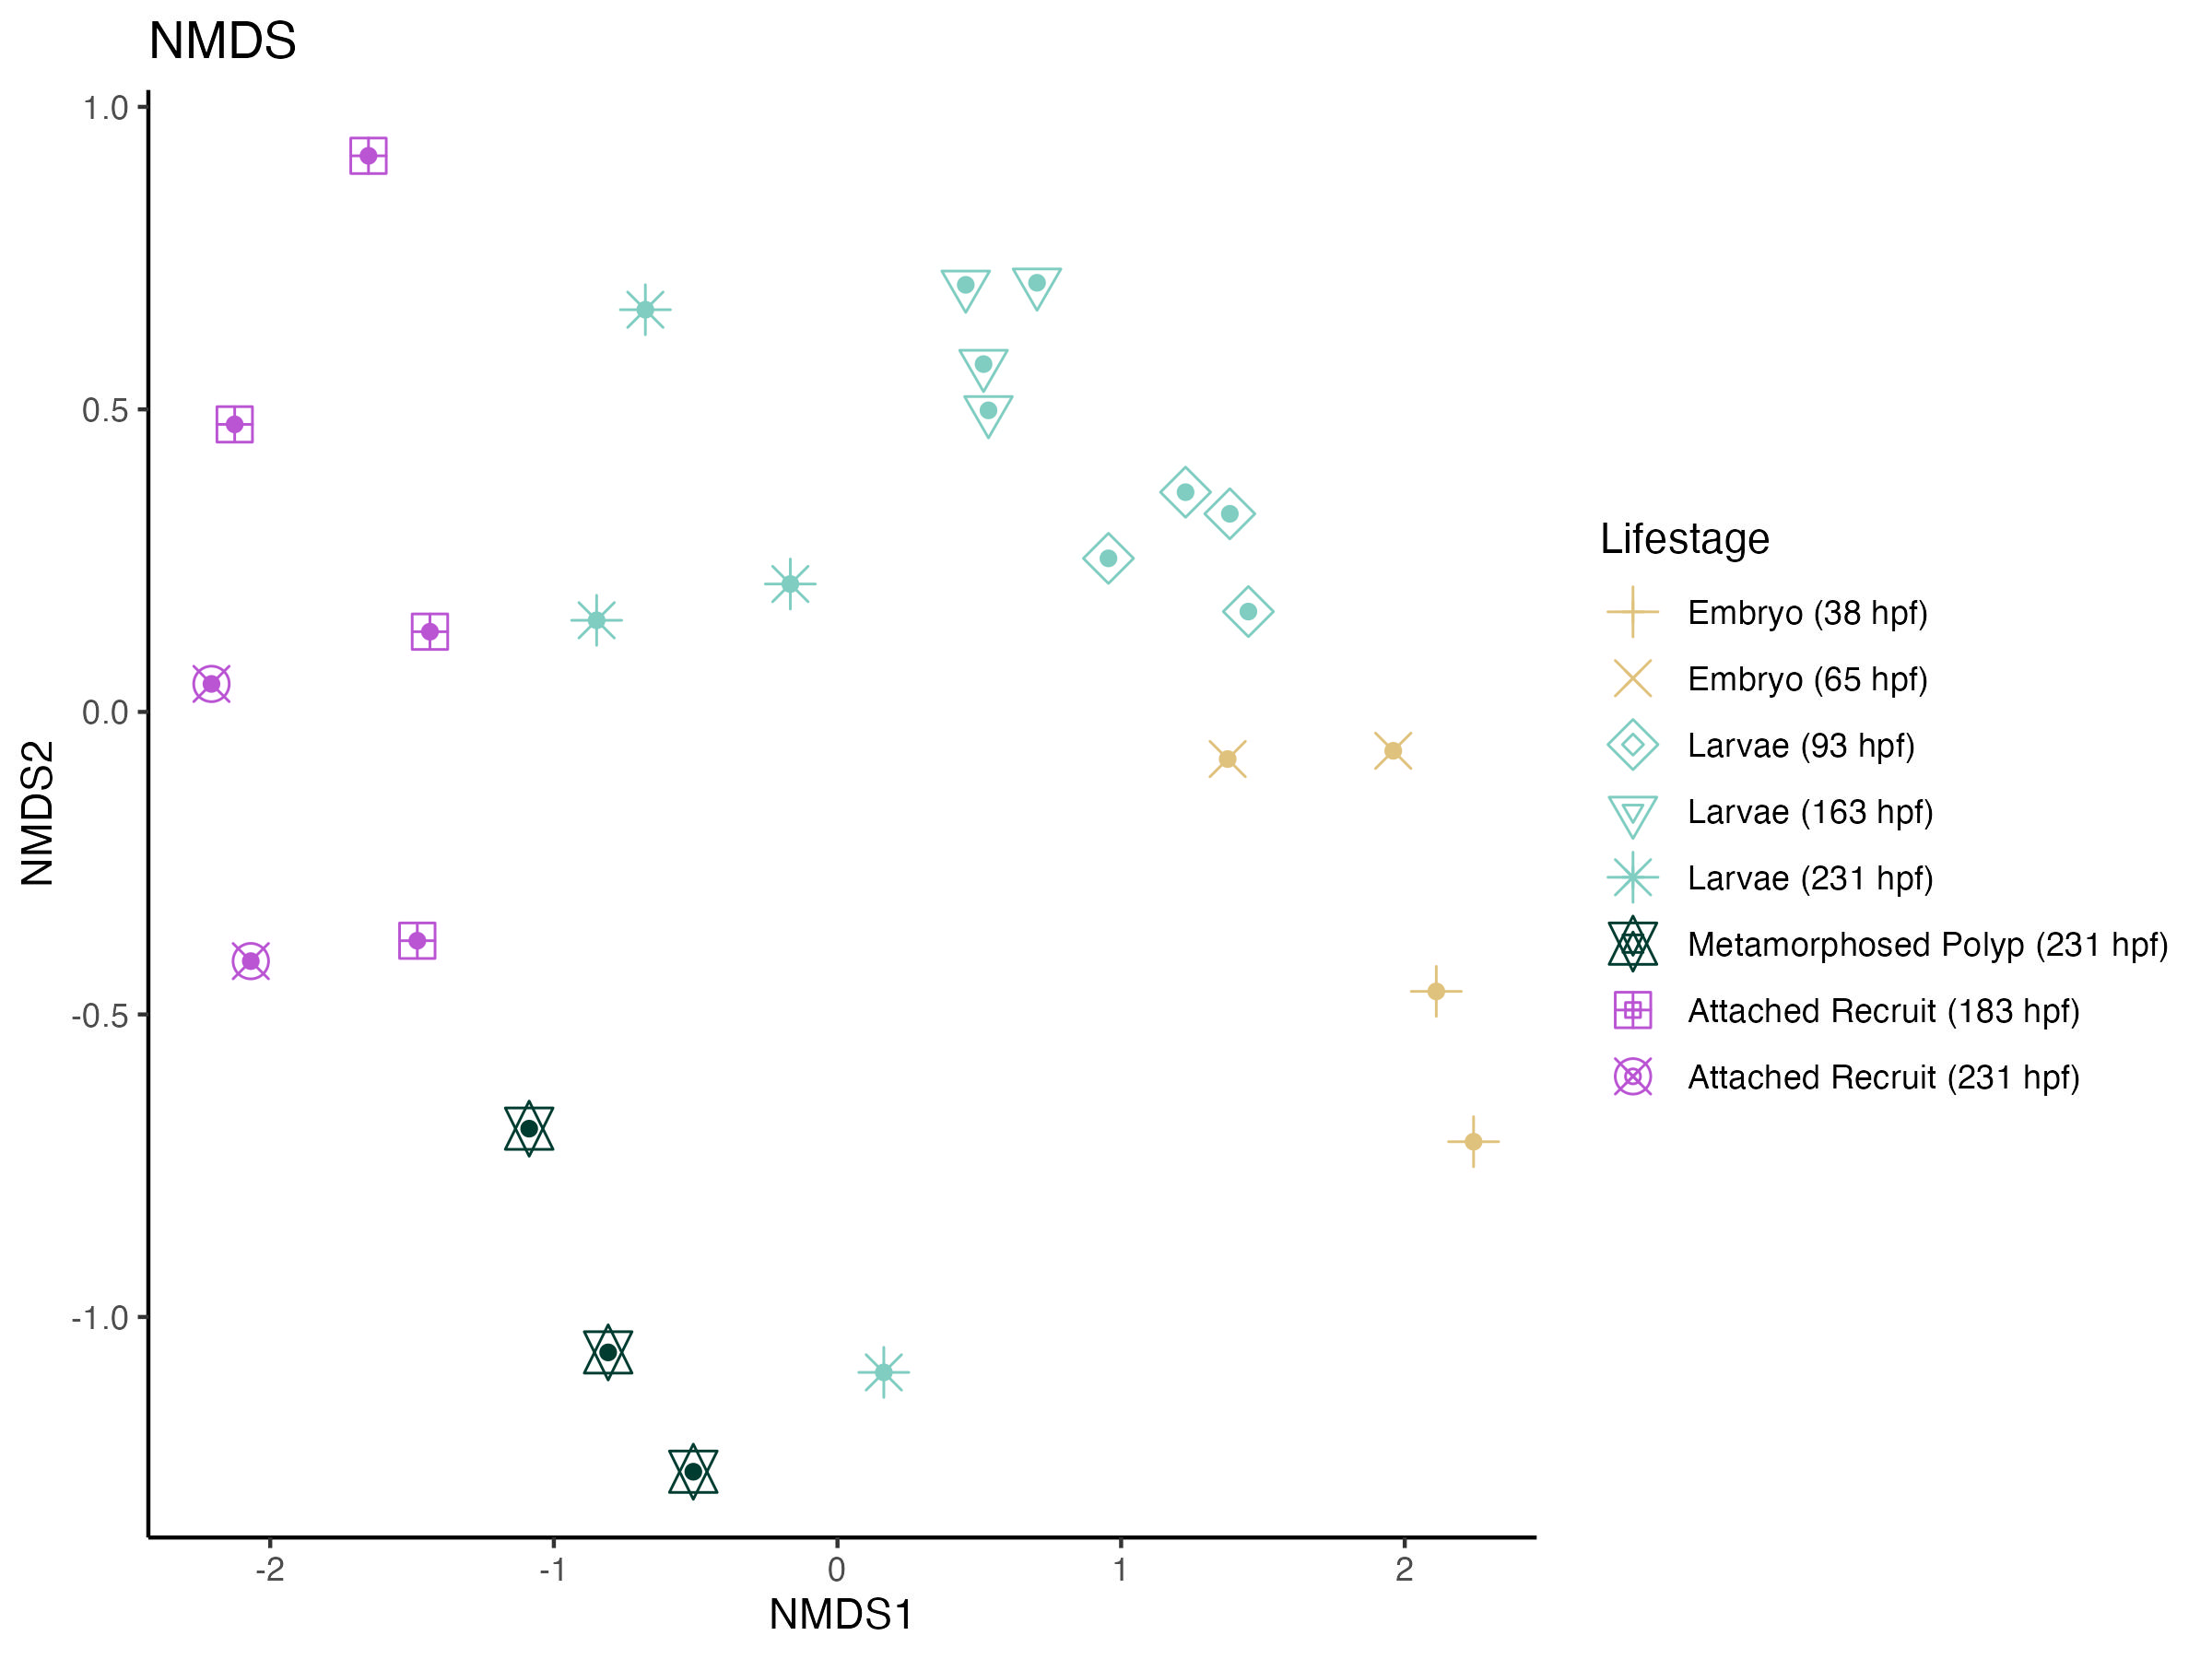
This shows that there is variation in 16S profiles across developmental stages.
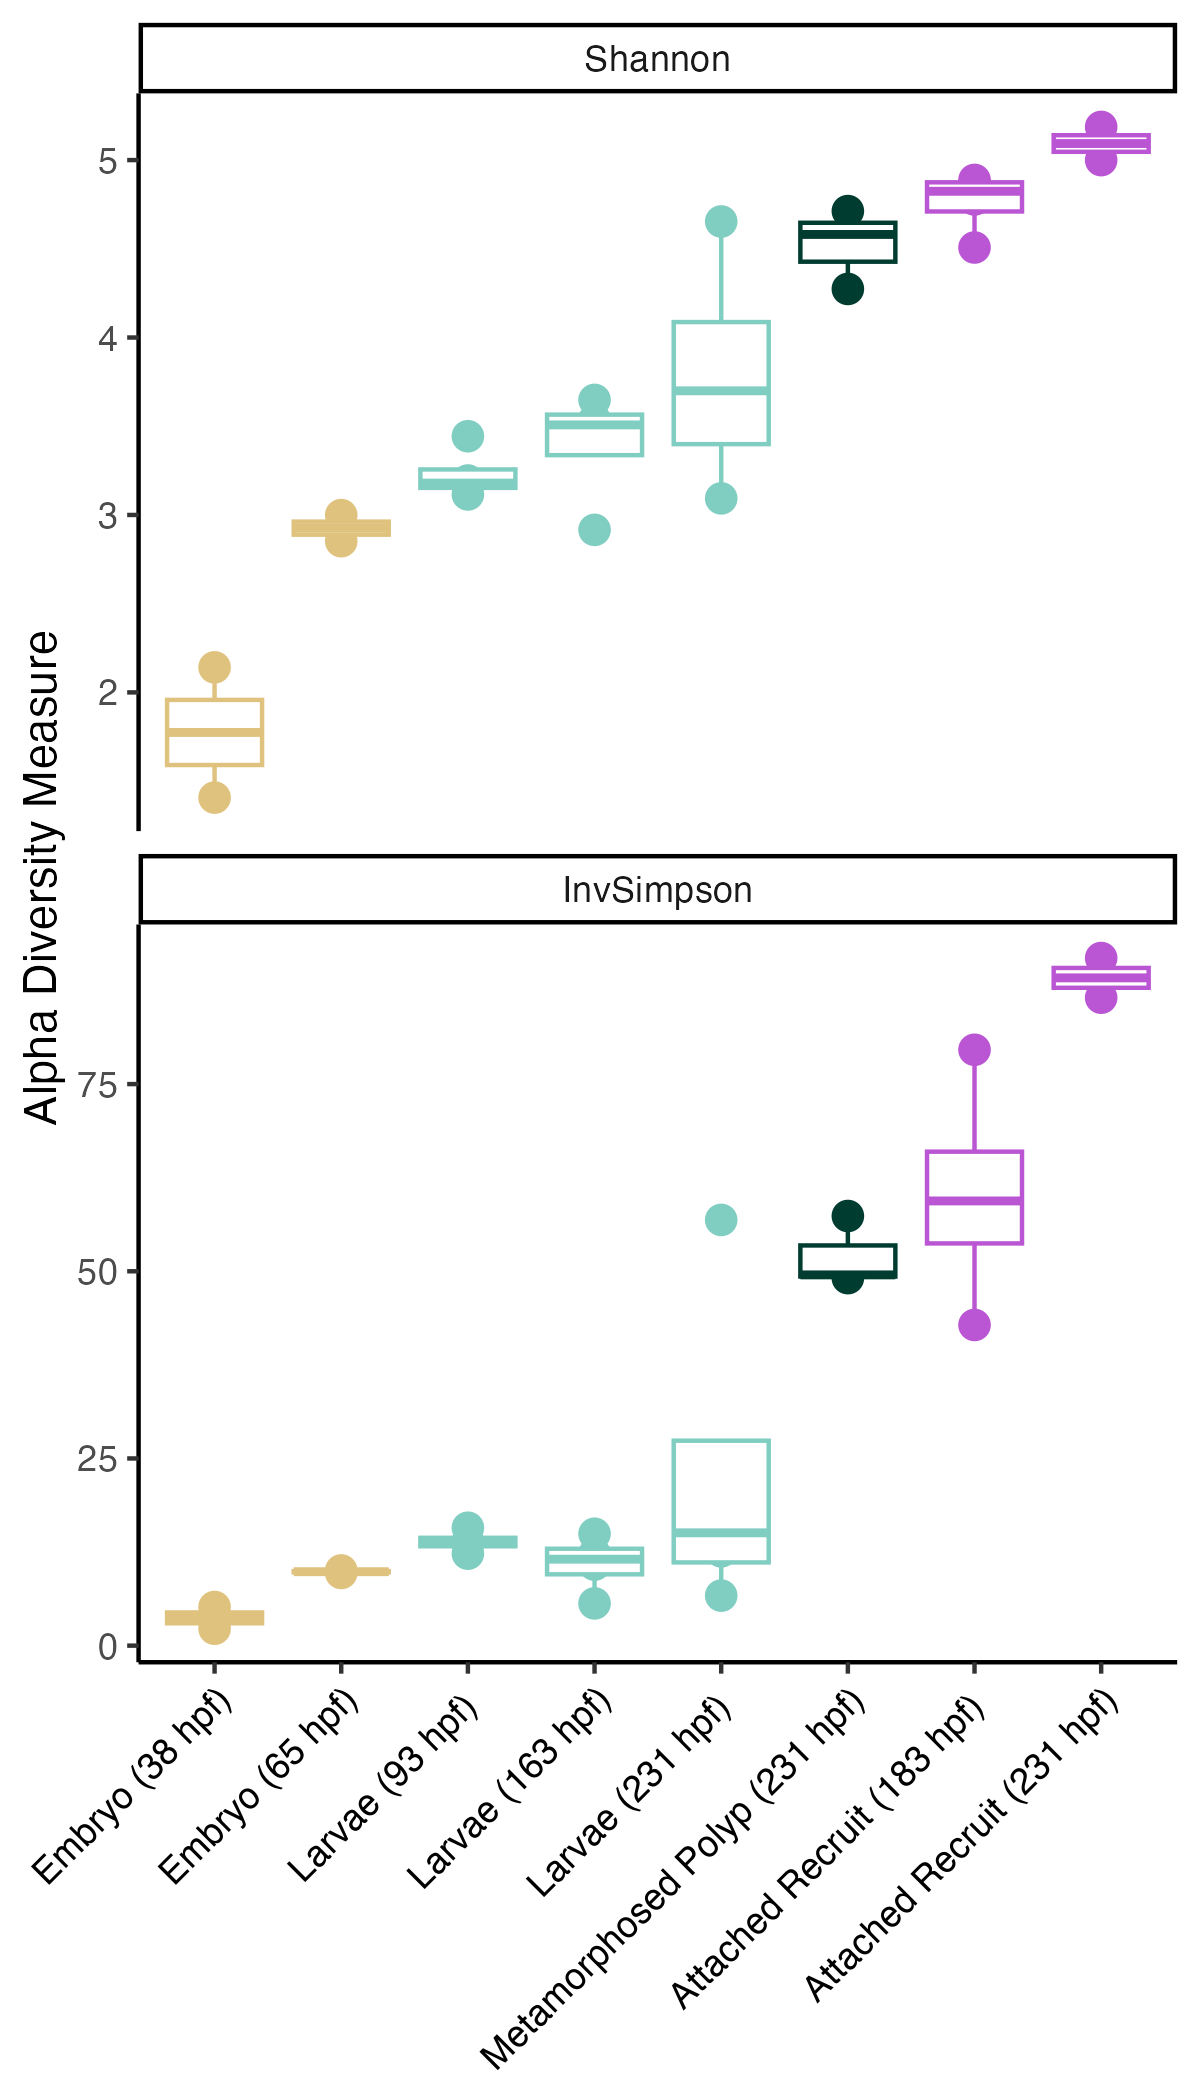
Additionally, alpha diversity increases with development shows as Shannon and Inverse Simpson indices.
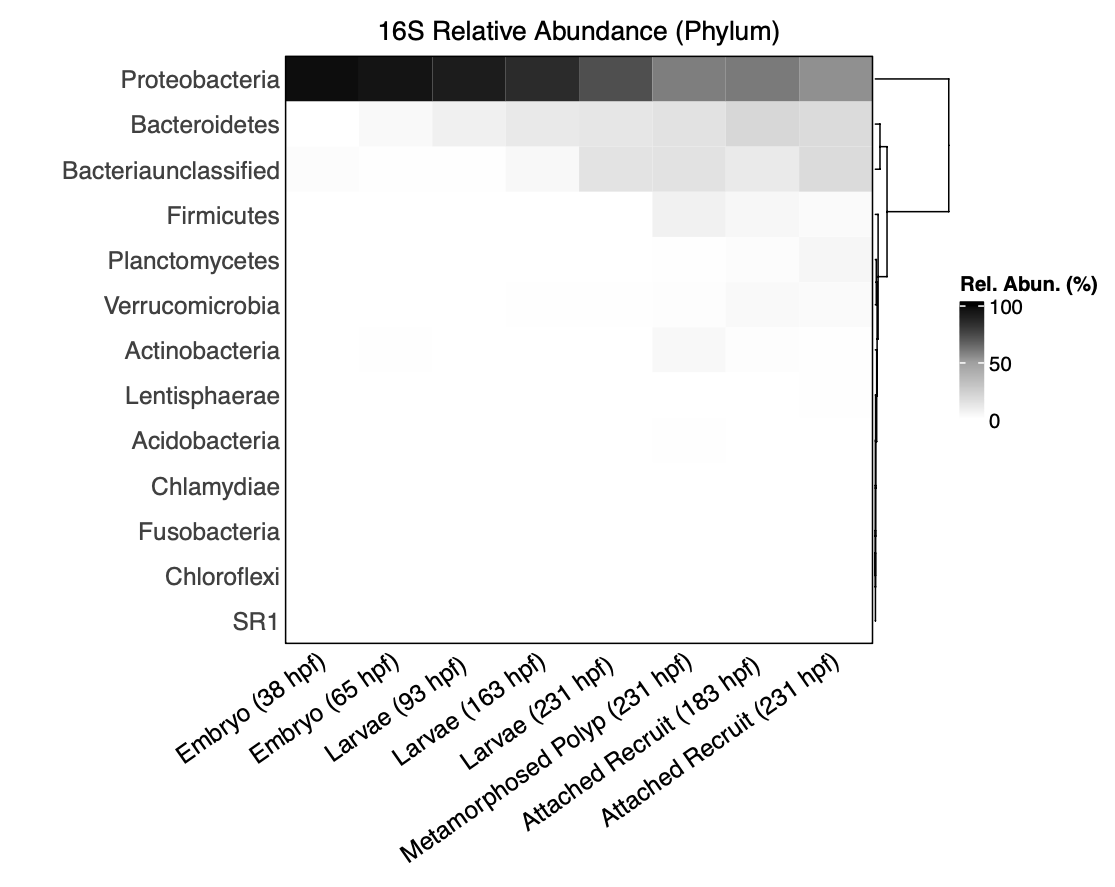
I then plotted relative abundance of all taxa by phylum:
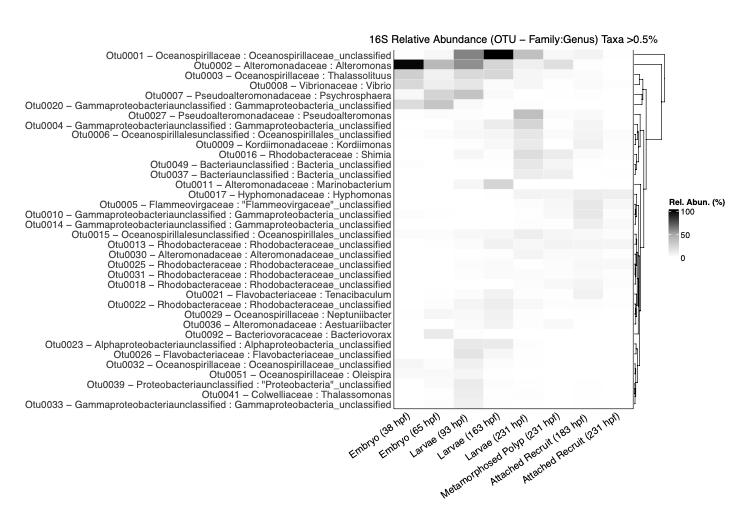
And then by genus:species only for taxa >0.5 relative abundance.
Main Takeaways
- Bacterial communities vary by lifestage with alpha diversity (number of different taxa) increasing with development.
- We see that samples are dominated by Proteobacteria. It appears that Bacteriodes and unclassified Bacteria increase in later life stages.
- I noticed that in earlier lifestages there is a higher prevalence of Vibrio spp. There is also a peak of Oceanosprilliacaea (unclassified) in mid points of early life history. Alteromonas peaks in early stages of embryos. Pseudoalteromonas, Rhodobacteraceae, and Kordiimonadaceae are more prevalent in later time points.
Next steps
My next step will be to export a matrix of ITS2 and 16S abundance data to input into a multi-omic analysis and generate circos and timeseries relative change plots.